US Upper GI Series Market Segmentation
US Upper GI Series Market By Test Type (USD Million, 2025-2035)
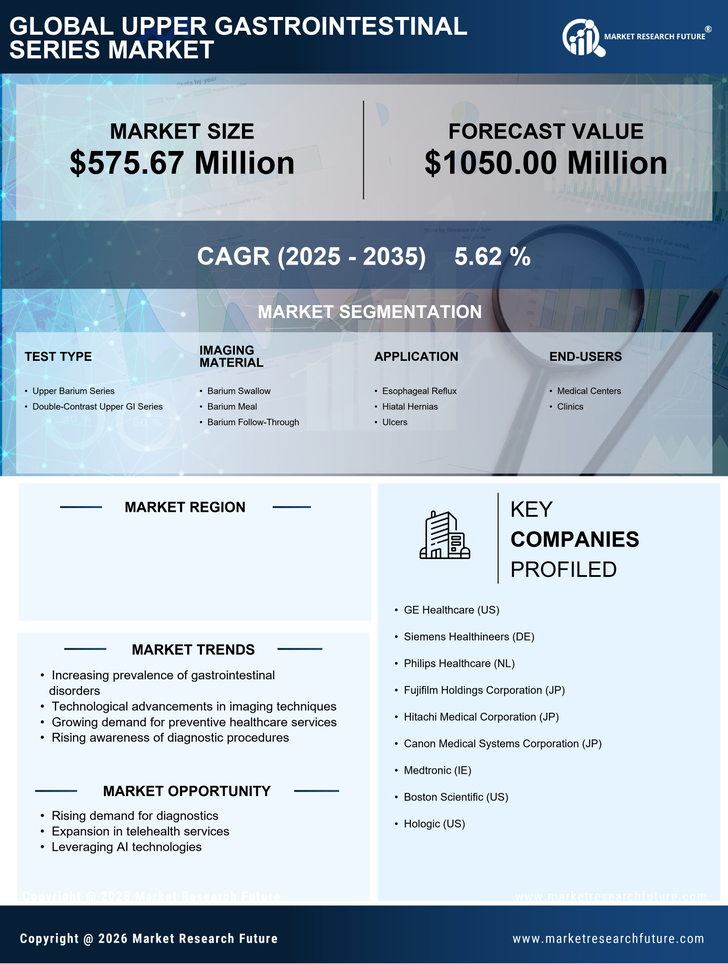
- Upper Barium Series
- Double-Contrast Upper GI Series
US Upper GI Series Market By Imaging Material (USD Million, 2025-2035)
- Barium Swallow
- Barium Meal
- Barium Follow-Through
US Upper GI Series Market By Application (USD Million, 2025-2035)
- Esophageal Reflux
- Hiatal Hernias
- Ulcers
US Upper GI Series Market By End-Users (USD Million, 2025-2035)
- Medical Centers
- Clinics