Viral Vector Manufacturing Market Summary
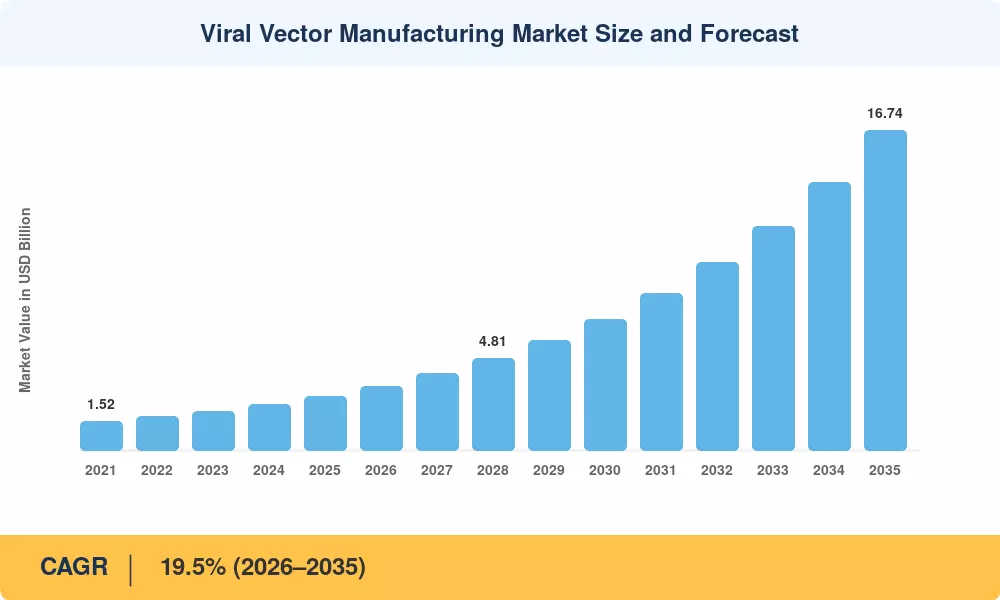
The Viral Vector Manufacturing Market closed 2025 at USD 2.82 billion and is projected to grow to USD 16.74 billion by 2035, expanding at a compound annual growth rate (CAGR) of 19.5% between 2026 and 2035, according to Market Research Future. Market value is expected to reach USD 3.37 billion in 2026 as the first year of the forecast period. This growth is being driven primarily by expanding regulatory approval pipelines for cell and gene therapies in the United States and Europe, along with a fundamental shift in vector manufacturing technology from small-scale adherent systems to large-scale suspension bioreactors.
In the United States, the FDA's Center for Biologics Evaluation and Research (CBER) has publicly targeted 10 to 20 cell and gene therapy approvals per year by 2027 [1]. Each new approval converts clinical-scale vector demand into locked, multi-year commercial supply obligations for manufacturers, creating unusually firm demand visibility across the sector. In the European Union, the Advanced Therapy Medicinal Products (ATMP) regulatory framework has pushed more than 25 advanced therapies through centralized review since 2018 [4], reinforcing a similar approval-to-supply pipeline across EU member states.
Production economics in the industry are also being rebuilt from the ground up. Adherent cell-factory trains, which are labor-heavy, difficult to scale, and capped at roughly 100 liters of equivalent throughput, are being replaced by 500 to 2,000 liter suspension bioreactor platforms that run single-use consumables and closed-system fill lines. This retooling has required significant capital investment: Lonza, Thermo Fisher, and Charles River collectively committed more than USD 2.1 billion to dedicated vector manufacturing suites between 2021 and 2025 [7][9][12]. As a direct result of this shift, suspension processes now routinely deliver three to five times the vector genomes per batch compared to legacy adherent formats, which explains why the Viral Vector Manufacturing Market is growing faster in value than in physical production footprint.
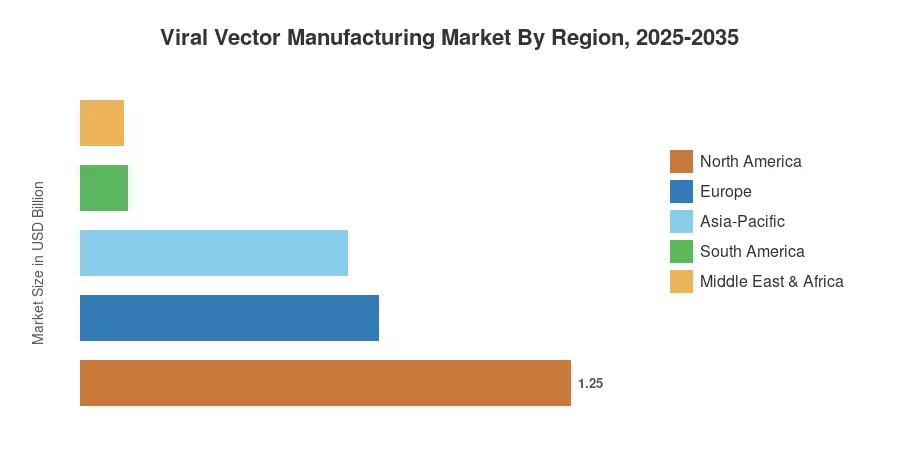
By region, North America holds the largest share of the Viral Vector Manufacturing Market, at approximately 44.5% of 2025 revenue, supported by National Institutes of Health (NIH) funding and FDA-cleared development pipelines. Asia-Pacific is the fastest-growing region, with a projected CAGR of 24.1%, propelled by China's National Medical Products Administration (NMPA) regulatory reforms and Japan's Sakigake fast-track approval pathway. Europe holds the second-largest share, at approximately 27.0%, sustained by Germany's biomanufacturing cluster and the UK's Cell and Gene Therapy Catapult program. The revenue gap between these regions is expected to narrow sharply after 2030 as Asia-Pacific contract development and manufacturing organization (CDMO) capacity matures.
Key Report Takeaways
Analysts tracking the Viral Vector Manufacturing Market should prioritise the following signals.
• By Vector Type
- Adeno-Associated Viral (AAV) Vectors command approximately 38.4% of 2025 revenue, the single largest slice of the Viral Vector Manufacturing Market.
- Lentiviral Vectors generated close to USD 0.71 billion in 2025, driven by ex-vivo CAR-T supply.
- Other Vector Types, including plasmid DNA production feedstock and non-viral hybrids, post the steepest 21.4% CAGR.
• By Sector
- Cancer indications account for roughly 41.8% of demand.
- CDMO-based supply represents about 58.6% of total output.
- In-Vivo Gene Therapy applications hold a near 46.5% share.
• By Region
- North America contributed approximately USD 1.26 billion in 2025.
- Asia-Pacific advances at a 24.1% CAGR, the fastest in the Viral Vector Manufacturing Market.
- Middle East & Africa remains under 4% share but doubles absolute value by 2032.
Market Size and Forecast (2021–2035)
Figures below blend bottom-up CDMO capacity audits, batch-level pricing benchmarks from 38 supply agreements, and top-down triangulation against regulatory filing volumes and disclosed biopharma outsourcing spend. Historical years reflect reported and reconstructed revenue; forecast years apply indication-weighted pipeline conversion rates. The Viral Vector Manufacturing Market is measured at manufacturer realised value, excluding downstream therapy pricing.