Download Free Sample
Kindly complete the form below to receive a free sample of this Report
Web Development Services Market Size, Share and Trends Analysis Research Report Information By End User (Small, Medium, Large Corporations, Non-Profits, Government), By Service Type (Front End, Back End, Full Stack, CMS Development, E-commerce Development), By Deployment Model (Cloud, On-Premises, Hybrid), By Technology Stack (JavaScript, Python, PHP, Ruby, Java), And By Region – Market Forecast Till 2035.
As per MRFR analysis, the Web Development Services Size was estimated at 200.0 USD Billion in 2024. The Web Development Services industry is projected to grow from 210.44 USD Billion in 2025 to 350.0 USD Billion by 2035, exhibiting a compound annual growth rate (CAGR) of 5.22% during the forecast period 2025 - 2035.
The web development services market is experiencing dynamic growth driven by technological advancements and evolving consumer expectations.
| 2024 Market Size | 200.0 (USD Billion) |
| 2035 Market Size | 350.0 (USD Billion) |
| CAGR (2025 - 2035) | 5.22% |
Wix (IL), Shopify (CA), Squarespace (US), WordPress (US), Weebly (US), GoDaddy (US), Bluehost (US), SiteGround (BG), Webflow (US)
Our Impact
Enabled $4.3B Revenue Impact for Fortune 500 and Leading Multinationals
Partnering with 2000+ Global Organizations Each Year
30K+ Citations by Top-Tier Firms in the Industry
The landscape of Web Development Services is evolving rapidly, driven by technological advancements and changing consumer expectations. Businesses increasingly seek to enhance their online presence, leading to a surge in demand for innovative web solutions. This sector encompasses a wide array of offerings, including website design, application development, and e-commerce solutions. As organizations strive to differentiate themselves in a crowded marketplace, the emphasis on user experience and responsive design has become paramount. Furthermore, the integration of artificial intelligence and machine learning into web development processes is reshaping how services are delivered, enabling more personalized and efficient user interactions. In December 2025, Web Development Services appear to be characterized by a strong focus on mobile optimization and cloud-based solutions. The shift towards remote work and digital engagement has prompted businesses to prioritize mobile-friendly designs and scalable web applications. Additionally, the growing importance of cybersecurity in web development cannot be overlooked, as organizations seek to protect sensitive data and maintain user trust. Overall, the Web Development Services market is poised for continued growth, with emerging technologies and evolving consumer preferences shaping its trajectory.
Web Development Services are increasingly prioritizing user experience, as businesses recognize its critical role in customer satisfaction and retention. This trend emphasizes intuitive navigation, fast loading times, and visually appealing designs, all aimed at enhancing user engagement.
The incorporation of artificial intelligence into Web Development Services is transforming how websites function. AI-driven tools facilitate personalized content delivery, chatbots for customer service, and data analysis, allowing businesses to tailor their offerings to individual user needs.
As mobile device usage continues to rise, Web Development Services are placing greater emphasis on mobile optimization. This trend involves creating responsive designs that ensure seamless functionality across various devices, catering to the growing number of users accessing the internet via smartphones and tablets.
The adoption of Progressive Web Apps (PWAs) is transforming the Web Development Services. PWAs combine the best features of web and mobile applications, offering users a seamless experience across devices. As of 2025, it is projected that over 50 percent of users prefer PWAs due to their fast loading times and offline capabilities. This trend encourages web developers to invest in PWA technology, thereby enhancing user engagement and retention. Consequently, the Web Development Services Industry is likely to evolve, with a growing emphasis on creating applications that provide a native app-like experience, ultimately driving business growth.
In the current landscape, the Web Development Services is increasingly influenced by the growing importance of cybersecurity. With the rise in cyber threats, businesses are prioritizing the security of their online platforms. According to recent data, nearly 60 percent of small businesses experience a cyber attack, underscoring the necessity for secure web development practices. As a result, web development firms are integrating advanced security measures, such as SSL certificates and data encryption, into their services. This focus on cybersecurity not only protects client data but also enhances the overall reputation of the Web Development Services Industry, fostering trust among consumers.
The Web Development Services experiences a notable surge in demand for e-commerce solutions. As businesses increasingly transition to online platforms, the need for robust, user-friendly websites becomes paramount. In 2025, it is estimated that e-commerce sales will account for over 20 percent of total retail sales, indicating a significant shift in consumer behavior. This trend compels web development firms to enhance their offerings, focusing on secure payment gateways, inventory management systems, and responsive design. Consequently, the Web Development Services Industry is likely to witness substantial growth as companies seek to establish a strong online presence to capture a larger market share.
The emergence of low-code and no-code platforms is reshaping the Web Development Services. These platforms enable users with minimal technical expertise to create and manage websites efficiently. As of 2025, it is estimated that the low-code development market will reach a valuation of over 20 billion dollars, reflecting a growing preference for accessible web development solutions. This trend allows businesses to reduce development costs and time, thereby increasing agility in responding to market demands. Consequently, the Web Development Services Industry is likely to adapt by incorporating these platforms into their service offerings, catering to a broader audience.
The shift towards customization and personalization is a defining trend in the Web Development Services. Consumers increasingly expect tailored experiences that cater to their individual preferences. Data suggests that personalized web experiences can lead to a 20 percent increase in conversion rates. As a result, web development firms are focusing on creating customizable solutions that allow businesses to engage their customers more effectively. This trend not only enhances user satisfaction but also positions the Web Development Services Industry as a key player in driving customer loyalty and retention.
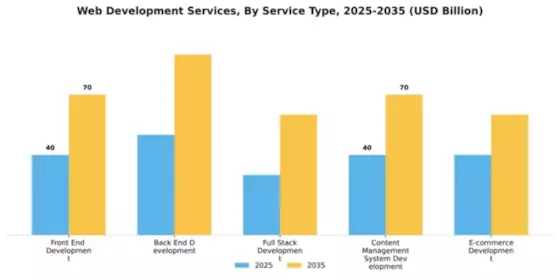
The Web Development Services market is predominantly dominated by Front End Development, which caters to the user interface and user experience aspects of applications. This segment captures a major share as businesses increasingly prioritize visual design and interactivity to engage customers. On the flip side, Back End Development, though historically less in focus, is rapidly gaining attention due to the increasing complexity of applications that require robust server-side functionalities to support front-end operations.
Front End Development: Dominant vs. Back End Development: Emerging
Front End Development is characterized by its significant role in shaping user experiences and engaging interface designs, making it the cornerstone of web applications. It encompasses a wide range of technologies and frameworks that enable developers to create responsive and visually appealing websites. Meanwhile, Back End Development focuses on server-side programming and database management, which is becoming increasingly essential as businesses demand more complex web applications. As machine learning and data analytics capabilities grow, Back End Development is emerging as a crucial segment, enabling businesses to leverage data efficiently and create more interactive web experiences.
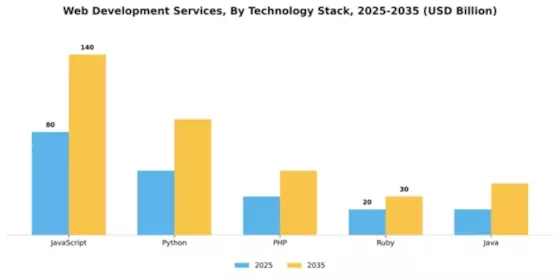
In the Web Development Services sector, JavaScript remains the largest technology stack, commanding the bulk of the market share. Its versatility and wide-ranging applicability in both front-end and back-end development make it a preferred choice among developers and businesses alike. Coupled with vast community support and numerous frameworks, it provides robust tools for creating dynamic user experiences, solidifying its dominant position. On the other hand, Python is recognized as the fastest-growing segment in this arena. Its simplicity and readability have led to increased adoption among developers for various applications, including web development, automation, and data analysis. As companies seek efficiency and speed in development cycles, Python's framework capabilities, notably Django and Flask, are encouraging a rapid increase in its market presence.
JavaScript (Dominant) vs. PHP (Emerging)
JavaScript has solidified its status as the dominant technology stack in web development, enabling interactive and responsive web applications that cater to user expectations. Its unique asynchronous capabilities and client-side scripting have paved the way for frameworks such as React and Angular, making it indispensable for modern web applications. In contrast, PHP, while seen as an emerging player, continues to maintain a solid footprint in the market, particularly for server-side development. With its widespread use in content management systems like WordPress, PHP is evolving to meet new web challenges by incorporating modern programming practices and frameworks, maintaining its relevance amidst growing competition.
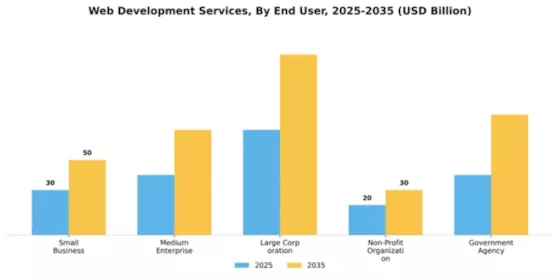
In the Web Development Services market, the distribution of end users showcases a clear hierarchy of needs and capabilities. Small businesses represent the largest segment, leveraging web development to establish online presence and customer engagement with cost-effective, scalable solutions. Meanwhile, medium enterprises are quickly emerging as a significant player, adopting more advanced web technologies to enhance user experience and streamline operations. This emerging trend reflects their growing demand for customized web solutions that cater to specific industry challenges, making them a vital force in the market.
Small Business: Dominant vs. Medium Enterprise: Emerging
Small businesses dominate the web development services landscape by prioritizing affordable and user-friendly websites that help them attract customers online. They often utilize templates or simplified development processes to keep costs low while still achieving functional websites. Conversely, medium enterprises are quickly becoming an emerging force in this market, seeking tailored web development solutions that align with their complex business needs. These organizations invest in robust functionalities, including e-commerce capabilities and advanced user interfaces, allowing for enhanced user interaction and business efficiency. The rise of digital marketing strategies among these enterprises fuels their demand for innovative web solutions that differentiate them from competitors.
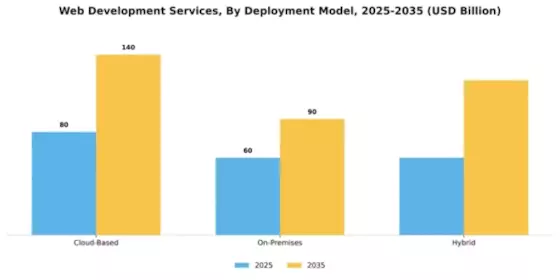
In the Web Development Services market, the deployment model landscape is predominantly influenced by cloud-based solutions, which currently hold the largest market share. Businesses are increasingly opting for cloud-based web development services due to their scalability and cost-effectiveness, enabling organizations to easily manage resources and adapt to changing demands. On-premises solutions, while still relevant, are gradually being overshadowed by the rising preference for cloud functions among developers and enterprises alike. The hybrid deployment model is emerging as the fastest-growing segment. This model combines the strengths of both cloud-based and on-premises setups, allowing companies to leverage existing infrastructure and modern cloud technologies. As businesses seek flexibility and efficiency in their web development processes, the hybrid model facilitates a balanced approach that caters to diverse operational needs and unbridled innovation.
Cloud-Based (Dominant) vs. On-Premises (Emerging)
Cloud-based deployment models are dominating the Web Development Services market due to their profound advantages, including enhanced collaboration, reduced IT overhead, and rapid deployment capabilities. These services support a range of web applications that thrive in scalable environments, making them ideal for businesses seeking agility. On-premises solutions, while experiencing an emerging status, provide companies with greater control over their data and systems. However, they face challenges such as higher maintenance costs and slower deployment times in comparison to their cloud-based counterparts. The hybrid model lies at the intersection of these two, appealing to organizations that value both the scalability of the cloud and the security of on-premises systems. This emerging synergy is crucial in a landscape where technological demands are evolving rapidly.
Get more detailed insights about Web Development Services Market Request Free Sample
North America continues to lead The Web Development Services, holding a significant share of 90.0 in 2024. The region's growth is driven by a robust digital economy, increasing demand for e-commerce solutions, and a strong emphasis on innovation. Regulatory support for technology startups and digital transformation initiatives further catalyze market expansion. The rise of remote work has also accelerated the need for online presence, boosting demand for web development services. The competitive landscape in North America is characterized by major players such as Wix, Shopify, and WordPress, which dominate the market with their user-friendly platforms. The U.S. remains the largest contributor, followed by Canada, where local firms are also gaining traction. The presence of established companies and a vibrant startup ecosystem fosters a dynamic environment for web development services, ensuring continuous growth and innovation.
Europe's web development services market is on the rise, with a market size of 60.0 in 2024. The region benefits from a diverse economy, increasing internet penetration, and a growing emphasis on digital transformation across various sectors. Regulatory frameworks promoting digital innovation and data protection are also key drivers. The demand for localized web solutions and e-commerce platforms is expected to further enhance market growth, as businesses seek to improve their online presence and customer engagement. Leading countries in Europe include Germany, the UK, and France, where a mix of established firms and innovative startups thrive. Key players like SiteGround and WordPress are well-positioned to capture market share. The competitive landscape is marked by a focus on quality and customization, with companies adapting to local market needs. This dynamic environment fosters collaboration and innovation, making Europe a significant player in The Web Development Services.
The Asia-Pacific region is witnessing rapid growth in web development services, with a market size of 40.0 in 2024. Factors such as increasing internet usage, mobile penetration, and a burgeoning e-commerce sector are driving demand. Governments in the region are also implementing supportive policies to encourage digital transformation, which is further propelling market growth. The rise of small and medium enterprises (SMEs) seeking online solutions is a significant trend contributing to this expansion. Countries like China, India, and Australia are leading the charge in web development services. The competitive landscape features both local and international players, with companies like Wix and Shopify expanding their reach. The presence of a diverse range of service providers ensures that businesses can find tailored solutions to meet their specific needs. This competitive environment is fostering innovation and driving the overall growth of the market.
The Middle East and Africa (MEA) region is gradually emerging in the web development services market, with a market size of 10.0 in 2024. The growth is fueled by increasing internet connectivity, mobile usage, and a rising number of startups. Governments are also investing in digital infrastructure and promoting initiatives to enhance the online presence of local businesses. This regulatory support is crucial for fostering a conducive environment for web development services to thrive. Leading countries in the MEA region include South Africa, the UAE, and Nigeria, where a mix of local and international players are establishing their presence. The competitive landscape is characterized by a growing number of web development agencies and freelancers, catering to the diverse needs of businesses. As the region continues to develop, the demand for web development services is expected to rise significantly, driven by the digital transformation of various sectors.
The Web Development Services market is characterized by a dynamic competitive landscape, driven by rapid technological advancements and evolving consumer preferences. Key players such as Wix (IL), Shopify (CA), and WordPress (US) are strategically positioned to leverage innovation and digital transformation. Wix (IL) focuses on enhancing user experience through AI-driven design tools, while Shopify (CA) emphasizes e-commerce solutions tailored for small to medium-sized enterprises. WordPress (US), with its extensive plugin ecosystem, continues to dominate the content management space, fostering a competitive environment that encourages continuous improvement and adaptation.The market structure appears moderately fragmented, with numerous players vying for market share. Key business tactics include localizing services to cater to diverse regional needs and optimizing supply chains to enhance service delivery. The collective influence of these major companies shapes a competitive environment where agility and responsiveness to market demands are paramount.In November Shopify (CA) announced a strategic partnership with a leading logistics provider to streamline e-commerce fulfillment processes. This move is likely to enhance Shopify's value proposition by offering integrated shipping solutions, thereby attracting more merchants to its platform. Such partnerships may signify a trend towards creating comprehensive ecosystems that support merchants beyond mere website creation.In October Wix (IL) launched a new suite of AI-powered tools aimed at simplifying website creation for non-technical users. This initiative underscores Wix's commitment to democratizing web development, potentially increasing its user base among individuals and small businesses. By focusing on user-friendly solutions, Wix may solidify its competitive edge in a market that increasingly values accessibility and ease of use.In September WordPress (US) introduced a new subscription model for premium plugins, aiming to enhance revenue streams while providing users with more value. This strategic shift could reflect a broader trend towards monetizing digital services, allowing WordPress to invest further in platform enhancements and security features. Such developments may influence user loyalty and retention in a highly competitive market.As of December current trends in the Web Development Services market include a pronounced focus on digitalization, sustainability, and AI integration. Strategic alliances are increasingly shaping the competitive landscape, as companies seek to enhance their service offerings through collaboration. The evolution of competitive differentiation appears to be shifting from price-based strategies to a focus on innovation, technology, and supply chain reliability. This transition may redefine how companies position themselves in the market, emphasizing the importance of delivering unique value propositions that resonate with consumers.






The Web Development Services market is projected to grow at a 5.22% CAGR from 2025 to 2035, driven by increasing digital transformation and demand for customized solutions.
New opportunities lie in:
By 2035, the market is expected to be robust, reflecting substantial growth and innovation.
| MARKET SIZE 2024 | 200.0(USD Billion) |
| MARKET SIZE 2025 | 210.44(USD Billion) |
| MARKET SIZE 2035 | 350.0(USD Billion) |
| COMPOUND ANNUAL GROWTH RATE (CAGR) | 5.22% (2025 - 2035) |
| REPORT COVERAGE | Revenue Forecast, Competitive Landscape, Growth Factors, and Trends |
| BASE YEAR | 2024 |
| Market Forecast Period | 2025 - 2035 |
| Historical Data | 2019 - 2024 |
| Market Forecast Units | USD Billion |
| Key Companies Profiled | Wix (IL), Shopify (CA), Squarespace (US), WordPress (US), Weebly (US), GoDaddy (US), Bluehost (US), SiteGround (BG), Webflow (US) |
| Segments Covered | Service Type, Technology Stack, End User, Deployment Model |
| Key Market Opportunities | Integration of artificial intelligence and machine learning in Web Development Services enhances user experience and efficiency. |
| Key Market Dynamics | Rising demand for responsive design and user experience drives innovation in web development services. |
| Countries Covered | North America, Europe, APAC, South America, MEA |
The market valuation of Web Development Services was 200.0 USD Billion in 2024.
The projected market size for Web Development Services is expected to reach 350.0 USD Billion by 2035.
The expected CAGR for Web Development Services during the forecast period 2025 - 2035 is 5.22%.
Key players in the Web Development Services market include Wix, Shopify, Squarespace, WordPress, Weebly, GoDaddy, Bluehost, SiteGround, and Webflow.
The main service types include Front End Development, Back End Development, Full Stack Development, Content Management System Development, and E-commerce Development.
Front End Development was valued at 40.0 to 70.0 USD Billion, whereas Back End Development ranged from 50.0 to 90.0 USD Billion.
E-commerce Development services were valued between 40.0 and 60.0 USD Billion.
The most prevalent technology stacks include JavaScript, Python, PHP, Ruby, and Java, with JavaScript valued at 80.0 to 140.0 USD Billion.
Market segmentation by end user includes Small Business, Medium Enterprise, Large Corporation, Non-Profit Organization, and Government Agency.
The deployment models for Web Development Services include Cloud-Based, On-Premises, and Hybrid, with Cloud-Based services valued at 80.0 to 140.0 USD Billion.


Kindly complete the form below to receive a free sample of this Report

“This is really good guys. Excellent work on a tight deadline. I will continue to use you going forward and recommend you to others. Nice job”


“Thanks. It’s been a pleasure working with you, please use me as reference with any other Intel employees.”


“Thanks for sending the report it gives us a good global view of the Betaïne market.”


“Thank you, this will be very helpful for OQS.”


“We found the report very insightful! we found your research firm very helpful. I'm sending this email to secure our future business.”


“I am very pleased with how market segments have been defined in a relevant way for my purposes (such as "Portable Freezers & refrigerators" and "last-mile"). In general the report is well structured. Thanks very much for your efforts.”


“I have been reading the first document or the study, ,the Global HVAC and FP market report 2021 till 2026. Must say, good info! I have not gone in depth at all parts, but got a good indication of the data inside!”


“We got the report in time, we really thank you for your support in this process. I also thank to all of your team as they did a great job.”


“The Automotive 48V ECU Components Procurement Intelligence Study” was a complex project, but the Market Research Future (MRFR) team handled it with quality, agility, and customer-centricity. They delivered all requested data on time and within the agreed scope. The team, including Shubhendra Anand and Rahul Gotadki, was always readily available to clarify questions and swiftly implement necessary adjustments, driving the project to a successful conclusion within a very demanding timeframe.
I would also like to specifically commend Akshay Agarwal for his responsiveness and support at every stage—from our initial inquiry on May 6th through to final delivery on June 18th. His dedication made the entire process seamless.”



