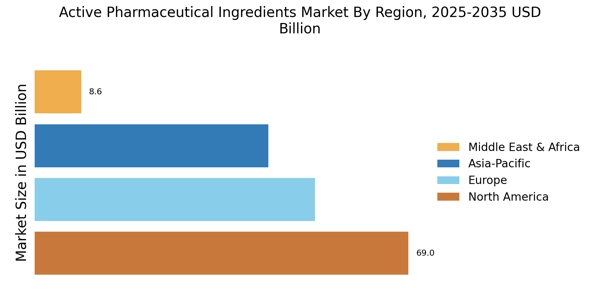
根据MRFR的分析,活性药物成分市场规模在2024年估值为1726亿美元。预计市场将从2025年的1845.4亿美元增长到2035年的3603.3亿美元,在2025年至2035年期间注册年均增长率为6.92%。北美以超过39.98%的市场份额领先,产生约690亿美元的收入。
活性药物成分市场因全球疾病负担上升、对仿制药和专用药物需求增加以及制药制造增长而扩展。关键趋势包括向复杂和高效能API的转变、外包的扩展以及加强全球供应链以确保药物的持续可用性和可负担性。
世界卫生组织强调,非传染性疾病占全球死亡人数的近74%,显著增加了对长期制药治疗和API的需求。
主要市场趋势和亮点
活性药物成分市场正在经历强劲增长,受到不断变化的医疗需求和技术进步的推动。
市场规模与预测
| 2024 Market Size | k 2024年市场规模 v 172.6(美元十亿) |
| 2035 Market Size | k 2035年市场规模 v 360.33(美元十亿) |
| CAGR (2025 - 2035) | k 年均增长率(2025 - 2035) v 6.92% |
主要参与者
如BASF SE(德国)、博尔赫格因药业有限公司(德国)、Teva制药工业有限公司(以色列)、Sandoz国际有限公司(瑞士)、Lonza集团(瑞士)、Aurobindo制药有限公司(印度)、富士胶片Diosynth生物技术(日本)、Hikma制药PLC(英国)、Mylan N.V.(荷兰)、Dr. Reddy's Laboratories有限公司(印度)等公司是全球活性药物成分市场的一些主要参与者。