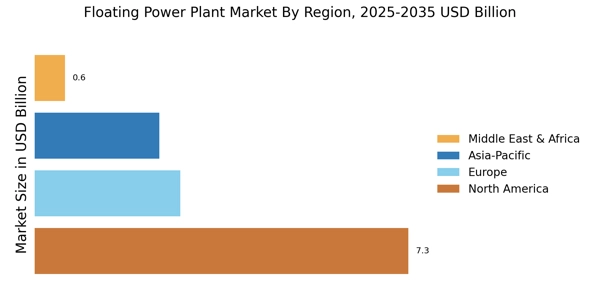
Capacity deployment mapping and vessel-specific revenue analysis were employed to determine the global market valuation. The methodology comprised the following:
The identification of over 40 significant manufacturers in North America, Europe, Asia-Pacific, and Latin America who specialize in power ships, power barges, and floating structures
Technology mapping for floating solar photovoltaic (FPV), floating offshore wind (FOW), floating wind and wave hybrid, floating nuclear power plants (FNPP), and gas turbine power vessels
Examination of annual revenues that are specific to floating power generation portfolios, including EPC contract values and charter rates, as reported and modeled
70-75% of the global market share in 2024 will be represented by manufacturers and vessel operators.
Extrapolation is employed to generate segment-specific valuations by combining bottom-up (installed MW capacity × unit CAPEX/OPEX by country/technology) and top-down (shipyard revenue validation and maritime fleet valuation) methods.