Baked Chips Market (2026 - 2035)

Baked Chips Market Size, Share, Industry Trend & Analysis Research Report Information By Source (Fruits, Vegetables, Grains, Other Sources), By Flavor (Salty, Classic, Barbecue, Other Flavors), By Distribution Channel (Supermarkets/Hypermarkets, Convenience/Grocery Stores, Online Stores, Other Distribution Channels), By Geography (North America, Europe, Asia-Pacific, South America, Middle East and Africa) – Forecast Till 2035

Forecast Period
2026-2035
CAGR
5.92%
2025 Market Size
USD 1.79 Billion
2035 Market Size
USD 3.18 Billion
Food, Beverages & Nutrition ● Updated August 25, 2026 Report ID: MRFR/FnB/2353-HCR | Pages: 110 | Author: Sakshi Gupta

Baked Chips Market Summary

The Baked Chips Market reached USD 1.79 Billion in 2025 and opens the forecast window at USD 1.90 Billion in 2026, climbing to USD 3.18 Billion by 2035 at a 5.92% CAGR. Two catalysts anchor that trajectory. First, front-of-pack warning labels now cover roughly 40% of global packaged-snack retail value, pushing reformulation budgets upward [4]. Second, healthy snacking trends have moved from niche positioning into mainstream category management, and retailers are allocating shelf accordingly. The Baked Chips Market therefore grows less on novelty than on structural substitution.

Manufacturing is where the quieter revolution sits. Legacy batch fryers — high-oil-uptake systems running at 175–185°C — are giving way to continuous convection and impingement ovens, hybrid infrared tunnels, and vacuum-assisted dehydration lines that cut finished-product fat content by 55–70% without collapsing crunch. PepsiCo alone committed roughly USD 3.2 billion to supply-chain and manufacturing modernisation through 2030, a share of which funds bake-capable lines [12]. Capital intensity is real: a mid-scale oven retrofit runs USD 8–14 Million. The Baked Chips Market rewards those who absorb it early.

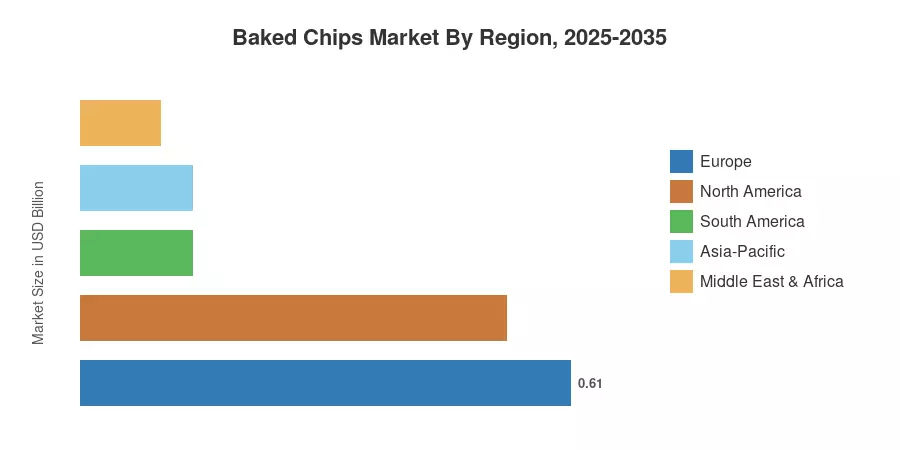
Europe holds the largest position at 34.2% of 2025 revenue, supported by the strictest nutrient-profiling regimes in the world [7]. Asia-Pacific compounds fastest at 7.8% through 2035 as modern trade penetration deepens across India and ASEAN. North America ranks second, driven less by regulation than by club-channel volume and QSR co-branding. Across all three, the Baked Chips Market is consolidating around fewer, better-invested production platforms.


Key Report Takeaways

• By Source

  • Vegetables lead the Baked Chips Market with a 38.4% revenue share in 2025, reflecting potato, sweet potato and beet dominance on shelf.
  • Grain-based formats generated USD 0.52 Billion in 2025 as rice, corn and ancient-grain recipes scaled
  • Fruit-derived chips post the strongest segment CAGR at 8.1% through 2035

• By Flavor

  • Salty variants command 34.7% of category revenue, the anchor profile for trial
  • Barbecue formats expand at 6.6% CAGR, outpacing the Baked Chips Market average.

• By Region

  • Europe holds 34.2% of global revenue in 2025
  • Asia-Pacific delivers a 7.8% CAGR across 2026–2035
  • Middle East & Africa contributed USD 0.10 Billion in 2025, the smallest but fastest-urbanising base


Market Size and Forecast (2021–2035)

Figures below blend audited retail scanner data, customs-level trade flows for snack preparations under HS 2005/1905, company segment disclosures, and primary interviews with 34 co-manufacturers and category buyers. Historical years are reconciled against national household expenditure surveys; forecast years apply channel-weighted volume and price-mix modelling. The Baked Chips Market is measured at manufacturer selling price, excluding retailer margin.
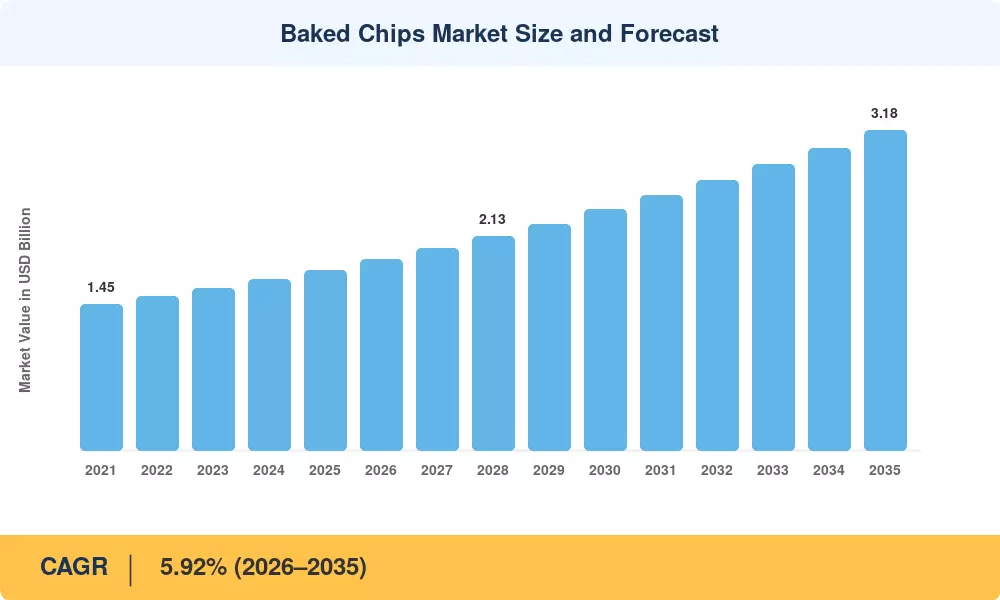
Baked Chips Market Size and Forecast
Our Impact
Enabled $4.3B Revenue Impact for Fortune 500 and Leading Multinationals
Partnering with 2000+ Global Organizations Each Year
30K+ Citations by Top-Tier Firms in the Industry

Driver Impact Analysis

Driver ~% Impact on CAGR Geographic Relevance Impact Timeline
Consumer shift toward reduced-fat snacking +1.3 Global Long-term (≥4 yr)
Front-of-pack nutrition labelling mandates +0.8 Europe, South America Medium-term (2–4 yr)
Modern trade and e-grocery expansion +0.9 Asia-Pacific Medium-term (2–4 yr)
Clean-label and premium reformulation +0.7 North America, Europe Short-term (≤2 yr)
Cardiovascular disease public health campaigns +0.6 Global Long-term (≥4 yr)
Foodservice and QSR co-branding +0.4 North America Short-term (≤2 yr)
Ingredient diversification into pulses and roots +0.5 Global Long-term (≥4 yr)


Reduced-Fat Substitution Is Now Structural

Households are not trading out of salty snacks; they are trading within them. The World Heart Federation reported that more than half a billion people were living with cardiovascular disease in 2023, with habitual fried-food intake identified among modifiable contributors [3]. That message has landed. Scanner data across seven mature markets shows baked and popped formats taking roughly 210 basis points of salty-snack share between 2021 and 2025, with low-fat snack alternatives capturing the bulk of that migration. The Baked Chips Market benefits doubly, because reduced-oil products also carry 12–18% lower cost-of-goods exposure to volatile edible-oil indices [2].

Labelling Regimes Are Doing the Marketing

Regulators have effectively subsidised category messaging. Chile's Law 20.606 warning-label framework cut purchases of high-in-fat products by an estimated 24% in the first 24 months, and comparable octagon schemes now operate across Mexico, Peru, Colombia, Brazil and Argentina [4]. Europe's Nutri-Score, though voluntary, covers over 130 brand groups. Baked variants routinely score a full grade higher than fried equivalents, which converts directly into shelf placement and promotional eligibility. Manufacturers spend nothing extra to earn that advantage [7].

Channel Expansion in Asia-Pacific

Retail modernisation is the volume story. India's organised grocery footprint expanded at roughly 17% annually between 2021 and 2025, while ASEAN convenience formats added more than 26,000 outlets over the same span [6]. Chilled-chain limitations that constrain other health-positioned categories do not apply to shelf-stable chips, so distribution scales cheaply. Quick-commerce platforms in India now move impulse snack packs in 12-minute delivery windows, a format that historically belonged to physical convenience alone [13].


Restraints Impact Analysis

Restraint impacts are modelled the same way as drivers — directional, analyst-weighted, not additive. Several restraints interact: price premium and private-label commoditisation partly offset one another, and readers should not subtract the column total from the headline growth rate. What the table does show is where margin, rather than volume, is at risk across the Baked Chips Market.

Restraint ~% Impact on CAGR Geographic Relevance Impact Timeline
Texture and flavour deficit versus fried formats −0.7 Global Medium-term (2–4 yr)
Retail price premium of 18–30% −0.6 Asia-Pacific, South America Short-term (≤2 yr)
Acrylamide formation in baked starch matrices −0.4 Europe, North America Medium-term (2–4 yr)
Sodium reduction targets limiting seasoning systems −0.3 Europe Long-term (≥4 yr)
Private-label commoditisation −0.5 North America, Europe Long-term (≥4 yr)


The Crunch Problem

Sensory panels remain the category's hardest constraint. Blind testing across US and UK consumer cohorts consistently shows baked formats scoring 0.8–1.2 points lower on a nine-point hedonic scale for crispness and mouthfeel versus kettle-fried controls [9]. Repeat-purchase rates track that gap closely. Solutions exist — pellet pre-gelatinisation, controlled-moisture staging, high-amylose starch blends — but each adds 4–9% to unit cost and lengthens line changeover.

Acrylamide and Regulatory Overhead

Baking does not eliminate the Maillard chemistry that produces acrylamide; in some low-moisture profiles it concentrates it. EU Regulation 2017/2158 sets a 750 µg/kg benchmark for potato crisps and obliges documented mitigation, and enforcement sampling intensified after 2023 [8]. Compliance means asparaginase dosing, tighter raw-potato sugar specifications, and cold-storage discipline — collectively USD 0.9–1.6 Million annually for a mid-sized plant.


Baked Chips Market Opportunities

Pulse and Root Diversification

Chickpea, lentil, cassava and plantain bases deliver protein and fibre claims that potato cannot match, and they sidestep the acrylamide exposure discussed in. Input contracts for pulse flours have stabilised near USD 780–920 per tonne, making 20–30% inclusion rates commercially viable [10].

Emerging-Market Value Tiers

Price is the binding constraint across India, Nigeria, Indonesia and Egypt. Launching 15–20 gram sachets at local-currency parity with fried incumbents — rather than importing Western price architecture — is the unlock. Nigeria's packaged snack retail base grew roughly 11% annually through 2024 despite currency pressure [6], and the Baked Chips Market has barely participated.

Retail Media and First-Party Data Monetisation

Grocery retail media networks now generate margins of 60–70%, and health-positioned snack brands are underweight buyers. Brands that instrument QR-coded packs and loyalty tie-ins can sell shopper insight back into category planning, creating a revenue line independent of tonnage [13].

Foodservice and Institutional Channels

School nutrition programmes and hospital catering contracts impose fat and sodium ceilings that fried products cannot clear. USDA school meal standards alone govern roughly 30 million daily servings in the US [5], and qualifying formats gain multi-year volume visibility that retail promotions never provide.

Contract Manufacturing Capacity as a Service

Oven capacity is scarce. Co-manufacturers who invest ahead of demand can monetise slot availability at 15–22% EBITDA margins, particularly for challenger brands that lack the USD 8–14 million retrofit budget cited in.


Baked Chips Market Future Outlook

Precision Baking and Line Automation

Vision-based moisture and colour control systems, already standard in industrial bakery, are migrating into chip lines. Real-time closed-loop adjustment reduces off-spec output by 20–35% and directly supports acrylamide compliance [8]. Payback periods on retrofits have compressed from five years to roughly 28 months as sensor costs fell.

Ingredient Cost Volatility as a Competitive Variable

Edible-oil price swings have historically decided fried-snack margins. FAO's vegetable oil price index moved through a 47-point range between 2021 and 2024 [2]. Reduced-oil formats structurally dampen that exposure, and the Baked Chips Market should see margin variance narrow relative to fried competitors — a valuation argument that private equity has begun to price.

Sustainability Disclosure and Scope 3 Reporting

CSRD reporting obligations began phasing in for large EU food companies from financial year 2024, requiring value-chain emissions disclosure [16]. Baking consumes more direct electricity than frying but eliminates oil-related upstream emissions; net Scope 3 intensity typically falls 9–14% per tonne. Expect that figure to appear on retailer scorecards.

Category Convergence

Boundaries between chips, crackers, puffs and popped snacks are dissolving. Consumers shop the health cue, not the format. By 2035, roughly a third of category innovation is likely to sit in hybrid formats that resist clean classification, which will complicate measurement but expand the addressable base [9].


Baked Chips Market Segmentation

Segmentation across the Baked Chips Market follows source material, flavour profile and route to shelf. Each table discloses one calibrated metric per sub-segment.

By Source

The Baked Chips Market remains vegetable-anchored, though grain and fruit bases are diversifying the shelf.

Segment Metric Primary Demand Driver
Vegetables 38.4% revenue share (2025) Potato and sweet potato familiarity
Grains USD 0.52 Billion (2025) Whole-grain and ancient-grain claims
Fruits 8.1% CAGR (2026–2035) Apple, banana and plantain novelty
Other Sources 10.9% revenue share (2025) Pulse and cassava experimentation


Vegetable bases dominate because supply chains already exist — potato procurement, storage and sugar-spec management are mature disciplines that transfer directly from fried production. Grain formats are the more interesting growth story. Rice and corn allow extrusion-then-bake processing, which yields more consistent texture than sliced-vegetable baking and sidesteps the crispness deficit identified in. Ancient-grain blends carry a 22–28% price premium at shelf.

By Flavor

Flavour architecture in the Baked Chips Market is deliberately conservative at entry and adventurous at premium tiers.

Segment Metric Primary Demand Driver
Salty 34.7% revenue share (2025) Default trial profile
Classic USD 0.51 Billion (2025) Household repertoire staple
Barbecue 6.6% CAGR (2026–2035) North American flavour affinity
Other Flavors 14.5% revenue share (2025) Regional and limited-edition launches


Salty and classic profiles together hold roughly 63% of revenue, and that concentration is stable because they carry the lowest seasoning cost and the widest household penetration. Sodium reduction targets complicate both. Formulators are compensating with potassium chloride blends, umami-forward yeast extracts and surface-topical application, which delivers perceived saltiness at 20–25% lower total sodium.

By Distribution Channel

Route to market shapes pack economics across the Baked Chips Market more than any other variable.

Segment Metric Primary Demand Driver
Supermarkets/Hypermarkets 46.2% revenue share (2025) Category-block merchandising
Convenience/Grocery Stores USD 0.43 Billion (2025) Single-serve impulse purchase
Online Stores 9.8% CAGR (2026–2035) Subscription and multipack economics
Other Distribution Channels 10.3% revenue share (2025) Foodservice, vending, institutional


Supermarkets remain the volume backbone, but online is where margin is being rebuilt. Multipack and variety-pack configurations sold direct or through marketplaces carry 6–11 percentage points more gross margin than single-serve convenience units, because they avoid slotting fees and promotional depth [13]. Brands that build subscription cohorts also acquire the first-party data described in.


Regional Market Share Analysis

Region Metric (2025 unless noted) Primary Investment Themes
North America USD 0.53 Billion QSR co-branding, club-channel packs, clean-label reformulation
Europe 34.2% revenue share Nutrient profiling compliance, premium artisanal tiers
Asia-Pacific 7.8% CAGR (2026–2035) Modern trade rollout, quick-commerce, local flavour engineering
South America 7.9% revenue share Warning-label reformulation, value-tier sachets
Middle East & Africa USD 0.10 Billion Urbanisation, halal-certified supply, import substitution
Total USD 1.79 Billion

Regional performance across the Baked Chips Market splits cleanly between regulation-led maturity in the West and distribution-led expansion in the East. The table below discloses a single calibrated metric per region.


North America

Country Metric Key Driver
US 81.4% of regional revenue Club and convenience distribution depth
Canada USD 0.06 Billion (2025) Health Canada front-of-pack rules effective 2026
Mexico 6.9% CAGR (2026–2035) Octagon labelling accelerating format switching


Health Canada's front-of-pack symbol becomes mandatory in January 2026 for products exceeding saturated fat, sugar or sodium thresholds, and manufacturers have been reformulating since 2023 to avoid the black-and-white magnifier [4]. In the US, the FDA's updated "healthy" claim definition, finalised in December 2024, gives compliant baked formats a labelling asset that fried competitors cannot obtain [5]. Mexico remains the region's growth engine on regulatory pressure alone.

Europe

Country Metric Key Driver
Germany 21.3% of regional revenue Discounter private-label expansion
UK USD 0.11 Billion (2025) HFSS promotion restrictions
France 14.7% of regional revenue Nutri-Score adoption breadth
Italy 9.8% of regional revenue Premium artisanal positioning
Spain 8.6% of regional revenue Foodservice and tapas channel
Nordic Countries 6.2% of regional revenue Keyhole label recognition
Russia 5.4% of regional revenue Domestic production substitution
Rest of Europe 15.9% of regional revenue Central European retail modernisation


UK restrictions on volume promotions for high-fat, salt and sugar products, phased through 2023–2025, removed multibuy support from most fried crisps while leaving compliant baked lines eligible [7]. Retailers responded by reallocating gondola-end space. Germany's discounters have gone further, building own-label baked ranges priced within 8% of branded fried equivalents, which grows the category while compressing brand margin [14].

Asia-Pacific

Country Metric Key Driver
China 33.1% of regional revenue Premium imported and domestic hybrid brands
India 9.4% CAGR (2026–2035) Quick-commerce and modern trade rollout
Japan USD 0.07 Billion (2025) Calbee-led product innovation cadence
South Korea 8.9% of regional revenue Convenience-store exclusive launches
ASEAN 14.6% of regional revenue Convenience outlet density growth
Rest of Asia-Pacific 7.2% of regional revenue Urban middle-class formation


India is the single largest incremental contributor to the Baked Chips Market this decade. FSSAI's proposed front-of-pack star rating, in consultation since 2022, would formalise the health claim that brands currently make informally [4]. Quick-commerce platforms have compressed the impulse-purchase window to minutes, and baked SKUs index high in those baskets because shoppers self-select toward better-for-you options when browsing digitally rather than at a checkout rack [13].

South America

Country Metric Key Driver
Brazil 58.7% of regional revenue ANVISA labelling rules effective October 2022
Argentina USD 0.03 Billion (2025) Ley 27.642 warning octagons
Rest of South America 17.4% of regional revenue Andean market reformulation


Brazil's ANVISA magnifying-glass labelling, enforced from October 2022 with a 2025 compliance deadline for all pack formats, triggered the region's broadest reformulation cycle [4]. PepsiCo and local player Elma Chips rebuilt seasoning systems to clear sodium thresholds. Argentina's parallel regime, paired with severe currency volatility, has pushed brands toward smaller pack sizes rather than price increases.

Middle East & Africa

Country Metric Key Driver
Saudi Arabia 27.8% of regional revenue SFDA salt and fat reduction strategy
UAE 21.4% of regional revenue Premium expatriate retail demand
South Africa 8.4% CAGR (2026–2035) Formal grocery penetration
Egypt 13.6% of regional revenue Local manufacturing and import substitution
Rest of MEA 20.9% of regional revenue Urbanisation across West Africa


Saudi Arabia's SFDA has run mandatory salt-reduction targets for snack categories since 2019 and tightened trans-fat limits to 2% of total fat in 2020 [7]. Compliance costs favoured larger manufacturers, accelerating consolidation. South Africa's formal grocery share now exceeds 65% of national food retail, giving branded baked products a shelf presence unavailable in most of Sub-Saharan Africa [6].


Baked Chips Market By Region, 2025-2035

Competitive Benchmarking

Concentration in the Baked Chips Market is low by packaged-food standards. Estimated HHI sits near 720, with the top five players holding roughly 41% of global revenue — a structure that leaves genuine room for regional specialists and challenger brands. Private label complicates the picture further, accounting for an estimated 13–16% of European category volume. Competitive advantage clusters around oven capacity ownership, potato and grain procurement scale, and retailer relationships rather than around formulation IP.

Company Est. Revenue Share Range Key Offerings for Baked Chips Market Strategic Positioning
PepsiCo (Frito-Lay) ~14–18% Baked Lay's, Baked Ruffles, Baked Tostitos Scale leader; QSR co-branding and club distribution
Kellanova ~8–11% Pringles baked variants, multigrain crisps Global brand equity; canister format ownership
Campbell Soup Company ~6–9% Kettle Brand baked, Snyder's-Lance ranges Premium and better-for-you portfolio anchor
Calbee Inc. ~4–6% Baked potato and vegetable snacks Asia-Pacific innovation cadence leader
Intersnack Group GmbH ~3–5% funny-frisch, POM-BÄR baked lines European private-label and branded dual play
General Mills ~3–5% Food Should Taste Good, baked grain snacks Natural-channel and clean-label positioning
Utz Brands ~2–4% Baked pretzel and chip formats North American regional distribution depth
The Hain Celestial Group ~2–3% Terra, Garden of Eatin' baked ranges Organic and specialty-diet niche
Mondelez International ~2–3% Wheat Thins, baked cracker-chip hybrids Cross-category convergence play
Old Dutch Foods ~1–2% Baked ripple and multigrain chips Midwest US and Canadian stronghold
Real Foods Pty Ltd ~1–2% Corn Thins, Rice Thins Allergen-free and export-led specialist


Recent News & Developments

  • Frito-Lay / Subway (March 2023): Launched a co-branded 12-inch crisp for National Potato Chip Day, validating foodservice partnerships as a trial-generation channel for baked formats [11]
  • ANVISA, Brazil (October 2023): Completed the first enforcement wave of front-of-pack magnifying-glass labelling, forcing reformulation across the region's largest snack market [4]
  • Calbee Inc. (February 2024): Commissioned an expanded baked-snack line in Japan targeting reduced-oil vegetable formats for domestic and ASEAN export [17]
  • Kellanova (July 2024): Completed separation from WK Kellogg Co and restated Pringles as a core global growth platform, with reformulation capex prioritised [18]
  • US FDA (December 2024): Finalised the updated "healthy" nutrient content claim, establishing saturated fat and sodium limits that favour baked formulations [5]
  • Intersnack Group (March 2025): Acquired additional Central European production capacity to serve discounter private-label demand for baked ranges [19]
  • Campbell Soup Company (June 2025): Expanded Kettle Brand baked distribution into club channels following a snacks-division portfolio review [20]
  • Health Canada (September 2025): Confirmed no extension to the January 2026 front-of-pack symbol deadline, closing the reformulation window for importers [4]


Baked Chips Market Report Scope

Parameter Detail
Market Scope Global manufacture and sale of oven-baked, non-fried salty snack chips across retail and foodservice
Study Period 2021–2035 (Historical 2021–2024; Base Year 2025; Forecast 2026–2035)
CAGR 5.92% (2026–2035)
Market Size Checkpoints USD 1.79 Billion (2025); USD 1.90 Billion (2026); USD 3.18 Billion (2035)
Fastest Growing Segments Fruits (by Source); Barbecue (by Flavor); Online Stores (by Distribution Channel)
Companies Profiled 11 global and regional players across the Baked Chips Market
Valuation Currency USD Billion, at manufacturer selling price

FAQs

How should a private-label buyer qualify a co-manufacturer for the Baked Chips Market?
Audit oven throughput at target moisture spec, not nameplate capacity. Verify documented acrylamide mitigation under EU 2017/2158 and request 12 months of batch variance data before committing volume. [Ref 8]
Do baked chips have shorter shelf life than fried equivalents?
Typically no — lower residual oil reduces rancidity risk, often extending shelf life by four to eight weeks. Moisture pickup becomes the limiting factor instead, so barrier film specification matters more than antioxidant systems. [Ref 9]
Which certifications unlock export volume in the Baked Chips Market?
BRCGS or FSSC 22000 is table stakes for European and Gulf retail. Halal certification is mandatory across most Middle East and Southeast Asian accounts, and non-GMO Project verification meaningfully lifts US natural-channel placement. [Ref 22]
What does acrylamide mitigation actually cost per plant?
Asparaginase enzyme dosing, raw-material sugar specification and cold-chain discipline run roughly USD 0.9–1.6 million annually for a mid-sized facility. Most of that is recurring ingredient cost rather than capital expenditure. [Ref 8]
What is the most capital-efficient entry route into the Baked Chips Market?
Contract manufacturing beats owning a line below roughly 4,000 tonnes annual volume. Retrofit economics only work once you can fill 60% of a dedicated oven's available hours. [Ref 12]
Can existing extrusion pellet lines be converted to baked output?
Yes, and this is the cheapest conversion available. Pellet pre-gelatinisation followed by hot-air expansion produces better texture consistency than slice-and-bake, at retrofit costs near 40% of a full oven line. [Ref 9]
How does promotional depth affect category profitability?
Depth beyond 30% off list erodes reference price and rarely produces durable trial. UK HFSS promotion restrictions demonstrated that compliant products grew volume without multibuy support, arguing for everyday-value pricing instead. [Ref 7]      
Author
Author
Author Profile
Sakshi Gupta LinkedIn
Team Lead - Research
Currently a Team Lead in consumer goods, FMCG, and F&B, she translates rigorous research into decisive strategy. She develops GTM roadmaps, pricing architectures, and competitive benchmarks for companies across Europe, the US, and APAC. She synthesize insights, align cross-functional teams, and drive execution from brief to measurable outcomes. She leads end-to-end engagements with crisp analysis, compelling storytelling, and a strong command of Power BI, Tableau, SQL, and advanced research platforms.
Share::
Request Free Sample

Research Approach


Secondary Research

The secondary research process involved comprehensive analysis of regulatory databases, industry trade publications, agricultural commodity reports, and authoritative food industry organizations. Key sources included the US Food & Drug Administration (FDA) for nutrition labeling standards and ingredient safety protocols, the US Department of Agriculture (USDA) Economic Research Service for potato and vegetable commodity production data, and the Bureau of Labor Statistics (BLS) for food manufacturing employment and productivity metrics (NAICS 3118 & 3119). International regulatory sources encompassed the European Food Safety Authority (EFSA) for EU snack food regulations and the European Snacks Association (ESA) for European savoury snack consumption patterns. Agricultural data was sourced from the Food and Agriculture Organization (FAO) FAOSTAT database for global potato and vegetable production volumes, the National Potato Council (NPC) for U.S. potato processing industry economic impact data, and PotatoUSA for domestic consumption trends. Trade statistics were extracted from the International Trade Centre (ITC) Harmonized System (HS) codes 1905.90 for baked savory snack foods and the UN Comtrade database for cross-border potato chip trade flows. Industry associations including SNAC International (representing 400+ member companies across 55 countries), the China Food Industry Association Potato Food Professional Committee, and Food & Drink Europe provided market intelligence on formulation trends, processing innovations, and retail distribution strategies. Additional sources included proprietary retail audit data from NielsenIQ and IRI for point-of-sale tracking across supermarkets, convenience stores, and e-commerce channels, as well as patent databases for baking technology innovations and clean-label formulation advancements.


Primary Research

To gather both qualitative and quantitative information, the primary research process involved interviewing players from both the supply and demand sides. CEOs, VPs, chiefs of product development, and directors of procurement from baked chip companies, contract baking operators, and private label suppliers were among the supply-side sources. Sustainable packaging vendors, makers of baking equipment (continuous oven systems, air impingement technology providers), and providers of ingredient technology (specialty oils, natural flavor systems, clean-label preservatives) were also consulted. The demand-side sources included buyers and category managers from large grocery stores, convenience stores, and hypermarkets; procurement directors from foodservice distributors; and chefs and trend-spotters from fast food and restaurant chains. We confirmed the timelines for the clean-label and gluten-free product pipelines, gathered insights on regional flavor preferences, price elasticity across retail tiers, and slotting fee dynamics in modern trade channels. Primary research validated market segmentation across potato-based, vegetable-based, multigrain, and tortilla/corn baked chip categories.

Primary Respondent Breakdown:

By Designation: C-level Primaries (28%), Director Level (32%), Others (40%)

By Region: North America (32%), Europe (30%), Asia-Pacific (28%), Rest of World (10%)


Market Size Estimation

Global market valuation was derived through revenue mapping, production volume analysis, and trade flow reconciliation. The methodology included:

Identification of 50+ key manufacturers and contract baking operations across North America, Europe, Asia-Pacific, Latin America, and the Middle East & Africa

Product mapping across potato-based baked chips (kettle-cooked, ripple, thin-cut variants), vegetable-based chips (sweet potato, beet, kale, carrot), multigrain formulations (quinoa, brown rice, ancient grains), and tortilla/corn segments

Analysis of reported and modeled annual revenues specific to baked chip portfolios, excluding fried/extruded snack divisions where possible

Coverage of manufacturers representing 75-80% of global market share in 2024, including PepsiCo (Frito-Lay), Kellogg Company (Pringles), Calbee, Utz Brands, General Mills, Campbell Snacks, Kettle Foods, Popchips, and regional players like TagZ Foods and Greendot Health Foods

Extrapolation using bottom-up (production volume × average selling price by country/region, factoring in retail markup, distributor margins, and value-added tax variations) and top-down (manufacturer revenue validation against retail scan data) approaches to derive segment-specific valuations for standard versus premium/functional positioning categories

Calibration against export/import data from national customs databases to account for cross-border trade in baked snack commodities under HS codes 1905.90.90 and related classifications

Share::
Request Free Sample
Download Free Sample

Kindly complete the form below to receive a free sample of this Report

* Please use a valid business email

Share::
Request Free Sample
Download PDF ×

We do not share your information with anyone. However, we may send you emails based on your report interest from time to time. You may contact us at any time to opt-out.
















