Request Free Sample ×

Kindly complete the form below to receive a free sample of this Report

* Please use a valid business email

Leading companies partner with us for data-driven Insights

clients tt-cursor
Hero Background

Citric Acid Market

ID: MRFR/FnB/1211-CR
132 Pages
Snehal Singh
Last Updated: May 28, 2026
Citric Acid Market Size, Share, Industry Trend & Analysis Research Report Information By Form (Anhydrous, Liquid), By Application (Food & Beverages, Pharmaceuticals, Personal Care & Cosmetics, Detergents & Household Cleaners, Others), By Sub-Application (F&B) (Bakery, Confectionery, Dairy, Beverages, Savory & Snacks, Others), By Geography (North America, Europe, Asia-Pacific, South America, Middle East & Africa) - Forecast Till 2035
Download PDF ×

We do not share your information with anyone. However, we may send you emails based on your report interest from time to time. You may contact us at any time to opt-out.


Citric Acid Market Summary

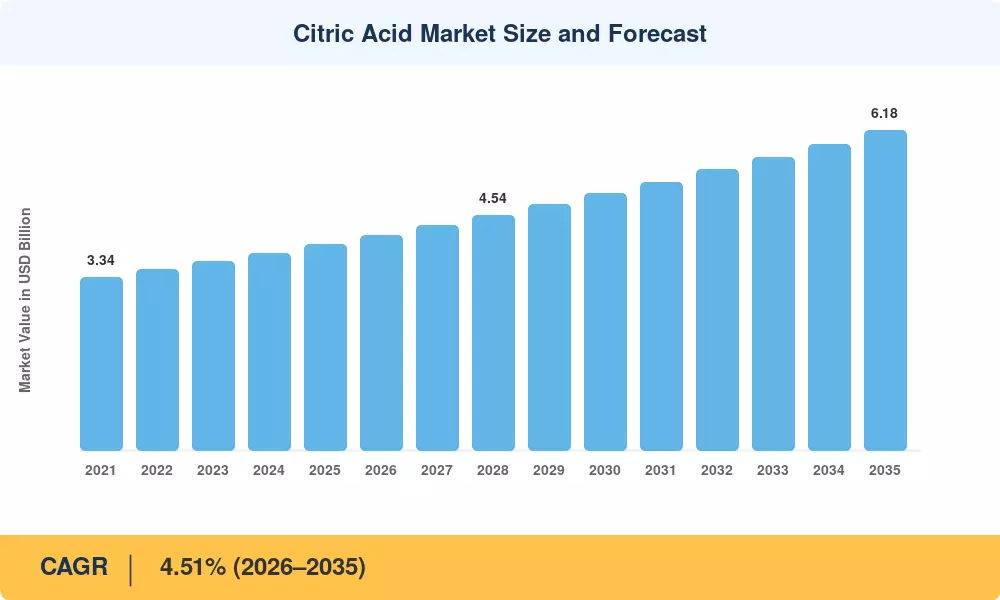
The global Citric Acid Market reached an estimated USD 3.98 billion in 2025, with the forecast period beginning at USD 4.16 billion in 2026 and climbing to USD 6.18 billion by 2035 at a CAGR of 4.51%. Two structural catalysts anchor this trajectory: the accelerating global pivot toward clean-label food formulations — driven by consumer demand for ingredient transparency — and tightening phosphate restrictions in household detergent chemistry across the EU and North America [2]. These policy and preference shifts have positioned citric acid as the go-to acidulant, preservative, and chelating agent across multiple end-use sectors.

The Citric Acid Market is experiencing a generational shift on the production side, from chemical synthesis approaches to fermentation-derived citric acid produced by Aspergillus niger strains on low-cost substrates. By 2024, China alone was exporting over 1.1 million metric tons annually, and new fermentation factories in India using molasses as a feedstock are adding varied capacity [3]. Between 2022 and 2024, capital expenditures for Asian fermentation infrastructure exceeded USD 620 million, lowering global production costs and broadening the range of applications in medicinal citric acid use and industrial cleaning [4].

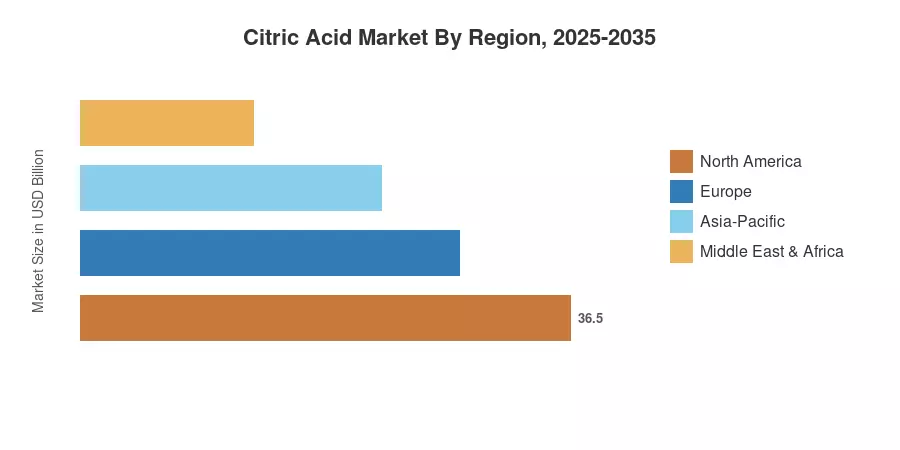
Asia-Pacific contributed to over 37.8% of the Citric Acid Market revenue in 2025, owing to China’s top exporting position and India’s increasing domestic demand. The Middle East & Africa are expected to have the greatest CAGR of ~7.12% by 2035, due to beverage and confectionery investment pipelines in Saudi Arabia and the UAE Europe was the second largest market, accounting for roughly 26.3%, where the limitations on phosphates under the EU Regulation 648/2004 continue to drive detergent formulators to biodegradable citrate builders [5]. Producers able to grow food-grade citric acid capacity while keeping pace with changing environmental requirements will be rewarded in the coming decade.


Key Report Takeaways

• By Form

  • Anhydrous-grade citric acid captured 58.9% of global volume in 2025, serving as the primary form for bakery, confectionery, and pharmaceutical citric acid use applications
  • Liquid citric acid is forecast to expand at a 6.28% CAGR through 2035, driven by ready-to-use formulations in household cleaners and personal care

• By Application

  • Food and beverages led the Citric Acid Market with USD 1.97 billion in 2025 revenue, as brands replaced synthetic preservatives with food-grade citric acid carrying FDA 21 CFR 184.1033 and EFSA E330 approvals
  • Detergents and household cleaners are advancing at a 6.52% CAGR through 2035, the fastest application segment, as citric acid cleaning agent formulations displace phosphate-based builders

• By Region

  • Asia-Pacific held the largest share of the Citric Acid Market in 2025, anchored by China's fermentation-derived citric acid export infrastructure
  • The Middle East & Africa is poised to post a 7.12% CAGR over 2026–2035, the fastest regional growth rate


Citric Acid Market Size and Forecast (2021–2035)

MARKET RESEARCH FUTURE’s market sizing is done by triangulating supply side data that includes production data of fermentation, trade flow databases and demand side data that includes consumption data of food-grade, pharmaceutical-grade and industrial-grade citric acid. Customs trade databases and producer disclosures provide historical values (2021-2024). Primary interviews validate the base-year 2025 estimate. The prediction (2026-2035) is provided using a calibrated CAGR of 4.51%.


Citric Acid Market Size and Forecast
Our Impact
Enabled $4.3B Revenue Impact for Fortune 500 and Leading Multinationals
Partnering with 2000+ Global Organizations Each Year
30K+ Citations by Top-Tier Firms in the Industry
 

Driver Impact Analysis

Driver ~% Impact on CAGR Geographic Relevance Impact Timeline
Clean-label food reformulation mandates ~22% Global Short-term (≤2 yr)
Phosphate restrictions in detergent chemistry ~18% Europe, North America Medium-term (2–4 yr)
Asian fermentation capacity scale-up ~16% Asia-Pacific Short-term (≤2 yr)
Pharmaceutical excipient demand growth ~12% North America, Europe Medium-term (2–4 yr)
Beverage sector expansion in MEA ~11% Middle East & Africa Long-term (≥4 yr)
Biodegradable chelant adoption in water treatment ~10% Global Long-term (≥4 yr)
Personal-care formulation premiumization ~8% Asia-Pacific, Europe Medium-term (2–4 yr)


Clean-Label Food Reformulation

The global clean-label ingredients sector surpassed USD 48 billion in 2024, and food-grade citric acid sits at the center of this movement [2]. Brands across bakery, dairy, and beverage categories are eliminating synthetic preservatives in favor of citric acid, which holds explicit GRAS status under FDA 21 CFR 184.1033 and EFSA authorization as E330. Retailers in North America and Europe now impose clean-label scorecards on suppliers, creating pull-through demand that directly lifts the Citric Acid Market.

Phosphate Restrictions in Detergent Chemistry

EU Regulation 648/2004, supplemented by the 2012 phosphate-limitation amendment, caps phosphorus content in consumer laundry detergents at 0.3 grams per standard dose [5]. This regulatory ceiling forced household-cleaner manufacturers to adopt citric acid cleaning agent formulations as biodegradable chelating alternatives. Several U.S. states, including Washington and New York, introduced parallel restrictions between 2022 and 2024, extending the addressable market for citrate-based builders in North America.

Asian Fermentation Capacity Expansion

China’s annual fermentation-derived citric acid output surpassed 2.5 million metric tons in 2024, solidifying its position as the global market leader with nearly 70% of total world production. This massive scale allows Chinese producers to dictate global pricing through high-capacity utilization. Recognizing this dependency, the Indian government and chemical manufacturers are actively exploring the expansion of domestic fermentation capabilities in the sugar-rich corridors of Maharashtra and Uttar Pradesh.

By attempting to leverage localized sugarcane molasses and corn starch feedstocks, India is targeting long-term import substitution to reduce its heavy reliance on Chinese supply, while eyeing future export pipelines to Middle Eastern and Southeast Asian markets. This regional scale-up remains critical to reducing unit costs and protecting the supply chain for price-sensitive domestic food and industrial sectors.


Pharmaceutical Excipient Demand

Citric acid functions as a buffering agent, effervescent co-reactant, and citric acid pH regulation excipient in oral dosage forms, parenteral solutions, and topical preparations [7]. The global pharmaceutical excipients sector grew at approximately 6.3% annually between 2021 and 2024, with pharmaceutical citric acid use benefiting from the expanding biologics pipeline that demands precise pH-controlled formulation environments.


Restraints Impact Analysis

The restraint impact percentages are directional estimates of each factor's drag on the Citric Acid Market growth rate. They do not sum algebraically to offset the CAGR.

Restraint ~% Negative Impact on CAGR Geographic Relevance Impact Timeline
Substrate price volatility (corn, molasses) ~–20% Global Short-term (≤2 yr)
Trade tariffs on Chinese citric acid exports ~–15% North America, Europe Medium-term (2–4 yr)
Environmental discharge regulations on fermentation effluent ~–12% China, India Long-term (≥4 yr)
Competition from alternative acidulants (malic, lactic acid) ~–10% Europe, North America Medium-term (2–4 yr)
Currency fluctuation in export-dependent markets ~–8% Asia-Pacific, South America Short-term (≤2 yr)


Substrate Price Volatility

Corn starch and cane molasses constitute 35–45% of total production costs for fermentation-derived citric acid [13]. While global corn commodity values trended downward through early 2024 following record South American harvests, localized shifts in supply-chain pricing and high inputs for premium wet-milled starch processors squeezed margins for unhedged, mid-tier producers. This volatile cost baseline limits the ability of smaller Citric Acid Market participants to maintain competitive long-term fixed spot-pricing


Anti-Dumping Tariffs on Chinese Exports

The European Commission's anti-dumping duties on Chinese citric acid — originally imposed in 2008 and extended multiple times — levy penalties between 15.3% and 42.7% ad-valorem depending on the specific manufacturing exporter [14]. The U.S. International Trade Commission has maintained parallel anti-dumping and countervailing duty orders. These trade barriers sharply inflate landed costs for downstream buyers in Western markets, encouraging regional supply-chain diversification.


Alternative Acidulant Competition

Malic acid, lactic acid, and glucono-delta-lactone compete with food-grade citric acid in beverage, confectionery, and dairy applications [16]. Lactic acid in particular benefits from its association with fermented-food trends and probiotic positioning, drawing some reformulation budgets away from citric acid in premium product segments.


Citric Acid Market Opportunities

Water Treatment and Industrial Descaling

Municipal and industrial water-treatment facilities are increasingly deploying citric acid pH regulation solutions for membrane cleaning, boiler descaling, and heavy-metal chelation [12]. The global water-treatment chemicals sector exceeded USD 38 billion in 2024, and citric acid's biodegradability gives it a regulatory advantage over EDTA and phosphonate-based alternatives

Pharmaceutical and Nutraceutical Effervescent Formats

Consumer preference for effervescent vitamin and mineral supplements is rising at roughly 7% annually in developed markets [7]. Citric acid paired with sodium bicarbonate forms the core effervescent couple, creating sustained demand growth for pharmaceutical citric acid use in OTC health products

Green Cleaning and Household Products in Emerging Markets

Urbanization across Southeast Asia, sub-Saharan Africa, and Latin America is expanding the addressable market for branded household cleaners. As these regions adopt phosphate restrictions modeled on European precedent, citric acid cleaning agent formulations offer manufacturers a compliance-ready ingredient at scale

Bio-Based and Circular-Economy Fermentation Platforms

Next-generation fermentation platforms using agricultural waste streams — rice husks, fruit pomace, and sugarcane bagasse — can lower feedstock costs by 20–30% compared with refined corn starch routes [10]. This positions fermentation-derived citric acid producers to capture sustainability premiums demanded by ESG-conscious CPG brands.


Citric Acid Market Future Outlook


Sustainability Reporting and ESG-Driven Procurement

Corporate ESG disclosure mandates — including the EU's Corporate Sustainability Reporting Directive (CSRD), effective from 2024 — are pushing CPG brands to audit ingredient supply chains end-to-end [19]. Citric acid producers that can document carbon footprints, water usage, and waste-stream metrics per batch will secure preferential supplier status, particularly for food-grade citric acid destined for European retail shelves.

Regulatory Harmonization Across Emerging Markets

CODEX Alimentarius and regional bodies such as the Gulf Cooperation Council Standardization Organization (GSO) are aligning food-additive regulations with FDA and EFSA standards [20]. This harmonization simplifies cross-border trade for citric acid, reduces duplicative testing costs, and expands the addressable Citric Acid Market in Africa, Southeast Asia, and Latin America.

Circular-Economy Integration and Waste Valorization

The shift toward circular-economy models will accelerate the adoption of agricultural waste streams as citric acid fermentation substrates [10]. Facilities co-located with sugar mills, fruit-juice processors, and rice-milling operations can access near-zero-cost feedstocks, simultaneously addressing environmental discharge challenges and strengthening margins for citric acid cleaning agent and industrial-grade product lines.


Citric Acid Market Segmentation

By Form

Segment Key Metric Primary Demand Driver
Anhydrous 58.9% share (2025) Bakery, confectionery, pharmaceutical and citric acid use
Liquid 6.28% CAGR (2026–2035) Ready-to-use cleaning and personal-care formulations


Anhydrous citric acid dominates the Citric Acid Market by volume because of its superior shelf stability, ease of transport, and compatibility with dry-mix food-grade citric acid applications. Bakery leavening systems, powdered beverages, and effervescent pharmaceutical tablets all specify anhydrous grade. Liquid citric acid, while a smaller base, is gaining traction in pre-diluted citric acid cleaning agent products and cosmetic serums where dissolution convenience justifies a price premium.

By Application

Segment Key Metric Primary Demand Driver
Food & Beverages USD 1.97 Billion (2025) Clean-label reformulation and acidulation
Pharmaceuticals 5.18% CAGR (2026–2035) Excipient and citric acid pH regulation demand
Personal Care & Cosmetics USD 0.31 Billion (2025) AHA skincare and hair-care formulations
Detergents & Household Cleaners 6.52% CAGR (2026–2035) Phosphate replacement with citric acid cleaning agent
Others 7.6% share (2025) Water treatment, construction, animal feed


Food and beverages account for the largest revenue share of the Citric Acid Market, spanning bakery, confectionery, dairy, beverages, and savory snack sub-segments. Beverage producers alone consumed an estimated 38% of food-grade citric acid output in 2025, using it as a flavor enhancer, preservative, and citric acid pH regulation agent in carbonated drinks, juices, and sports beverages [2]. Detergents and household cleaners represent the fastest-growing application pool, as phosphate bans channel formulators toward biodegradable citrate builders. The citric acid cleaning agent segment is particularly strong in Western Europe, where regulatory compliance timelines leave manufacturers little room to delay reformulation.

By Sub-Application (Food & Beverages)

Sub-Segment Key Metric Primary Demand Driver
Bakery 14.3% of the F&B segment Leavening and shelf-life extension
Confectionery 5.74% CAGR (2026–2035) Sour-flavor profiling and coating
Dairy USD 0.24 Billion (2025) Citric acid pH regulation in cheese and yogurt
Beverages 38.2% of the F&B segment Acidulation in carbonated and non-carbonated drinks
Savory & Snacks 4.86% CAGR (2026–2035) Flavor enhancement and preservation
Others 6.1% of the F&B segment Sauces, dressings, and processed foods


Regional Market Share Analysis

Region Key Metric Primary Investment Themes
Asia-Pacific 37.8% share (2025) Fermentation-derived citric acid scale-up; export logistics
Europe 26.3% share (2025) Phosphate replacement; clean-label compliance
North America USD 0.83 Billion (2025) Food-grade citric acid reformulation; pharma excipients
South America 4.38% CAGR (2026–2035) Beverage sector growth; confectionery investment
Middle East & Africa 7.12% CAGR (2026–2035) Beverage and confectionery pipelines; import substitution

The Citric Acid Market displays a clear geographic hierarchy shaped by production capacity, regulatory regimes, and end-use demand intensity. Asia-Pacific dominates in volume, Europe leads in regulatory-driven application innovation, and the Middle East & Africa represents the highest-growth frontier.


North America

Country Key Metric Key Driver
US 68.4% of regional share Clean-label beverage reformulation
Canada 4.73% CAGR (2026–2035) Pharmaceutical citric acid use growth
Mexico USD 0.06 Billion (2025) Confectionery and snack-food expansion


The U.S. Citric Acid Market is shaped by FDA clean-label guidance and large-scale food-grade citric acid procurement by national beverage brands. Canada's pharmaceutical sector, valued at over CAD 30 billion in 2024, drives steady excipient demand, while Mexico's confectionery industry benefits from proximity to U.S. distribution networks [6].

Europe

Country Key Metric Key Driver
Germany 22.1% of regional share Industrial cleaning; automotive descaling
UK 4.62% CAGR (2026–2035) Household citric acid cleaning agent products
France USD 0.12 Billion (2025) Dairy and bakery food-grade citric acid
Italy 10.8% of regional share Beverage acidulation
Spain 4.48% CAGR (2026–2035) Personal-care formulations
Nordic Countries USD 0.07 Billion (2025) Sustainability-driven cleaning products
Russia 3.91% CAGR (2026–2035) Confectionery and beverage sectors
Rest of Europe 14.6% of regional share Diverse industrial applications


Europe's Citric Acid Market growth is anchored in the EU's phosphate-limitation framework, which has made citric acid cleaning agent solutions the default chelant in laundry and dishwasher detergents. Germany's industrial sector also drives demand for fermentation-derived citric acid in CIP (clean-in-place) protocols for food-processing equipment [5].

Asia-Pacific

Country Key Metric Key Driver
China 52.3% of regional share Fermentation-derived citric acid exports
India 6.84% CAGR (2026–2035) Molasses-based production expansion
Japan USD 0.11 Billion (2025) Pharmaceutical citric acid use
South Korea 4.96% CAGR (2026–2035) Cosmetics and personal-care demand
ASEAN 5.43% CAGR (2026–2035) Beverage and snack-food growth
Rest of Asia-Pacific 8.2% of regional share Emerging food-processing sectors


China's fermentation infrastructure — concentrated in Shandong and Anhui provinces — exported over 1.1 million metric tons of citric acid in 2024 [3]. India's Citric Acid Market is expanding rapidly as domestic producers in Maharashtra commission new molasses-sourced plants to serve both local food-grade citric acid demand and Gulf-state export channels.

South America

Country Key Metric Key Driver
Brazil 61.7% of regional share Beverage and confectionery acidulation
Argentina 4.15% CAGR (2026–2035) Citric acid pH regulation in dairy processing
Rest of South America USD 0.03 Billion (2025) General food-processing demand


Brazil's Citric Acid Market benefits from one of the world's largest soft-drink and juice-processing industries, where food-grade citric acid serves as the primary acidulant and flavor enhancer [11]. Argentina's dairy sector relies on citric acid pH regulation for cheese and yogurt production.

Middle East & Africa

Country Key Metric Key Driver
Saudi Arabia 28.4% of regional share Vision 2030 food-manufacturing investment
UAE 7.58% CAGR (2026–2035) Premium beverage and hospitality demand
South Africa USD 0.04 Billion (2025) Household cleaning and personal care
Egypt 6.89% CAGR (2026–2035) Confectionery production growth
Rest of MEA 22.1% of regional share Diversified demand across food and industrial


The Middle East & Africa represent the fastest-growing territory in the Citric Acid Market, propelled by Saudi Arabia's Vision 2030 food-manufacturing localization agenda and the UAE's expanding hospitality and premium beverage channels [8]. Regional import dependence on Asian fermentation-derived citric acid creates opportunities for local production investment.


Citric Acid Market By Region, 2025-2035
Regional Market Share
 

Competitive Benchmarking

The Citric Acid Market exhibits medium concentration, with the top five producers controlling an estimated 48–55% of global revenue. China-based manufacturers dominate on volume, while European and American specialty-grade producers compete on purity, traceability, and regulatory certification. The Herfindahl-Hirschman Index (HHI) for this market is estimated between 800 and 1,100, indicating a moderately competitive structure without monopolistic dynamics.

Company Est. Revenue Share Range Key Offerings Strategic Positioning
Weifang Ensign Industry Co., Ltd. ~10–14% Anhydrous and monohydrate food-grade citric acid China's largest single-site producer; cost leadership
Archer Daniels Midland (ADM) ~8–11% Food-grade and pharmaceutical citric acid Integrated corn-processing value chain; North American anchor
Cargill, Inc. ~7–10% Fermentation-derived citric acid; acidulant blends Global distribution; clean-label positioning
Tate & Lyle PLC ~5–8% Specialty food-grade citric acid solutions UK-based; ingredient-solutions strategy
Jungbunzlauer Suisse AG ~5–8% Citric acid, citrates, gluconates Swiss quality positioning; EU regulatory compliance
COFCO Biochemical (Anhui) Co. ~4–7% Bulk anhydrous and liquid citric acid State-backed Chinese producer; export scale
Gadot Biochemical Industries Ltd. ~3–5% Citric acid and mineral citrates Israeli specialty producer; pharmaceutical citric acid use focus
Citrique Belge (Subsidiary of S.A. Citrique Belge) ~2–4% European-produced food-grade citric acid Belgian production; EU supply-chain proximity
RZBC Group Co. Ltd. ~3–5% Bulk fermentation-derived citric acid Shandong-based; export-oriented
Huangshi Xinghua Biochemical Co., Ltd. ~2–4% Industrial and food-grade citric acid Mid-tier Chinese producer; diversified portfolio


Recent News & Developments


  • COFCO Biochemical (March 2024): Received FSSC 22000 certification for its Anhui facility, enabling expanded exports of food-grade citric acid to EU and Japanese markets [23].


Citric Acid Market Report Scope

Parameter Detail
Market Scope Global Citric Acid Market by Form, Application, Sub-Application (F&B), and Geography
Study Period 2021–2035
CAGR Window 2026–2035 (4.51%)
Base Year 2025 (USD 3.98 Billion)
2026 Starting Value USD 4.16 Billion
2035 Endpoint USD 6.18 Billion
Fastest Growing Segment Detergents & Household Cleaners (by application); Middle East & Africa (by region)
Companies Profiled 10
Valuation Currency USD Billion


,


FAQs

How does citric acid compare with malic acid for beverage acidulation?

Citric acid delivers a sharper, brighter tartness that dissipates quickly, while malic acid provides a smoother, longer-lasting sourness. Most carbonated-beverage producers prefer citric acid for its cost efficiency and faster flavor release [16].

What purity grades should pharmaceutical buyers specify when sourcing citric acid?

Pharmaceutical buyers should specify USP/EP-grade citric acid with a minimum assay of 99.5% and endotoxin levels below 0.5 EU/mg. Certificates of analysis referencing Ph. Eur. 10.0 monograph compliance are standard for parenteral-grade material [7].


What shelf-life considerations apply to anhydrous versus liquid citric acid?

Anhydrous citric acid stored in sealed polyethylene-lined containers maintains stability for 36+ months at ambient conditions. Liquid grades require refrigeration and typically carry a 12–18 month shelf-life due to microbial risk [10].

Can citric acid replace EDTA in industrial cleaning and water-treatment applications?

Citric acid effectively replaces EDTA for light-to-moderate metal chelation and is fully biodegradable, but it offers lower stability constants for heavy metals like lead and cadmium. Blended citrate-gluconate systems close this performance gap [12].

What certifications should food-grade citric acid suppliers hold for export to GCC countries?

Exporters targeting GCC markets need GSO conformity marks, halal certification from an accredited body, and compliance with GSO 2500/2015 food-additive standards. FSSC 22000 certification accelerates customs clearance in Saudi Arabia and the UAE [8].


Author
Author
Author Profile
Snehal Singh LinkedIn
Manager - Research
High acumen in analyzing complex macro & micro markets with more than 6 years of work experience in the field of market research. By implementing her analytical skills in forecasting and estimation into market research reports, she has expertise in Packaging, Construction, and Equipment domains. She handles a team size of 20-25 resources and ensures smooth running of the projects, associated marketing activities, and client servicing.

Research Approach

Secondary Research

The secondary research process involved comprehensive analysis of regulatory databases, peer-reviewed journals, industry-specific publications, and authoritative organizations governing food additives, chemicals, and pharmaceutical excipients. Key sources included the US Food & Drug Administration (FDA), European Food Safety Authority (EFSA), US Pharmacopeia (USP), Food Chemicals Codex (FCC), Food and Agriculture Organization (FAO), Codex Alimentarius Commission, Environmental Protection Agency (EPA), European Chemicals Agency (ECHA), National Institute of Standards and Technology (NIST), International Food Additives Council (IFAC), Flavor and Extract Manufacturers Association (FEMA), European Federation of Chemical Engineering (EFCE), World Health Organization (WHO) Food Safety Standards, USDA National Agricultural Statistics Service, Eurostat Industrial Production Database, UN Comtrade Database, National Bureau of Statistics of China, India Department of Chemicals & Petrochemicals, and Ministry of Economy, Trade and Industry (METI) Japan.

These sources were used to gather information on production capacity, import-export figures, fermentation technology developments, regulatory approval statuses for the use of food additives (E330), pricing dynamics for both liquid and anhydrous forms, and consumption patterns specific to applications in the food and beverage, pharmaceutical and nutraceutical, personal care, and industrial cleaning sectors.


Primary Research

In order to gather qualitative and quantitative information on manufacturing capacity, procurement tactics, and formulation trends, supply-side and demand-side players were interviewed as part of the primary research process. CEOs, Heads of Fermentation Technology, VPs of Business Development, regulatory compliance officers, and plant managers from companies that produce citric acid, contract fermentation facilities, and suppliers of raw materials (corn, sucrose, and molasses) were examples of supply-side sources. Demand-side sources included sourcing managers from makers of industrial detergents and household cleaners, pharmaceutical formulation experts, chiefs of personal care product development, and procurement directors from global food and beverage companies. Segment splits between anhydrous and liquid forms were validated by primary research, which also confirmed functional applications (acidulant, antioxidant, preservative, and flavoring agent) and obtained information on regional supply-demand imbalances, contract pricing mechanisms, sustainability initiatives, and improvements in fermentation efficiency.

Primary Respondent Breakdown:

By Company Tier: Tier 1 (38%), Tier 2 (45%), Tier 3 (17%)

By Designation: C-level Primaries (22%), Director Level (35%), Others (43%)

By Region: North America (32%), Europe (26%), Asia-Pacific (28%), Rest of World (14%)

[Note: Tier 1 = >USD 5B revenue; Tier 2 = USD 500M-5B; Tier 3 = <USD 500M as of 2024]


Market Size Estimation

Production volume tracking and revenue reconciliation throughout the value chain were used to determine the global market valuation. The following were part of the methodology:

35+ important chemical processing and fermentation facilities in North America, Europe, Asia-Pacific (especially China and India), and Latin America have been identified.

Product mapping by function (acidulant, antioxidant, preservative, flavoring agent), application vertical (food & beverages, pharmaceuticals & nutraceuticals, personal care, industrial cleaners, others), and anhydrous citric acid (powder/crystal) and liquid citric acid solution concentrations (50%, 60%).

Examination of citric acid product lines' actual and estimated yearly revenues, taking into account captive consumption and merchant market sales

Coverage of producers who will account for 75–80% of the world's capacity for fermentation-based citric acid in 2024

Segment-specific valuations for each form and application category are obtained through extrapolation utilizing top-down (manufacturer revenue validation, trade flow analysis) and bottom-up (production volume × average selling price by area, adjusted for purity grades) methodologies.

Download Free Sample

Kindly complete the form below to receive a free sample of this Report