Dental Consumables Market (2026 - 2035)

Dental Consumables Market Research Report: Size, Share, Trend Analysis By Product Type (Dental Implants, Dental Crowns, Dental Bridges, Dental Instruments, Orthodontic Accessories), By End Users (Dental Clinics, Hospitals, Dental Laboratories), By Material Type (Ceramics, Metals, Polymers, Composites), By Procedure Type (Restorative Dentistry, Orthodontics, Periodontics, Endodontics) and By Regional (North America, Europe, South America, Asia Pacific, Middle East and Africa) - Growth Outlook & Industry Forecast 2025 To 2035

Forecast Period
2026-2035
CAGR
7.7%
2025 Market Size
USD 37.39 Billion
2035 Market Size
USD 78.86 Billion
Medical Device ● Updated August 24, 2026 Report ID: MRFR/MED/1274-CR | Pages: 107 | Author: Nidhi Mandole, Rahul Gotadki

Dental Consumables Market Summary

The Dental Consumables Market reached USD 37.39 billion in 2025 and opens the forecast window at USD 40.45 billion in 2026, climbing to USD 78.86 billion by 2035 at a 7.7% CAGR. Two catalysts anchor that trajectory. Regulation (EU) 2024/1849 ended general use of dental amalgam across the European Union on 1 January 2025, redirecting roughly 40 tonnes of annual mercury-based filling volume toward composites and glass-ionomer chemistries [3][4]. Meanwhile, the World Health Organization counts 3.5 billion people living with oral disease — a billion more cases than the next five non-communicable diseases combined [1].

Chairside workflows are displacing the send-out laboratory model that defined restorative dentistry for four decades. Intraoral scanning, milling, and printing now compress crown delivery from two visits to one, and each converted operatory pulls through a different consumables basket: milling blocks, printable resins, scan bodies, and bonding chemistries instead of alginate and gypsum. Straumann's 2025 accounts show how fast that shift monetises — CHF 2.6 billion in revenue on 8.9% organic growth, with digital solutions and the SIRIOS X3 scanner cited as principal contributors [5][23].

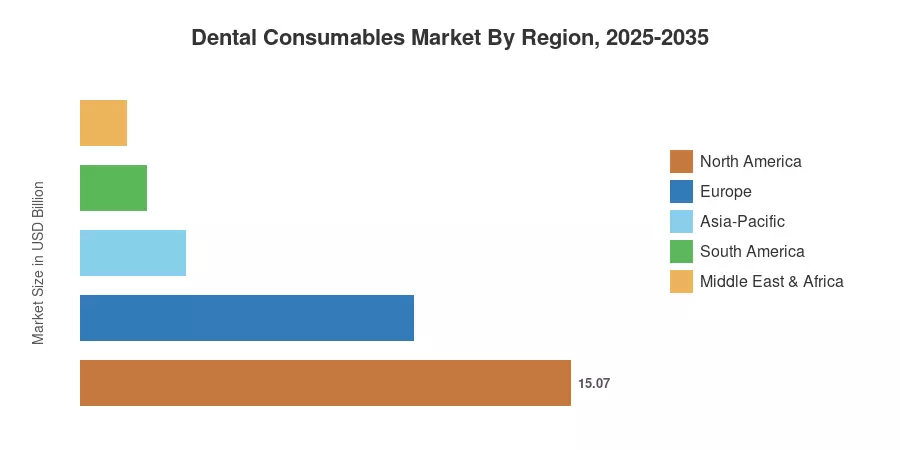
North America holds 40.3% of global revenue, supported by a dense dental service organisation footprint and the highest per-capita restorative spend worldwide. Asia-Pacific advances fastest at an 8.66% CAGR through 2035, while Europe's USD 10.24 billion base in 2025 reflects both regulatory-driven material substitution and mature implant penetration. The decade ahead rewards suppliers who sell workflows, not catalogue items.


Key Report Takeaways

• By Product Type

  • Dental implants held a 17.0% share of the Dental Consumables Market in 2025, the largest single product line
  • Personal protective wear is forecast to expand at a 9.15% CAGR through 2035 as infection-control protocols stay permanent
  • Aligners and braces generated an estimated USD 4.94 billion in 2025

• By Treatment Modality

  • Prosthodontic procedures commanded 25.7% of the Dental Consumables Market in 2025
  • Orthodontics is projected to grow at an 8.85% CAGR to 2035, the fastest modality


• By Distribution Channel

  • Offline B2B transactions accounted for 81.6% of distribution value in 2025

• By Region

  • North America led with 40.3% revenue share in 2025
  • Asia-Pacific posts the fastest regional advance at an 8.66% CAGR through 2035
  • Europe contributed USD 10.24 billion in 2025, reshaped by the amalgam phase-out


Market Size and Forecast (2021–2035)

Figures below blend bottom-up procedure-volume modelling — chair counts, procedure mix, and per-procedure consumables intensity — with top-down triangulation against audited filings from Straumann, Dentsply Sirona, Envista, and Henry Schein [5][7][14]. Historical years are reconstructed from disclosed segment revenues and trade data; forecast years apply calibrated procedure growth and average-selling-price paths by region.
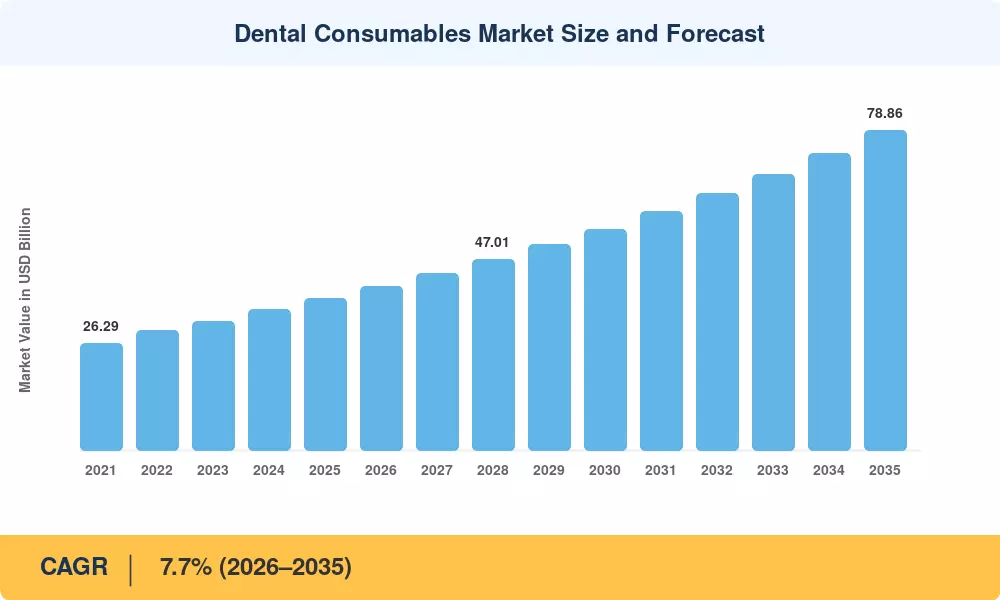
Dental Consumables Market Size and Forecast
Our Impact
Enabled $4.3B Revenue Impact for Fortune 500 and Leading Multinationals
Partnering with 2000+ Global Organizations Each Year
30K+ Citations by Top-Tier Firms in the Industry

Driver Impact Analysis

Driver ~% Impact on CAGR Geographic Relevance Impact Timeline
Ageing populations and rising edentulism +1.6 pp Global Long-term (≥4 yr)
Chairside digital workflows and same-day restoration +1.4 pp North America, Europe, APAC Medium-term (2–4 yr)
DSO consolidation and standardised procurement +1.3 pp North America, Europe Medium-term (2–4 yr)
Clear aligner adoption by general practitioners +1.2 pp Global Medium-term (2–4 yr)
Emerging-market access expansion and dental tourism +1.1 pp APAC, MEA, South America Long-term (≥4 yr)
EU amalgam phase-out and material substitution +0.9 pp Europe Short-term (≤2 yr)
Permanence of enhanced infection-control protocols +0.6 pp Global Short-term (≤2 yr)


Demographic Load and Untreated Disease Burden

An estimated 2.5 billion people suffer from untreated caries in permanent teeth, and another billion have severe periodontal disease [1][2]. Treatment capacity has typically lagged in low- and middle-income nations, where three out of four affected individuals reside. Due to population growth and aging, the Global Load of Disease 2021 forecasts through 2035 indicate an increase in caries and periodontal load in absolute terms even in areas where age-standardized rates decline [13]. This translates into a structural need for the dental consumables market: regardless of technology generation, each treated case requires anesthetic, isolation product, restorative material, and finishing supply. In 2019, direct global spending on oral disease reached USD 387 billion across 194 countries, with an additional USD 323 billion in lost productivity. Health ministries are increasingly treating this gap as a finance issue rather than an inevitable expense [20].


Regulatory Substitution in European Restoratives

On May 30, 2024, Brussels finalized the amalgam phase-out, expanding the prohibition that already applied to children under 15 and pregnant or nursing women to the entire EU population starting on January 1, 2025 [4]. Amalgam exports stopped that same day, and imports and manufacturing within the Union ended on July 1, 2026 [4]. At around 40 tons per year, dental amalgam was the single largest purposeful mercury use in Europe [9]. Composite resins, glass hybrids, and high-viscosity glass-ionomer cements are preferred over amalgam because they are more valuable per placement and require adhesives, etchants, and curing consumables. The substitute increases value more quickly than volume since, as the British Dental Association cautioned, it increases chair time and costs for already overburdened offices [5-source note: Dental Tribune story, ref 17].


Dental Service Organisation Procurement Gravity

Group practices now negotiate as institutional buyers rather than individual clinicians. Straumann identified continued DSO momentum as a specific driver of its North American recovery in Q4 2025, where regional revenue reached CHF 170.3 million on 6.8% organic growth in an otherwise soft market [21]. Consolidated purchasing compresses supplier lists, rewards vendors with full-portfolio coverage and clinical education infrastructure, and accelerates adoption of premium lines once a formulary decision is made. Straumann delivered more than 10,700 education programmes to over 370,000 professionals in 2025 — an investment that reads as marketing but functions as procurement lock-in [21].

Chairside Digitisation

Dentsply Sirona launched Smart View-Detect in Q1 2026, describing it as the first FDA-cleared, CE-marked AI-enabled diagnostic in its imaging line, alongside CEREC installations under new distribution agreements with Benco Dental and Atlanta Dental Supply [7][44-source note: company releases, ref 7]. Each installed chairside unit reshapes the consumables mix beneath it. Milling blocks, printable biocompatible resins, and bonding systems replace impression trays and shipping logistics, and the recurring attach rate on a single CAD/CAM operatory typically exceeds the equipment margin within three years.


Restraints Impact Analysis

Restraint weightings follow the same directional convention as Section 4 — analyst-assigned drags on the growth rate, not additive subtractions from the CAGR. Several restraints are regionally concentrated and therefore dilute at the global level even where local impact is severe.

Restraint ~% Impact on CAGR Geographic Relevance Impact Timeline
China VBP average-selling-price compression −1.1 pp Asia-Pacific Short-term (≤2 yr)
Out-of-pocket payment and thin dental insurance −0.9 pp Global Long-term (≥4 yr)
Clinician and hygienist workforce shortages −0.7 pp North America, Europe Medium-term (2–4 yr)
EU MDR recertification cost and portfolio pruning −0.5 pp Europe Medium-term (2–4 yr)
Tariff and input-cost volatility −0.4 pp Global Short-term (≤2 yr)


Volume-Based Procurement as a Structural Price Ceiling

In 2023, the National Healthcare Security Administration of China implemented centralized volume-based procurement for dental implants, resulting in an average price decrease of almost 55% across approximately 17,000 participating institutions [10]. After adoption, Straumann revealed that it made 40–45% less per implant sold in China; in just one quarter, VBP pricing accounted for over 80% of the country's implant market [29-source note: Dental Tribune, ref 17]. With the implementation framework scheduled for July 2026, a second round, VBP 2.0, was postponed until Q3 2026. This delay caused suppliers' income timing to fluctuate over the first half of 2026 [31-source note: trade reporting, ref 22]. The price reduction is somewhat compensated by volume increase, but the ceiling is now permanent and travels; other Asian payers keep a close eye on Beijing's tender results.


Payment Architecture

Most national universal health coverage benefit packages do not include prevention or treatment for oral disorders, and most low- and middle-income nations do not have enough resources to provide either [2]. Elective and restorative demand tracks household discretionary income rather than clinical need when care is paid for out of pocket. Lower-than-expected equipment, implant, and prosthetic volumes were highlighted in Dentsply Sirona's Q4 2025 impairment of USD 144 million against its orthodontic and implant sectors, with US weakness being singled out [8]. Aligners, whitening, and high-end prostheses are consumer-facing industries with the strongest cyclicality.


Supply Chain and Regulatory Cost Load

Straumann absorbed more than CHF 100 million in currency headwinds during 2025 plus tariff impacts, compressing reported growth to 4.1% in Swiss francs against 8.9% organic [19]. Titanium, zirconia, and specialty methacrylate inputs are priced in dollars, while a large share of manufacturing and revenue sits in Europe and Asia. Layer EU Medical Device Regulation recertification on top, and smaller specialty manufacturers face a fixed compliance cost per SKU that has already triggered quiet portfolio pruning across low-volume restorative and endodontic lines.


Dental Consumables Market Opportunities

Regenerative and Bioactive Biomaterials

Bone grafts, membranes, and bioactive cements convert procedures that were previously declined into billable treatment plans. Dentsply Sirona's earlier acquisition of Datum Dental brought specialised regenerative material capability precisely to serve the implant segment [9-source note: SEC filing, ref 9]. Suppliers who pair a regenerative portfolio with implant systems capture two revenue events per site instead of one, and the pull-through effect strengthens as the Dental Consumables Market shifts toward complex full-arch cases.

Emerging-Market Clinic Buildout

Three of every four people with oral disease live in low- and middle-income countries [42-source note: WHO, ref 1]. India, ASEAN, and Gulf markets are adding chairs faster than any mature economy, and the entry basket — anaesthetics, isolation, basic restoratives, infection control — is exactly where volume economics work. India alone should compound at 10.4% through 2035. Suppliers with value-tier brands under a premium umbrella, the model Straumann built with its challenger implant portfolio, are positioned to take that growth without cannibalising flagship pricing.

Workflow Data and Recurring-Revenue Models

Cloud platforms that sit between scanner, mill, and laboratory create a subscription layer alongside the consumable. Straumann's AXS platform and Dentsply Sirona's DS Core both function this way — connected workflows that generate usage data, drive automated reordering, and raise switching costs [5][7]. The monetisation logic mirrors industrial consumables: give away the analytics, own the reorder button.

Preventive Reimbursement Expansion

Payers are slowly recognising that sealants and fluoride varnish cost a fraction of the restorations they prevent. WHO's monitoring framework carries measurable oral health targets to 2030, and the agency is running a three-year amalgam phase-down project with UNEP piloted in Senegal, Thailand, and Uruguay [2][19]. Public procurement of preventive dental supplies at population scale is a different commercial motion from selling to clinics — lower margin, far higher volume — and the Dental Consumables Market has barely begun to price it in.

Aligners in General Practice

Orthodontic volume is migrating from specialist to generalist chairs. Straumann reported continued ClearCorrect traction with strong general-practitioner engagement across North America, supported by its Smartee technology transition [21]. Every GP converted adds a recurring case-start annuity to a practice that previously referred the patient away.


Dental Consumables Market Future Outlook

AI Diagnostics as a Demand Generator

Detection drives treatment, and treatment drives consumption. Dentsply Sirona's Smart View-Detect, cleared by the FDA and CE-marked during Q1 2026, sits in this category — AI reading radiographs surfaces caries and bone loss that human review misses [7]. Every incremental lesion identified becomes a restoration placed. Across a decade, diagnostic sensitivity improvements plausibly add more procedure volume to the Dental Consumables Market than any single material innovation.

Platform Economics and the Reorder Layer

Connected workflow platforms are converting episodic purchasing into managed replenishment. Straumann's AXS and comparable cloud environments capture case data at the point of design, which means the supplier knows what the practice will need before the practice does. Expect subscription and consumption-based contracting to reach a meaningful share of professional dental spend well before 2035.

Materials Convergence

Zirconia, lithium disilicate, and printable resin systems are converging on a common performance envelope while diverging sharply on cost. Chairside printing in particular changes inventory economics — a practice stocking three resin cartridges replaces a shelf of pre-formed components. Manufacturers will defend margin by moving value into the resin chemistry and the validated print profile rather than the finished part.

Prevention and Sustainability Reporting

Mercury elimination under the Minamata Convention gives dentistry an unusually concrete environmental mandate, and the EU has already legislated it [3][19]. Procurement teams at large group practices increasingly score suppliers on packaging waste, single-use plastic content, and sterilisation compatibility. Reusable and recyclable instrument lines will command specification advantages that pricing alone cannot overcome.


Dental Consumables Market Segmentation

Segmentation in the Dental Consumables Market follows procedure architecture rather than product catalogue, because the purchasing unit is the clinical protocol.

By Product Type

Segment Metric Primary Demand Driver
Dental Implants 17.0% share (2025) Edentulism in ageing cohorts; full-arch case growth
Crowns & Bridges USD 5.91 Billion (2025) Chairside CAD/CAM same-day delivery
Aligners & Braces 8.85% CAGR (2026–2035) General-practitioner case starts
Dental Biomaterials 11.4% share (2025) Regenerative grafting ahead of implant placement
Endodontic Supplies USD 3.59 Billion (2025) Rotary file and bioceramic sealer adoption
Anaesthetics 8.1% share (2025) Procedure volume baseline
Whitening Products 7.9% CAGR (2026–2035) Cosmetic and consumer-adjacent demand
Personal Protective Wear 9.15% CAGR (2026–2035) Permanent post-pandemic infection protocols
Others 8.2% share (2025) Impression, isolation, finishing supplies


Implants remain the value anchor despite sustained price pressure. Straumann attributes 64% of premium implant revenue to innovations launched within the past decade, which tells you the segment defends margin through surface technology and workflow integration rather than through unit pricing [22]. The iEXCEL global rollout during 2025 delivered documented share gains in premium implantology even in a soft North American market [21].

Protective wear behaves as a different business entirely. Volumes normalised after 2021 but never returned to pre-2020 baselines, and the category now grows faster than any restorative line because usage per procedure was permanently reset rather than temporarily elevated.

By Treatment Modality

Segment Metric Primary Demand Driver
Prosthodontic 25.7% share (2025) Crown, bridge, and denture volume in ageing populations
Restorative USD 9.09 Billion (2025) Amalgam substitution and caries burden
Orthodontic 8.85% CAGR (2026–2035) Aligner migration into general practice
Endodontic 12.1% share (2025) Tooth retention preference over extraction
Periodontic USD 4.04 Billion (2025) Severe gum disease affecting one billion people
Preventive & Other 9.5% share (2025) Sealant and varnish reimbursement expansion


Prosthodontics and restoratives together account for half of all consumables value, and the boundary between them is dissolving as chairside milling lets a single visit deliver what previously required both a temporary restoration and a laboratory-fabricated crown.

By Distribution Channel

Segment Metric Primary Demand Driver
Offline — B2B 81.6% share (2025) Distributor service contracts and clinical support
Offline — B2C USD 4.45 Billion (2025) Direct-to-practice specialty and consumer lines
Online 9.07% CAGR (2026–2035) Automated reordering and price transparency


Distribution relationships still decide who wins shelf space in the Dental Consumables Market. Dentsply Sirona expanded US coverage through Atlanta Dental Supply effective August 2026 and Canadian coverage through Medline Sinclair effective September 2026, both aimed at reaching independent practices that group purchasing does not touch [7]. Online is growing fastest from a small base, driven by commodity reordering rather than by clinical products that require training.

By End-User

Segment Metric Primary Demand Driver
Dental Clinics 49.4% share (2025) Largest installed chair base globally
DSO / Group Practices 8.94% CAGR (2026–2035) Consolidation and formulary standardisation
Dental Hospitals USD 5.83 Billion (2025) Complex surgical and multidisciplinary cases
Dental Laboratories 9.2% share (2025) Prosthetic fabrication, though shrinking to chairside
Others USD 1.68 Billion (2025) Academic institutions and public health programmes


Dental Clinics dominate the Dental Consumables Market, accounting for a 49.4% share in 2025, driven by their high volume of restorative, preventive, and routine dental procedures. DSO / Group Practices represent the fastest-growing segment, expanding at an 8.94% CAGR from 2026 to 2035, supported by centralized procurement, standardized treatment protocols, and increasing consolidation of dental practices. Dental Hospitals generated USD 5.83 billion in 2025, while Dental Laboratories and Others accounted for 9.2% and USD 1.68 billion, respectively, reflecting their continued role in specialized dental production and support services.


Regional Market Share Analysis

Region Metric (2025) Primary Investment Themes
North America 40.3% share DSO formularies, chairside CAD/CAM, full-arch implantology
Europe USD 10.24 Billion Amalgam substitution, MDR compliance, premium prosthetics
Asia-Pacific 8.66% CAGR (2026–2035) VBP volume economics, local manufacturing, clinic buildout
South America 5.4% share Dental tourism corridors, value-tier implants
Middle East & Africa USD 1.42 Billion Sovereign health investment, private clinic expansion
Total USD 37.39 Billion

Regional structure in the Dental Consumables Market reflects three separate forces: installed chair density, payer architecture, and procurement centralisation. Mature markets grow on mix; emerging markets grow on units.


North America

Country Metric Key Driver
US USD 11.94 Billion (2025) Highest per-capita restorative spend; dense DSO footprint
Canada 12.4% of regional share Federal dental care plan expanding covered population
Mexico 8.6% CAGR (2026–2035) Cross-border dental tourism from US border states


Softness is real but cyclical. North America through 2025 is volatile, with cautious patient spending, yet still delivered 6.8% organic growth in Q4 and claimed premium implantology share gains with its iEXCEL system [19][21]. Dentsply Sirona's Return-to-Growth plan — USD 120 million in targeted annualised savings, dividend eliminated, capital redirected to debt retirement and commercial reinvestment — is a direct response to the same conditions [8]. The Dental Consumables Market in this region is being reshaped less by demand and more by who controls the purchase order.

Europe

Country Metric Key Driver
Germany USD 2.31 Billion (2025) Largest implant base; statutory insurance co-payment structure
UK 6.9% CAGR (2026–2035) NHS capacity constraints pushing private restorative volume
France 13.4% of regional share 100% Santé reimbursement scheme lifting prosthetic volume
Italy USD 1.20 Billion (2025) High edentulism prevalence in ageing cohort
Spain 7.2% CAGR (2026–2035) Corporate clinic chain consolidation
Nordic Countries 7.8% of regional share Public preventive programmes; early digital adoption
Russia USD 0.63 Billion (2025) Import substitution and domestic manufacturing
Rest of Europe 7.5% CAGR (2026–2035) Central European clinic modernisation


Germany leads the European Dental Consumables Market, generating USD 2.31 billion in 2025, supported by its large dental care infrastructure and strong adoption of advanced restorative solutions. The UK is the fastest-growing major market, expanding at a 6.9% CAGR through 2035, while France accounts for 13.4% of the regional share. Italy generated USD 1.20 billion in 2025, with Spain growing at a 7.2% CAGR. The Nordic Countries hold a 7.8% regional share, while Russia reached USD 0.63 billion in 2025. Overall, the European Dental Consumables Market is being shaped by country-level differences in dental expenditure, regulatory transitions, and the pace of adoption of higher-value restorative and preventive consumables.


Asia-Pacific

Country Metric Key Driver
China USD 3.01 Billion (2025) VBP volume expansion at compressed ASPs
India 10.4% CAGR (2026–2035) Rapid private clinic buildout; rising middle-class spend
Japan 17.2% of regional share Ageing population; high prosthodontic intensity
South Korea USD 0.90 Billion (2025) Domestic implant manufacturing scale; high penetration
ASEAN 9.6% CAGR (2026–2035) Dental tourism into Thailand, Vietnam, Malaysia
Rest of Asia-Pacific 9.9% of regional share Urban clinic density growth


China leads the Asia-Pacific Dental Consumables Market, generating USD 3.01 billion in 2025, supported by its expanding dental infrastructure, rising oral healthcare expenditure, and growing demand for restorative and preventive products. India is the fastest-growing major market, projected to expand at a 10.4% CAGR through 2035, reflecting increasing dental awareness and improving access to care. Japan accounts for 17.2% of the regional share, while South Korea generated USD 0.90 billion in 2025. ASEAN is also expanding rapidly at a 9.6% CAGR, with the Rest of Asia-Pacific contributing 9.9% of the regional share. Overall, the region's Dental Consumables Market is being driven by rising treatment volumes, expanding dental service capacity, and increasing adoption of higher-value consumables.


South America

Country Metric Key Driver
Brazil USD 1.18 Billion (2025) Large domestic manufacturing base; extensive private clinic network
Argentina 7.4% CAGR (2026–2035) Currency-driven inbound dental tourism
Rest of South America 24.3% of regional share Colombia and Chile clinic chain expansion


Momentum here has been quietly strong. Latin America is maintaining double-digit revenue growth throughout 2025, contributing disproportionately relative to regional size [21]. Brazil anchors the region with genuine local manufacturing depth in implants and orthodontic components, which insulates buyers from the dollar-pricing volatility that constrains neighbouring markets.

Middle East & Africa

Country Metric Key Driver
Saudi Arabia 9.1% CAGR (2026–2035) Vision 2030 health sector privatisation
UAE USD 0.30 Billion (2025) Medical tourism hub; high expatriate insurance coverage
South Africa 18.4% of regional share Established private dental sector
Egypt 8.2% CAGR (2026–2035) Population scale and expanding urban clinic access
Rest of MEA USD 0.27 Billion (2025) Nascent public oral health programmes


Gulf sovereign health investment is the swing factor. Saudi and Emirati programmes are building private capacity at pace, and both markets skew toward premium implantology and cosmetic prosthetics rather than basic restoratives. Sub-Saharan demand looks different — WHO and UNEP are piloting amalgam phase-down capacity building in Senegal, and the binding constraint across most of the continent is trained clinicians rather than product availability [2].


Dental Consumables Market By Region, 2025-2035

Competitive Benchmarking

Concentration sits in the moderate band. Market Research Future estimates a Herfindahl-Hirschman Index of roughly 620–740 across the global consumables base, with the top five suppliers holding an estimated 38–42% of revenue. Fragmentation is real below that tier: hundreds of regional specialists compete in endodontics, impression materials, and infection control, where switching costs are low and clinical differentiation is thin. Consolidation logic favours acquirers who can bolt specialty chemistry onto an existing distribution and education footprint.

Company Est. Revenue Share Range Key Offerings for Dental Consumables Market Strategic Positioning
Straumann Group ~9–12% Premium and challenger implants, ClearCorrect aligners, biomaterials Innovation-led premium leader with multi-tier price coverage [5][19]
Dentsply Sirona ~8–11% Restoratives, endodontics, prosthetics, orthodontic solutions Broadest portfolio; executing cost restructuring and distribution reset [7][8]
Envista Holdings ~6–9% Nobel Biocare implants, Ormco orthodontics, Kerr restoratives Multi-brand specialist across implants, ortho, and consumables [14]
Henry Schein ~5–8% Private-label consumables and full-line distribution Channel control and practice-management adjacency [15]
Ivoclar ~4–6% Ceramics, composites, digital denture systems Materials science depth in aesthetic restoratives
Solventum ~3–5% Adhesives, composites, orthodontic bonding Post-spin healthcare materials platform
GC Corporation ~3–5% Glass ionomers, preventive materials, impression systems Strong Japan and EMEA position in restorative chemistry
Kuraray Noritake Dental ~2–4% Bonding agents, ceramics, composite resins Adhesive technology specialist
Septodont ~2–4% Dental anaesthetics, endodontic and regenerative products Category leadership in injectable anaesthesia
Ultradent Products ~2–3% Whitening, isolation, etchants, infection control Privately held; agile in consumer-adjacent categories
COLTENE Group ~1–3% Endodontics, impression materials, disinfection Focused mid-tier player with European manufacturing base


Recent News & Developments

  • European Council and Parliament (May 2024 / January 2025): Regulation (EU) 2024/1849 was adopted on 30 May 2024, extending the amalgam prohibition to all EU patients from 1 January 2025 and banning export the same day; manufacture and import restrictions follow on 1 July 2026 [3][4]. The measure permanently redirects European restorative volume toward mercury-free chemistry.
  • Straumann Group (August 2025): Reported H1 2025 revenue of CHF 1.3 billion, +10.2% organic, with successful iEXCEL launch in Europe and Shanghai campus licensing to begin local implant production [23]. Localisation directly addresses China VBP cost pressure.
  • Straumann Group (February 2026): Posted FY2025 revenue of CHF 2.6 billion on 8.9% organic growth and a 26.5% core EBIT margin at constant currency, alongside the SIRIOS X3 intraoral scanner launch and expansion of the AXS cloud platform [19][21]. Digital attach rates are now a stated growth driver.
  • Dentsply Sirona (February 2026): Announced a restructuring plan targeting approximately USD 120 million in annualised savings, recorded a USD 144 million non-cash impairment against orthodontic and implant solutions, and eliminated its quarterly dividend [8]. Capital is being redirected to debt retirement and commercial reinvestment.
  • Dentsply Sirona (May 2026): Reported Q1 2026 net sales of USD 880 million and launched Smart View-Detect, described as the first FDA-cleared, CE-marked AI-enabled diagnostic in its portfolio, while reiterating full-year guidance of USD 3.5–3.6 billion [7]. AI diagnostics expand identified treatment need.
  • Dentsply Sirona (2026): Enhanced US distribution through Atlanta Dental Supply effective 1 August 2026 and expanded its Canadian relationship with Medline Sinclair effective 1 September 2026 [7]. Both moves target independent practices outside group purchasing networks.
  • China National Healthcare Security Administration (2026): The second dental implant volume-based procurement round was postponed to the third quarter of 2026, with the implementation framework expected in July and supplier selection outcomes in August [22]. Distributor caution ahead of the tender depressed first-half regional demand.
  • WHO and UNEP (ongoing): A three-year joint project on phasing down dental amalgam under the Minamata Convention is being piloted in Senegal, Thailand, and Uruguay, building national capacity for mercury-free dentistry and hazardous waste management [2].


Dental Consumables Market Report Scope

Parameter Detail
Market Scope Global consumables used in restorative, prosthodontic, orthodontic, endodontic, periodontic, and preventive dentistry, including implants, biomaterials, aligners, anaesthetics, and protective wear
Study Period 2021–2035 (Historical 2021–2024; Base Year 2025; Forecast 2026–2035)
CAGR 7.7% (2026–2035)
Market Size Checkpoints USD 37.39 Billion (2025); USD 40.45 Billion (2026); USD 58.78 Billion (2031); USD 78.86 Billion (2035)
Fastest Growing Segments Personal protective wear (product); orthodontic (modality); online (channel); DSO/group practices (end-user); Asia-Pacific (geography)
Companies Profiled Straumann Group, Dentsply Sirona, Envista Holdings, Henry Schein, Ivoclar, Solventum, GC Corporation, Kuraray Noritake Dental, Septodont, Ultradent Products, COLTENE Group
Valuation Currency USD Billion, constant 2025 exchange rates

FAQs

How should a procurement team structure supplier contracts in the Dental Consumables Market given VBP-style price resets?
Build indexed pricing clauses tied to published tender outcomes rather than fixed multi-year rates. Dual-source any category where a single supplier holds more than 60% of your spend [22].
What integration problems arise when a practice moves from analogue impressions to chairside printing?
Validated print profiles are material-specific and non-transferable between printer brands, so resin choice locks hardware choice. Budget six to eight weeks of parallel running before retiring the analogue workflow [7].
Which certification barriers slow new entrants into the European Dental Consumables Market?
EU MDR requires per-device clinical evaluation and notified-body review, with recertification costs falling hardest on low-volume SKUs. Smaller manufacturers routinely discontinue niche lines rather than fund the file [18].
Is private-label sourcing a credible margin strategy for group practices?
Yes for commodity categories — isolation, disposables, basic composites — where clinical differentiation is minimal. Avoid it in implants and adhesives, where litigation exposure and clinical outcome variance outweigh unit savings [15].
How do tariff exposures differ across suppliers in the Dental Consumables Market?
Manufacturers with regional production footprints absorb far less. Straumann's currency and tariff drag exceeded CHF 100 million in 2025 despite its multi-site network, which indicates the ceiling on mitigation [19].
What signals indicate a supplier is about to prune a product line?
Watch for withdrawal of clinical education support, distributor agreement non-renewals, and impairment charges against the relevant segment. Dentsply Sirona's 2025 impairment preceded its portfolio and commercial restructuring [8].
Where is regenerative biomaterial demand likely to outpace implant demand?
In markets with high edentulism and delayed treatment, where insufficient bone volume makes grafting a prerequisite rather than an option. Emerging Asia and Eastern Europe fit that profile most closely [1][13].      
Author
Author
Author Profile
Nidhi Mandole LinkedIn
Senior Research Analyst
She is an extremely curious individual currently working in Healthcare and Medical Devices Domain. Nidhi is comfortably versed in data centric research backed by healthcare educational background. She leverages extensive data mining and analytics tools such as Primary and Secondary Research, Statistical Analysis, Machine Learning, Data Modelling. Her key role also involves Technical Sales Support, Client Interaction and Project management within the Healthcare team. Lastly, she showcases extensive affinity towards learning new skills and remain fascinated in implementing them.
Co-Author
Co-Author Profile
Rahul Gotadki LinkedIn
Research Manager
He holds an experience of about 9+ years in Market Research and Business Consulting, working under the spectrum of Life Sciences and Healthcare domains. Rahul conceptualizes and implements a scalable business strategy and provides strategic leadership to the clients. His expertise lies in market estimation, competitive intelligence, pipeline analysis, customer assessment, etc.
Share::
Request Free Sample

Research Approach


Secondary Research

The secondary research process involved comprehensive analysis of medical device regulatory databases, dental industry publications, peer-reviewed clinical journals, and authoritative oral health organizations. Key sources included the US Food & Drug Administration (FDA) Center for Devices and Radiological Health, European Medicines Agency (EMA), American Dental Association (ADA), FDI World Dental Federation, National Institute of Dental and Craniofacial Research (NIDCR/NIH), Centers for Disease Control and Prevention (CDC) Division of Oral Health, World Health Organization (WHO) Oral Health Database, International Organization for Standardization (ISO/TC 106) Dental Standards, Organization for Economic Co-operation and Development (OECD) Health Statistics, EU MedTech Europe Dental Sector reports, and national health ministry statistics from key markets. These sources were used to collect dental procedure statistics, regulatory clearance data for implants and prosthetics, clinical safety studies, oral health demographic trends, and competitive landscape analysis for dental implants, crowns, bridges, orthodontic accessories, and restorative materials.


Primary Research

Qualitative and quantitative insights were obtained by interviewing supply-side and demand-side stakeholders during the primary research process. The supply-side sources consisted of CEOs, VPs of Manufacturing, regulatory affairs chiefs, and commercial directors from dental consumables manufacturers, implant OEMs, and dental laboratory networks. Demand-side sources comprised prosthodontists, orthodontists, oral surgeons, dental clinic directors, purchasing managers from dental service organizations (DSOs), and procurement leads from hospital dentistry departments and dental laboratories. Primary research validated market segmentation across ceramics, metals, polymers, and composites, confirmed CAD/CAM and digital dentistry adoption timelines, and gathered insights on clinical preference patterns, pricing dynamics, and distributor channel strategies.

Primary Respondent Breakdown:

By Designation: C-level Primaries (32%), Director Level (30%), Others (38%)

By Region: North America (38%), Europe (28%), Asia-Pacific (25%), Rest of World (9%)


Market Size Estimation

Global market valuation was derived through revenue mapping and dental procedure volume analysis. The methodology included:

Identification of 50+ key manufacturers across North America, Europe, Asia-Pacific, and Latin America specializing in implants, prosthetics, and orthodontic supplies

Product mapping across dental implants, crowns, bridges, dental instruments, and orthodontic accessories with material segmentation (ceramics, metals, polymers, composites)

Analysis of reported and modeled annual revenues specific to dental consumables portfolios and restorative/orthodontic procedure volumes

Coverage of manufacturers representing 75-80% of global market share in 2024

Extrapolation using bottom-up (procedure volume × ASP by country/region across restorative dentistry, orthodontics, periodontics, and endodontics) and top-down (manufacturer revenue validation) approaches to derive segment-specific valuations for dental clinics, hospitals, and dental laboratories

Share::
Request Free Sample
Download Free Sample

Kindly complete the form below to receive a free sample of this Report

* Please use a valid business email

Share::
Request Free Sample
Download PDF ×

We do not share your information with anyone. However, we may send you emails based on your report interest from time to time. You may contact us at any time to opt-out.
















