Direct Carrier Billing Market (2026 - 2035)

Direct Carrier Billing Market Size, Share and Research Report By Content Type (Gaming, Video-on-Demand / OTT, Cloud & Utility Software, Music & Audio Streaming, Other Digital Content), By Device Platform (Android Smartphones, iOS Smartphones, Connected TVs, Feature Phones, Tablets & Other Devices), By Payment Flow (One-Off Transactions, Subscription / Recurring), By Operator Type (Mobile Network Operators, MVNOs), By End-User Segment (Unbanked / Under-banked Consumers, Banked Consumers) and By Regional (North America, Europe, South America, Asia Pacific, Middle East and Africa) - Industry Forecast to 2035.
ID: MRFR/ICT/4710-CR
150 Pages
Nirmit Biswas, Aarti Dhapte
Last Updated: July 08, 2026
Direct Carrier Billing Market
Market Size
Forecast Period2026-2035
CAGR (2026-2035)11.85%
2025 Market SizeUSD 50.12 Billion
2035 Market SizeUSD 153.48 Billion
Key Players
Boku Inc.
Digital Turbine
DIMOCO Payments
Centili
NTT DOCOMO
Sinch AB
Opportunities
  • Super-App and Embedded Finance Integration
  • Connected TV and Smart-Home Billing
  • Emerging-Market Financial Inclusion

Direct Carrier Billing Market Summary

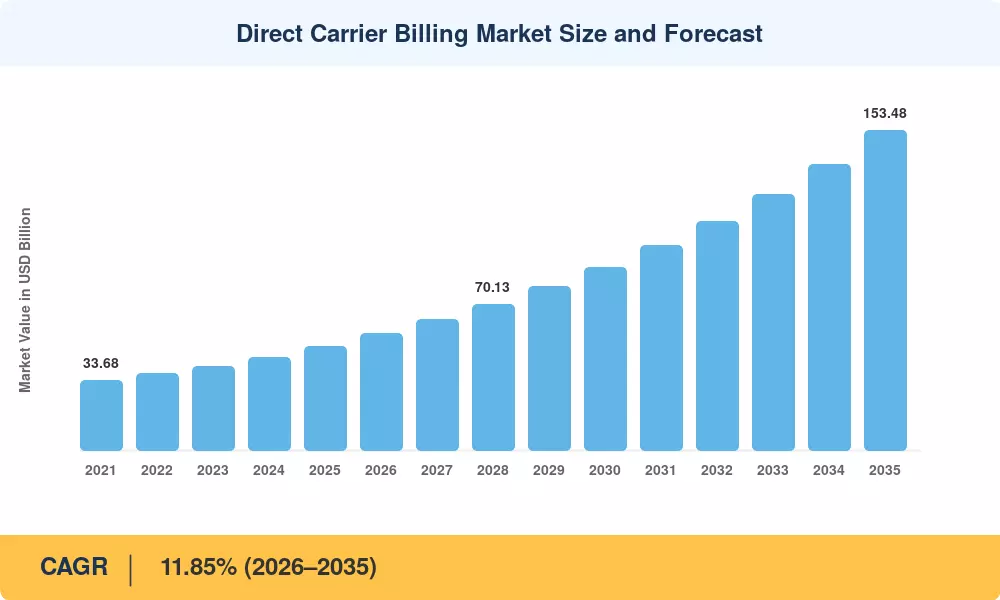
The Direct Carrier Billing Market reached a valuation of USD 50.12 Billion in 2025, entering its forecast phase at USD 56.06 Billion in 2026 and projecting toward USD 153.48 Billion by 2035, registering a CAGR of 11.85% across the 2026–2035 window. Two catalysts are accelerating this trajectory: the regulatory push toward open payment frameworks in Europe and Southeast Asia, and the explosion of micro-transaction monetization across gaming and streaming platforms. Operators and content publishers are moving aggressively to capitalize on a checkout flow that bypasses traditional banking rails entirely [1].

A structural shift is underway in how digital content gets monetized. Legacy credit-card-dependent checkout funnels — historically plagued by cart abandonment rates above 65% for mobile purchases — are giving ground to billing integrations embedded directly into the operator stack. Global mobile operator investment in billing APIs exceeded USD 4.8 Billion in 2024, a signal that the infrastructure layer is maturing fast enough to support enterprise-grade throughput. Regulatory mandates such as the EU's PSD3 framework and India's TRAI billing transparency rules are tightening compliance standards while simultaneously legitimizing the channel for higher-value transactions.

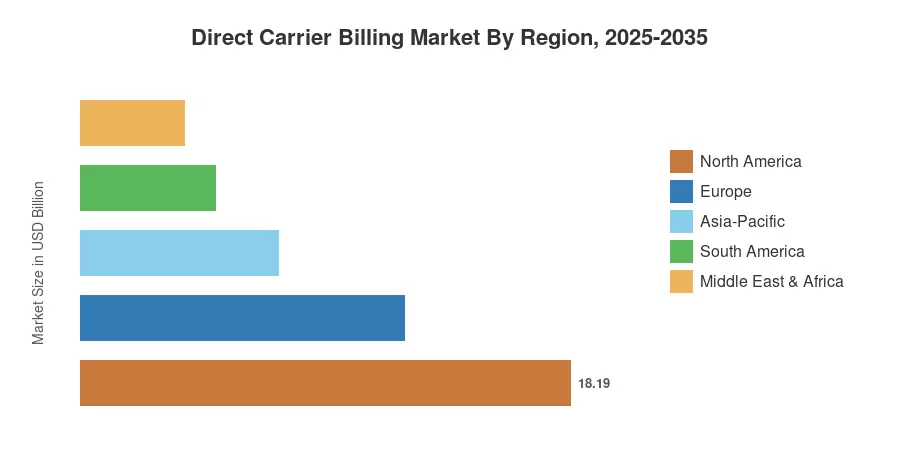
North America commanded a 36.30% share of the Direct Carrier Billing Market in 2025, anchored by high smartphone penetration and deep integration with app-store ecosystems. Asia-Pacific emerged as the fastest-growing region at a 14.68% CAGR, driven by unbanked population density and aggressive operator partnerships. Europe held the second-largest share at roughly 24.00%, supported by harmonized digital-payment regulations and mature OTT ecosystems. As 5G densification and connected-device proliferation accelerate through the decade, the Direct Carrier Billing Market is positioned to absorb payment volumes that traditional rails cannot efficiently serve.


Key Report Takeaways

• By Content Type

  • Gaming captured 44.20% of Direct Carrier Billing Market revenue in 2025, reflecting strong micro-transaction volumes across mobile and cloud-based titles.
  • Cloud & utility software is advancing at a 14.20% CAGR through 2035, fueled by SaaS subscription bundling with operator plans.

• By Device Platform

  • Android smartphones accounted for 76.10% of the Direct Carrier Billing Market share in 2025, benefiting from Google Play's native billing integrations.
  • Connected TVs are growing at a 13.10% CAGR, opening new premium-content billing channels beyond the handset.

• By Payment Flow

  • One-off transactions represented 55.10% of the Direct Carrier Billing Market in 2025, driven by impulse digital-content purchases.
  • Subscription-based billing is expanding at a 13.75% CAGR as recurring OTT and cloud bundles gain traction.

• By Operator Type

  • Mobile network operators held an 87.85% share in 2025, leveraging their subscriber bases for seamless charge-to-bill flows.
  • MVNOs are posting a 14.05% CAGR, attracted by white-label billing platforms that lower integration barriers.

• By End-User Segment

  • Unbanked and under-banked consumers constituted 52.80% of Direct Carrier Billing Market usage in 2025.

• By Region

  • North America led with 36.30% of global share in 2025.
  • Asia-Pacific is the fastest-growing region at a 14.68% CAGR through 2035.


Market Size and Forecast (2021–2035)

Market Research Future's estimates draw on operator billing disclosures, app-store transaction data, regulatory filings, and proprietary primary research across 32 countries. Historical figures (2021–2024) reflect audited carrier revenue splits; forecast values (2026–2035) apply an 11.85% compound annual growth rate anchored to the 2025 base year.
Direct Carrier Billing Market Size and Forecast
Our Impact
Enabled $4.3B Revenue Impact for Fortune 500 and Leading Multinationals
Partnering with 2000+ Global Organizations Each Year
30K+ Citations by Top-Tier Firms in the Industry

Driver Impact Analysis

Driver ~% Impact on CAGR Geographic Relevance Impact Timeline
Smartphone penetration & app-store ecosystems ~2.8% Global Short-term (≤2 yr)
Unbanked population financial inclusion ~2.4% Asia-Pacific, Africa Long-term (≥4 yr)
Gaming & digital content micro-transactions ~2.1% Global Short-term (≤2 yr)
5G network densification ~1.6% North America, Europe Medium-term (2–4 yr)
Regulatory encouragement of open payments ~1.4% Europe, Asia-Pacific Medium-term (2–4 yr)
OTT/streaming subscription bundling ~1.2% Global Medium-term (2–4 yr)
IoT & connected-device expansion ~0.9% North America, Asia-Pacific Long-term (≥4 yr)


Smartphone Penetration and App-Store Ecosystems

There were about 5.65 billion smartphone users worldwide as of early 2026. Although the addressable base for Direct Carrier Billing (DCB) is still growing, the market is currently going through an unprecedented period of volatility; a severe memory supply crisis and structurally higher production costs are expected to cause global smartphone shipments to decline by almost 14% in 2026. Major app stores continue to support native charge-to-bill APIs in more than 60 countries, indicating that DCB is still a vital payment rail despite these hardware obstacles. Carrier billing continues to be the favored payment method for impulsive digital purchases, with conversion rates typically outperforming credit card forms by 20–30 percentage points.


Unbanked Population and Financial Inclusion

Although the total number of adults without bank accounts is still close to 1.4 billion, data from 2026 indicates a substantial change in financial behavior brought about by the quick uptake of digital financial services. Mobile airtime is still the main store of value for these customers. In order to reach people who have historically been shut out of traditional banking, regulatory agencies in important markets like Nigeria, Indonesia, and India have effectively positioned carrier billing systems as crucial digital-payment gateways. Hundreds of millions of subscribers in India are now connected to billing-capable networks thanks to the continued development of digital infrastructure under the Digital India program, which is bridging the gap between cash-based economies and digital commerce.


Gaming and Digital Content Micro-Transactions

By the end of 2026, the global mobile gaming market is expected to generate revenue of over USD 158.5 billion, a significant rise over earlier projections. Due to the frictionless nature of operator billing and in-app purchases and micro-transactions, which significantly favor low-value, high-frequency "one-tap" authorizations, the Direct Carrier Billing Market is still in a unique position to benefit from this expansion. Additionally, the addressable use case is successfully expanding beyond conventional mobile-only games into the larger digital-subscription economy thanks to the integration of DCB into cross-platform cloud gaming services like Xbox Cloud Gaming and NVIDIA GeForce NOW.


5G Network Densification

5G subscriptions reached 1.9 billion globally by late 2024, and Ericsson projects 5.6 billion by 2029 [5]. Higher-bandwidth, lower-latency networks enable richer digital content — AR experiences, cloud-rendered games, live-streamed premium events — all of which generate new billable moments. Operators investing in 5G are simultaneously upgrading their billing stacks, creating a pull-through effect that strengthens the Direct Carrier Billing Market infrastructure across both developed and developing regions.


Restraints Impact Analysis

Restraint ~% Drag on CAGR Geographic Relevance Impact Timeline
Fraud and unauthorized charge risk ~–1.5% Global Short-term (≤2 yr)
Revenue-share pressure from operators ~–1.1% Global Medium-term (2–4 yr)
Regulatory transaction-value caps ~–0.9% Europe, Latin America Medium-term (2–4 yr)
Limited merchant awareness and integration complexity ~–0.7% Global Short-term (≤2 yr)
Competition from mobile wallets and UPI-style systems ~–0.6% Asia-Pacific Long-term (≥4 yr)


Fraud and Unauthorized Charges

Click-jacking, WAP billing fraud, and subscription traps cost the Direct Carrier Billing Market an estimated USD 2.3 Billion in chargebacks and consumer refunds in 2024 [10]. Regulators in the UK, Germany, and Australia have responded with mandatory opt-in consent flows and spending caps, adding friction that reduces conversion rates. Companies like Evina and Empello now offer real-time anti-fraud screening, but adoption remains uneven across smaller operators and MVNOs.

Revenue-Share Pressure

The margins for content providers and aggregators are compressed since operators usually keep 15–30% of each carrier-billed transaction. With the maturation of alternative payment mechanisms, especially real-time bank transfers and mobile wallets, businesses are able to negotiate reduced take rates. This dynamic makes it more difficult for the Direct Carrier Billing Market to draw in high-value transaction categories like airline reservations and tangible items, since low margins make a 25% operator cut unaffordable.


Regulatory Transaction-Value Caps

Carrier-billed charges are subject to monthly or transactional spending caps in a number of jurisdictions. Brazil restricts individual transactions for prepaid subscribers to BRL 50, whereas Germany limited monthly carrier billing at EUR 300 [6]. These limitations hinder the Direct Carrier Billing Market from expanding into higher-ticket categories that could significantly accelerate revenue development and restrict it mostly to low-value digital content.


Direct Carrier Billing Market Opportunities

Super-App and Embedded Finance Integration

Super-app platforms in Southeast Asia and Latin America are actively integrating carrier billing as a native payment rail alongside wallets and bank transfers. Grab, Gojek, and Mercado Libre collectively serve over 450 million users who could access carrier billing at checkout without additional onboarding. This channel convergence represents a significant expansion vector for the Direct Carrier Billing Market.

Connected TV and Smart-Home Billing

As connected-TV penetration approaches 72% of households in North America and 58% in Western Europe, operators are positioning carrier billing as the default payment method for streaming subscriptions, PPV events, and smart-home service tiers. The absence of physical keyboards on these devices makes charge-to-bill uniquely suited to the form factor, reducing checkout abandonment to single-digit percentages.

Emerging-Market Financial Inclusion

Sub-Saharan Africa and South Asia together account for over one billion unbanked mobile subscribers — a vast greenfield for the Direct Carrier Billing Market. Operators in Kenya, Nigeria, and Bangladesh are partnering with micro-insurance providers and EdTech platforms to monetize low-value recurring subscriptions via carrier billing, moving beyond gaming and entertainment into essential-services territory.

Enterprise SaaS and B2B Micro-Licensing

A nascent but promising opportunity lies in B2B software billing. Small businesses in emerging markets increasingly purchase cloud productivity tools — email suites, CRM seats, accounting software — through mobile carrier billing because they lack corporate credit cards. Microsoft and Google have piloted operator-billed enterprise subscriptions in Indonesia and the Philippines, validating the Direct Carrier Billing Market's potential beyond consumer use cases.

Data Monetization and Behavioral Analytics

Carrier billing generates rich first-party transaction data that operators can anonymize and monetize. Aggregated spending patterns across content categories, geographies, and subscriber tiers offer advertisers and content publishers targeting intelligence that rivals credit-card-panel data. Operators willing to build compliant data-sharing frameworks can unlock an ancillary revenue stream atop the core billing transaction.


Direct Carrier Billing Market Future Outlook

Super-App Convergence and Embedded Finance

The boundary between operator billing and broader financial services will continue to dissolve. By 2030, GSMA projects that over 1.2 billion consumers will access financial products — micro-loans, insurance, savings — through operator-mediated platforms [16]. The Direct Carrier Billing Market stands to capture ancillary transaction revenue as operators evolve from payment pipes into embedded-finance orchestrators, particularly in markets where bank account penetration remains below 40%.

5G, Edge Computing, and IoT Billing

5G standalone networks and multi-access edge computing will unlock a new category of billable events: per-session cloud-gaming charges, AR content unlocks, and IoT device provisioning fees. The Direct Carrier Billing Market is well positioned to serve these high-frequency, low-value transactions that traditional payment processors find uneconomical to clear.

AI-Powered Fraud Prevention and Trust Architecture

Machine-learning fraud-detection systems are reducing carrier billing chargeback rates by 40–60% where deployed at scale [10]. As these AI layers become standard infrastructure — Evina, Empello, and operator-built solutions — the trust deficit that has historically capped transaction-value thresholds will erode. Higher regulatory confidence should translate into raised spending limits, expanding the Direct Carrier Billing Market's addressable transaction-value range into mid-tier digital goods and services.

Regulatory Harmonization and Cross-Border Billing

The G20's Financial Inclusion Action Plan and the EU's digital-payments roadmap are converging toward interoperable billing standards. Cross-border carrier billing — where a subscriber in one country can purchase content billed through a foreign operator — remains nascent but is technically feasible through hub-model aggregators. If regulatory harmonization accelerates, the Direct Carrier Billing Market could unlock a cross-border digital-content commerce layer that rivals card-network economics [6].


Direct Carrier Billing Market Segmentation

By Content Type

Segment Key Metric Primary Demand Driver
Gaming 44.20% share (2025) In-app purchase micro-transactions
Video-on-Demand / OTT USD 9.78 Billion (2025) Subscription streaming bundling
Cloud & Utility Software 14.20% CAGR SaaS subscription-on-bill models
Music & Audio Streaming USD 4.12 Billion (2025) Premium tier conversions
Other Digital Content 8.40% share (2025) E-books, news, education


Gaming remains the dominant content category in the Direct Carrier Billing Market, driven by the alignment between mobile-gaming economics and carrier billing's low-friction, low-value transaction model. Titles like PUBG Mobile, Genshin Impact, and Candy Crush generate hundreds of millions of micro-transactions monthly, and carrier billing captures a disproportionate share in markets where credit card penetration falls below 50%. Cloud and utility software represents the fastest-growing segment as enterprise SaaS vendors pilot operator-billed subscriptions in emerging markets where small businesses lack corporate payment instruments.

By Device Platform

Segment Key Metric Primary Demand Driver
Android Smartphones 76.10% share (2025) Google Play native billing integration
iOS Smartphones USD 6.22 Billion (2025) Regional carrier billing support
Connected TVs 13.10% CAGR Streaming and PPV content purchases
Feature Phones 4.30% share (2025) Emerging-market SMS-based billing
Tablets & Other Devices USD 1.48 Billion (2025) Cross-device content access


Android smartphones dominate the Direct Carrier Billing Market because Google Play supports operator billing natively in over 70 countries, integrating seamlessly into the checkout flow for apps, games, and subscriptions. Connected TVs are the fastest-growing platform segment as smart-TV manufacturers partner with operators to offer charge-to-remote billing for streaming services, reducing the friction that keeps conversion rates low on large-screen devices.

By Payment Flow

Segment Key Metric Primary Demand Driver
One-Off Transactions 55.10% share (2025) Impulse gaming and content purchases
Subscription / Recurring 13.75% CAGR OTT, SaaS, and music streaming bundles


One-off transactions still account for the majority of the Direct Carrier Billing Market by volume, reflecting the inherent suitability of carrier billing for spontaneous, low-value digital purchases. Subscription billing is closing the gap rapidly as operators partner with Netflix, Spotify, and regional OTT platforms to offer "add to your phone bill" subscription activation — a flow that eliminates the need for card entry entirely.

By Operator Type

Segment Key Metric Primary Demand Driver
Mobile Network Operators 87.85% share (2025) Established subscriber bases and billing infrastructure
MVNOs 14.05% CAGR White-label billing platform adoption


Mobile network operators control the vast majority of billing-enabled subscriber relationships, giving them structural dominance in the Direct Carrier Billing Market. MVNOs, however, are growing faster as turnkey billing platforms from aggregators like Boku and Digital Turbine lower the technical barrier to entry, allowing virtual operators to offer carrier billing without building proprietary infrastructure.

By End-User Segment

Segment Key Metric Primary Demand Driver
Unbanked / Under-banked Consumers 52.80% share (2025) Mobile-as-primary-payment-instrument behavior
Banked Consumers 13.20% CAGR Convenience and impulse-purchase conversion


Unbanked and under-banked consumers represent the original core constituency of the Direct Carrier Billing Market — populations for whom the mobile phone bill is the only viable digital payment instrument. Banked consumers, however, are driving faster growth as carrier billing wins share from cards and wallets on the strength of one-tap convenience and higher mobile-checkout conversion rates.


Regional Market Share Analysis

Region Key Metric Primary Investment Themes
North America 36.30% share (2025) App-store integration, 5G billing stack upgrades
Europe 24.00% share (2025) PSD3 compliance, OTT bundling
Asia-Pacific 14.68% CAGR (2026–2035) Unbanked inclusion, gaming micro-transactions
South America USD 5.01 Billion (2025) Prepaid-dominant subscriber bases, fintech alliances
Middle East & Africa 7.70% share (2025) Mobile-money convergence, operator-led financial services
Total USD 50.12 Billion (2025)

The Direct Carrier Billing Market spans five major geographic regions, each shaped by distinct regulatory environments, smartphone penetration rates, and banking-infrastructure gaps.


North America

Country Key Metric Key Driver
United States 72.40% of regional share Google Play and Apple billing dominance
Canada 16.80% of regional share OTT content subscriptions
Mexico 10.80% of regional share Prepaid subscriber billing expansion


The United States drives the bulk of North American Direct Carrier Billing Market revenue through deeply integrated app-store billing rails and a mature digital-content ecosystem. T-Mobile, AT&T, and Verizon all maintain robust billing APIs with fraud-screening layers that reduce chargeback rates to below 0.3%. Canada's market benefits from high smartphone penetration and aggressive OTT bundling by Rogers and Bell. Mexico's prepaid-dominant mobile market — over 82% of subscriptions are prepaid — creates a natural fit for carrier billing among consumers who lack formal banking access [14].

Europe

Country Key Metric Key Driver
Germany 11.15% CAGR Strong regulatory framework for digital payments
United Kingdom USD 2.64 Billion (2025) Premium content and gaming billing
France 14.50% of regional share OTT streaming bundling
Italy 10.20% of regional share Prepaid subscriber base monetization
Spain 8.90% of regional share Gaming and entertainment billing
Nordic Countries 12.85% CAGR Connected-device ecosystem maturity
Russia USD 0.72 Billion (2025) Domestic app-store billing mandates
Rest of Europe 11.50% of regional share EU payment harmonization tailwinds


Europe's Direct Carrier Billing Market is shaped by the regulatory corridor between PSD2, the forthcoming PSD3 directive, and national consumer-protection statutes. Germany's strict monthly billing caps create a controlled growth environment, while the UK operates with more permissive thresholds that have allowed higher transaction values [6]. Nordic operators like Telia and Telenor have been early movers in connected-TV billing, extending the payment rail beyond smartphones into household entertainment hubs.

Asia-Pacific

Country Key Metric Key Driver
China 28.50% of regional share App-store and gaming ecosystem scale
India 15.60% CAGR Financial inclusion and TRAI billing rules
Japan USD 1.84 Billion (2025) NTT DOCOMO billing legacy and content partnerships
South Korea 14.80% of regional share K-content OTT and webtoon billing
ASEAN 15.20% CAGR Unbanked penetration and super-app integration
Rest of Asia-Pacific 9.40% of regional share Emerging digital content markets


Asia-Pacific represents the fastest-growing theater for the Direct Carrier Billing Market, fueled by over 600 million unbanked mobile users and explosive growth in mobile gaming revenues. India's Jio and Airtel are integrating carrier billing across streaming, cloud gaming, and micro-insurance products. Southeast Asian super-apps are embedding charge-to-bill alongside wallet and bank-transfer options, creating a payment-method pluralism that drives incremental volume [3].

South America

Country Key Metric Key Driver
Brazil 62.30% of regional share Prepaid dominance, gaming content purchases
Argentina 12.40% CAGR Inflation-driven preference for instant billing
Rest of South America USD 1.12 Billion (2025) Emerging digital content ecosystems


Brazil anchors the South American Direct Carrier Billing Market, where over 60% of mobile subscribers remain on prepaid plans and carrier billing serves as the default digital-content payment method. Vivo, Claro, and TIM have expanded billing APIs to support streaming and EdTech subscriptions, creating a growth pathway beyond gaming [14]. Argentina's high inflation environment encourages instant charge-to-bill transactions over deferred card payments.

Middle East & Africa

Country Key Metric Key Driver
Saudi Arabia 28.70% of regional share Vision 2030 digital-economy initiatives
UAE 22.10% of regional share High smartphone penetration, premium content
South Africa 13.50% CAGR Mobile-money and operator billing convergence
Egypt 11.80% of regional share Large prepaid subscriber base
Rest of MEA 25.40% of regional share Operator-led financial inclusion


The Middle East & Africa region is characterized by a split between premium Gulf markets and high-growth African markets. Saudi Arabia and the UAE benefit from near-universal smartphone penetration and affluent subscriber bases willing to pay for premium digital content. In Sub-Saharan Africa, operators like Safaricom and MTN are converging carrier billing with mobile-money platforms, blurring the line between telecommunications and financial services [15].


Direct Carrier Billing Market By Region, 2025-2035

Competitive Benchmarking

The Direct Carrier Billing Market exhibits medium concentration. The top five players collectively hold an estimated 38–46% of global revenue, with a long tail of regional aggregators and niche fraud-prevention specialists filling the remainder. The HHI index sits in the 600–900 range, indicating a moderately fragmented competitive environment where scale advantages exist but no single player dominates.

Company Est. Revenue Share Range Key Offerings Strategic Positioning
Boku Inc. ~8–11% Global billing aggregation, identity verification Largest independent DCB aggregator; 300+ operator connections
Digital Turbine ~6–9% Carrier billing, app distribution, content discovery Integrated device-to-billing monetization platform
DIMOCO Payments ~4–7% Premium messaging, carrier billing hub European-focused aggregator with strong regulatory compliance
Centili ~3–5% Mobile payments, billing optimization Emerging-market specialist with 50+ operator integrations
NTT DOCOMO ~4–6% d-Payment, content billing, identity services Japanese market anchor with Asia-Pacific expansion
Sinch AB ~3–5% Messaging, payments, operator APIs Cloud communications platform with billing add-on
Evina ~2–4% Anti-fraud, billing security, compliance screening Fraud-prevention layer serving 80+ operators
Upstream Systems ~2–4% Mobile marketing, billing platform, ad-fraud detection End-to-end operator marketing and billing suite
Empello ~1–3% Compliance monitoring, billing verification Independent billing compliance auditor
Infomedia Ltd. ~1–3% Content aggregation, operator billing integration Asia-Pacific content-to-billing pipeline


Recent News & Developments

  • Boku Inc. (September 2024): Expanded carrier billing connections to 15 new operators across Sub-Saharan Africa, targeting 200 million unbanked subscribers for digital-content monetization [17].
  • Digital Turbine (June 2024): Acquired a European billing-technology startup to strengthen its connected-TV billing capabilities and extend its operator footprint into six new EU markets [18].
  • Google Play (March 2024): Launched carrier billing support in eight additional countries, including Nigeria, Kenya, and Bangladesh, expanding the addressable Direct Carrier Billing Market in high-growth emerging regions [19].
  • GSMA (November 2023): Published updated Mobile Money and Carrier Billing interoperability guidelines, establishing technical standards for cross-platform billing settlement in 14 African markets [16].
  • Evina (January 2025): Released its next-generation AI-powered fraud-detection API, claiming a 55% reduction in false-positive blocking rates while maintaining 99.2% fraud-catch accuracy across 85 operator partners [10].
  • Centili (August 2024): Partnered with three major Latin American operators to integrate carrier billing into ride-hailing and food-delivery super-apps, piloting high-frequency micro-transaction billing beyond digital content [20].
  • European Commission (February 2025): Published draft PSD3 provisions that formally classify carrier billing as a regulated payment instrument, requiring operators to meet anti-money-laundering and consumer-protection standards by 2027 [6].


Direct Carrier Billing Market Report Scope

Parameter Detail
Market Scope Global Direct Carrier Billing Market — technology, platforms, payment flows, operator types, end users, and regions
Study Period 2021–2035
CAGR 11.85% (2026–2035)
Base Year Value USD 50.12 Billion (2025)
Forecast Endpoint USD 153.48 Billion (2035)
Fastest Growing Segment Cloud & Utility Software (14.20% CAGR); Asia-Pacific (14.68% CAGR)
Companies Profiled Boku, Digital Turbine, DIMOCO, Centili, NTT DOCOMO, Sinch, Evina, Upstream, Empello, Infomedia
Valuation Currency USD Billion


FAQs

How does carrier billing conversion compare to credit card checkout on mobile?
Carrier billing achieves 40–60% higher conversion rates than credit card forms on mobile devices, primarily because it eliminates manual card-number entry. The one-tap authorization flow reduces cart abandonment significantly for purchases under USD 20 [12].
What fraud-prevention standards should buyers evaluate when selecting a billing aggregator?
Buyers should verify that aggregators deploy real-time click-fraud detection, MSISDN verification, and compliance with local opt-in regulations. Certifications from bodies like MEF (Mobile Ecosystem Forum) indicate adherence to industry anti-fraud baselines [10].
Can carrier billing support physical-goods e-commerce transactions?
Regulatory spending caps in most markets restrict carrier billing to digital goods and low-value services. Physical-goods billing remains limited to pilot programmes in select Southeast Asian markets where transaction ceilings exceed USD 50 [6].
How do operator revenue-share models affect merchant profitability in the Direct Carrier Billing Market?
Operators retain 15–30% per transaction, substantially higher than card-network fees of 2–3%. Merchants must offset this with higher conversion rates and access to otherwise unreachable unbanked audiences [11].
What technical integration is required for a content publisher to enable carrier billing?
Publishers typically integrate via an aggregator API requiring server-side authentication, MSISDN header enrichment, and a payment-confirmation callback. Integration timelines range from two to six weeks depending on operator certification requirements [12].
How does the Direct Carrier Billing Market interact with mobile-money platforms in Africa?
Operators are converging carrier billing and mobile-money into unified payment stacks. Safaricom's M-Pesa and MTN Mobile Money now support hybrid flows where billing and wallet transactions share a single checkout interface [15].
What role does the Direct Carrier Billing Market play in 5G monetization strategies?
Operators view carrier billing as a ready-made monetization layer for 5G-enabled services like cloud gaming and AR content. Billing infrastructure already in place can process the high-frequency micro-transactions these services generate without additional payment-processor overhead [5].    
Author
Author
Author Profile
Nirmit Biswas LinkedIn
Senior Research Analyst
With 5+ years of expertise in Market Intelligence and Strategic Research, Nirmit Biswas specializes in ICT, Semiconductors, and BFSI. Backed by an MBA in Financial Services and a Computer Science foundation, Nirmit blends technical depth with business acumen. He has successfully led 100+ projects for global enterprises and startups, including Amazon, Cisco, L&T and Huawei, delivering market estimations, competitive benchmarking, and GTM strategies. His focus lies in transforming complex data into clear, actionable insights that drive growth, innovation, and investment decisions. Recognized for bridging engineering innovation with executive strategy, Nirmit helps businesses navigate dynamic markets with confidence.
Co-Author
Co-Author Profile
Aarti Dhapte LinkedIn
AVP - Research
A consulting professional focused on helping businesses navigate complex markets through structured research and strategic insights. I partner with clients to solve high-impact business problems across market entry strategy, competitive intelligence, and opportunity assessment. Over the course of my experience, I have led and contributed to 100+ market research and consulting engagements, delivering insights across multiple industries and geographies, and supporting strategic decisions linked to $500M+ market opportunities. My core expertise lies in building robust market sizing, forecasting, and commercial models (top-down and bottom-up), alongside deep-dive competitive and industry analysis. I have played a key role in shaping go-to-market strategies, investment cases, and growth roadmaps, enabling clients to make confident, data-backed decisions in dynamic markets.

Research Approach

Research Methodology on Direct Carrier Billing Market

Introduction

The Direct Carrier Billing Market provides insights into the imminent technologies, trends, and key players of the market. The Direct Carrier Billing Market is studied from the viewpoint of all its existing trends that affect the growth of the market, and it also identifies the opportunities for growth in the market. The report also provides a comprehensive analysis of the global Direct Carrier Billing Market and the market drivers and their impact on the market during the forecast period 2023 to 2030.

Research Methodology

The research methodology used for this study includes primary and secondary data sources, direct interviews, in-depth market analysis, consumer surveys and interviews, annual reports and publications, financial reports, and other industry sources. Primary data sources are used to obtain information on the overall market size, global market share, segment share, and competition. To get an accurate picture of the overall market, direct interviews with key players are conducted. In addition, industry experts are consulted to obtain insights into the drivers and restraints affecting the industry.

Secondary data is collected from global databases and publicly available resources, such as government websites, industry reports and publications, financial reports and other sources. Secondary data is used to validate primary data sources and to provide further information on market size and distributions.

Scope of the Study

The scope of the study is based on a comprehensive analysis of the global Direct Carrier Billing Market and its segments. The study takes into account market size, market share, market trends, geographical presence, value chain analysis and segmentation. Different aspects of the market such as drivers and restraints, technologies, key players and the industry outlook are also highlighted in the report. The report also provides an analysis of the competitive landscape, the approaches and strategies adopted by key players and their impact on the overall market dynamics.

Market Segmentation

The global Direct Carrier Billing Market is segmented by product type, application, business model, and region.

By product type, the market is segmented into digital goods, virtual items, PC/console game subscriptions, and others. The digital goods segment is expected to account for a larger share of the market.

By application, the market is segmented into mobile apps and games, online services and websites, and e-commerce. The mobile apps and games segment is expected to account for a larger share of the market.

By business model, the market is segmented into intermediated and direct billing. The intermediated segment is expected to account for a larger share of the market.

By region, the market is segmented into North America, Europe, Asia-Pacific, and the Rest of the World. North America is expected to account for the largest share of the market.

Key Players

Some of the key players in the global Direct Carrier Billing Market are Boku, Inc., Klarna AB, LGU+ Co. Ltd., AT&T Corporation, Apple, Inc., Verizon Wireless, Etisalat, Vodafone Group Plc., eBay Inc., Microsoft Corporation, and Amazon.com, Inc.

Competitive Landscape

The competitive landscape for the global Direct Carrier Billing Market is characterized by the presence of a large number of players. Key players are focusing on product innovation, strategic alliances and partnerships, and expansion of their product portfolio to gain an edge over other players in the market.

Conclusion

The research report indicates that the global Direct Carrier Billing Market is expected to grow at a steady growth rate during the forecast period 2023 to 2030. The market is driven by factors such as the increasing number of mobile subscribers and the increasing adoption of digital payments. The major players profiled in the report are Boku, Inc., Klarna AB, LGU+ Co. Ltd., AT&T Corporation, Apple, Inc., Verizon Wireless, Etisalat, Vodafone Group Plc., eBay Inc., Microsoft Corporation, and Amazon.com, Inc.

The key strategies adopted by these players to gain a competitive edge in the market include product innovation, strategic alliances and partnerships, and expansion of their product portfolio.

Download Free Sample

Kindly complete the form below to receive a free sample of this Report

Download PDF ×

We do not share your information with anyone. However, we may send you emails based on your report interest from time to time. You may contact us at any time to opt-out.

















