Segmentation Quick Reference
| Dimension | Sub-Segments | Dominant Segment | Fastest Growing Segment |
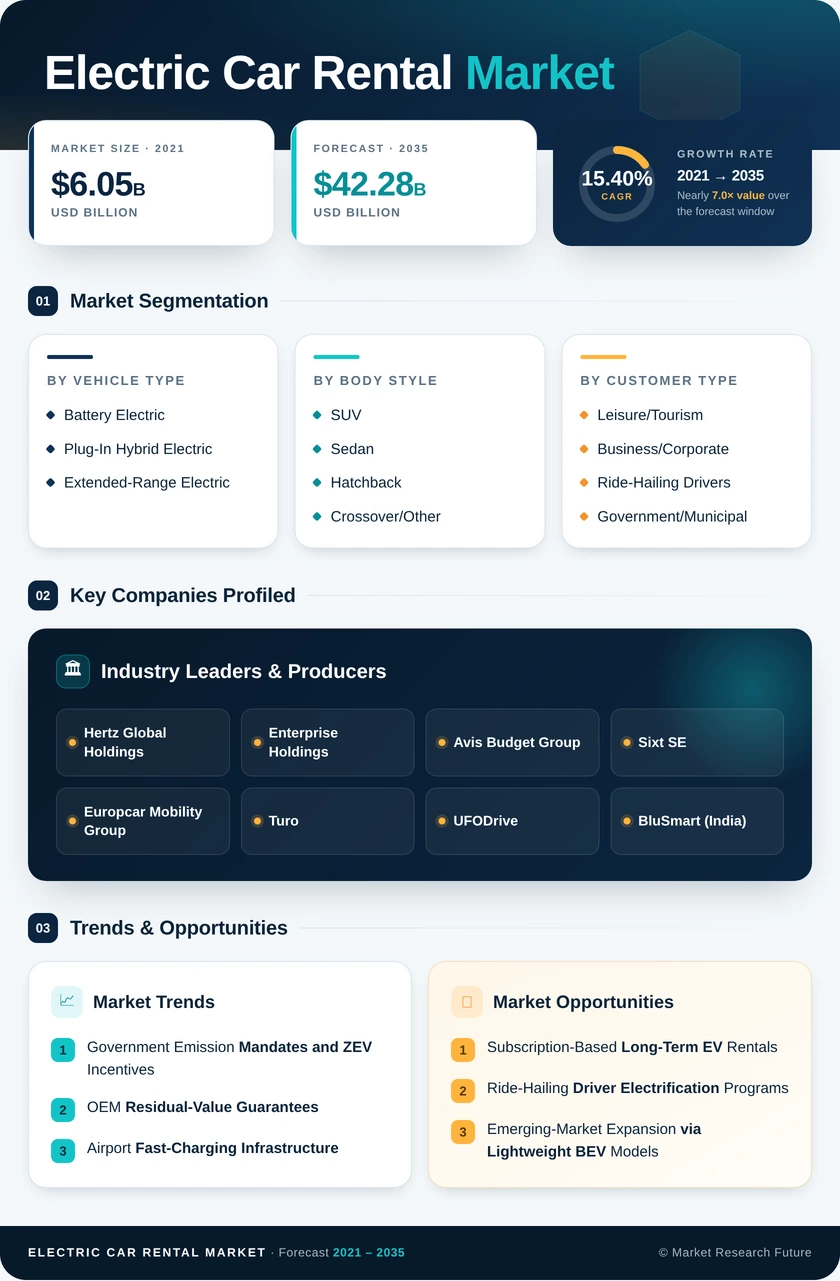
| Vehicle Type | Battery Electric, Plug-In Hybrid Electric, Extended-Range Electric | Battery Electric | Plug-In Hybrid Electric |
| Body Style | SUV, Sedan, Hatchback, Crossover/Other | SUV | Hatchback |
| Customer Type | Leisure/Tourism, Business/Corporate, Ride-Hailing Drivers, Government/Municipal | Leisure/Tourism | Ride-Hailing Drivers |
| Booking Channel | Online, Offline | Online | Online |
| Rental Duration | Short-Term, Medium-Term, Long-Term/Subscription | Short-Term | Long-Term/Subscription |
| Price Tier | Budget/Economy, Mid-Range, Luxury/Premium | Budget/Economy | Luxury/Premium |
| End-Use Purpose | Airport Transport, City/Urban Mobility, Last-Mile Delivery, Tourism/Road Trip | Airport Transport | Last-Mile Delivery |
Market Segmentation Overview
By Vehicle Type
| Sub-Segment | Key Trend |
| Battery Electric | OEM residual-value programs and declining battery costs drive dominant share across rental operators |
| Plug-In Hybrid Electric | Bridge solution for markets with limited DC fast-charging density; share declining as infrastructure matures |
| Extended-Range Electric | Niche adoption in long-distance tourism and rural rental corridors where charging gaps persist |
Battery-electric models remain the procurement default for operators across the Electric Car Rental Market, given their superior total-cost-of-ownership profile and alignment with regulatory zero-emission mandates. Plug-in hybrids serve as a transitional option in markets where infrastructure buildout lags fleet deployment ambitions.
By Body Style
| Sub-Segment | Key Trend |
| SUV | Family and leisure travel preference drives the largest body-style share; Tesla Model Y and VW ID.4 lead deployments. |
| Sedan | Corporate travel and ride-hailing subscriptions favor sedan form factors for fuel efficiency and urban maneuverability. |
| Hatchback | Compact urban rentals and short-term city use cases position hatchbacks as the fastest-growing body style |
| Crossover/Other | Emerging lifestyle segment attracting younger demographics seeking differentiated rental experiences |
SUVs dominate rental demand in the leisure segment, while sedans maintain strong pull from corporate accounts that prioritize per-mile cost efficiency and professional appearance.
By Customer Type
| Sub-Segment | Key Trend |
| Leisure/Tourism | Destination tourism boards partner with rental firms to promote green travel packages and eco-certifications |
| Business/Corporate | ESG compliance mandates and managed-travel program requirements drive contractual EV rental demand |
| Ride-Hailing Drivers | Platform electrification mandates from Uber, Ola, and Bolt create high-utilization subscription demand. |
| Government/Municipal | Public-sector zero-emission fleet targets drive bulk procurement from national and local authorities. |
Leisure travelers account for the majority of rental transactions, but ride-hailing driver subscriptions represent the fastest-growing customer segment due to platform mandates and weekly utilization rates exceeding 85%.
By Booking Channel
| Sub-Segment | Key Trend |
| Online | Mobile-first platforms integrate real-time vehicle range, charger availability, and dynamic pricing. |
| Offline | Walk-up airport counters and corporate travel desks remain relevant for last-minute and managed bookings. |
Digital booking continues to capture share as operators invest in app-based experiences that address EV-specific customer needs, such as charger routing and range planning.
By Rental Duration
| Sub-Segment | Key Trend |
| Short-Term (1–7 Days) | Tourism and business travel drive the largest share of demand; airport locations dominate |
| Medium-Term (1–3 Months) | Project-based corporate assignments and relocation use cases sustain steady demand. |
| Long-Term/Subscription (3+ Months) | Urban car-replacement and ride-hailing driver partnerships make this the fastest-growing duration segment. |
Subscription-based models are reshaping the rental-duration mix, offering operators recurring revenue and higher fleet utilization compared to traditional daily rentals.
By Price Tier
| Sub-Segment | Key Trend |
| Budget/Economy | Price-sensitive leisure and ride-hailing segments drive the largest volume share. |
| Mid-Range | Corporate travelers and family tourists balance cost with comfort and range requirements. |
| Luxury/Premium | Experiential tourism and high-net-worth clientele fuel the fastest CAGR in this dimension |
Luxury electric rentals — featuring brands such as BMW iX, Mercedes EQS, and Porsche Taycan — are growing fastest as affluent travelers seek premium zero-emission experiences at destination resorts and urban luxury hotels.
By End-Use Purpose
| Sub-Segment | Key Trend |
| Airport Transport | Concentrated point-of-sale infrastructure investment makes airports the dominant end-use channel. |
| City/Urban Mobility | Municipal green zones and ride-hailing demand support growing urban rental penetration |
| Last-Mile Delivery | E-commerce logistics electrification drives the fastest CAGR as operators offer commercial EV rental options. |
| Tourism/Road Trip | Scenic-route charging corridors enable long-distance EV tourism in North America and Europe. |
Airport-based rentals maintain the largest share due to infrastructure concentration and high traveler volumes, while last-mile delivery represents a nascent but rapidly accelerating commercial application.