EV Charging Station Market (2026 - 2035)

EV Charging Station Market Research Report By Charger Type (DC Fast Charging, Level 2 AC Charging, Level 1 AC Charging), By Application (Commercial, Residential, Public Transit), By Ownership Model (Operator-Owned (CPO), Site-Host Owned, Utility-Owned), By Connector Standard (CCS (Combined Charging System), NACS (North American Charging Standard), CHAdeMO, Type 2 (IEC 62196), GB/T (China)) and By Regional (North America, Europe, South America, Asia Pacific, Middle East and Africa) - Industry Forecast to 2035
ID: MRFR/AT/3958-CR
100 Pages
Triveni Bhoyar, Swapnil Palwe
Last Updated: July 23, 2026
EV Charging Station Market
Market Size
Forecast Period2026-2035
CAGR (2026-2035)14.1%
2025 Market SizeUSD 25.5 Billion
2035 Market SizeUSD 95.2 Billion
Key Players
Tesla
ChargePoint
ABB E-Mobility
Shell Recharge
BP Pulse
Star Charge
Opportunities
  • Vehicle-to-Grid (V2G) Revenue Stacks
  • Charging-as-a-Service for Commercial Fleets
  • Emerging-Market Greenfield Deployment

EV Charging Station Market Summary

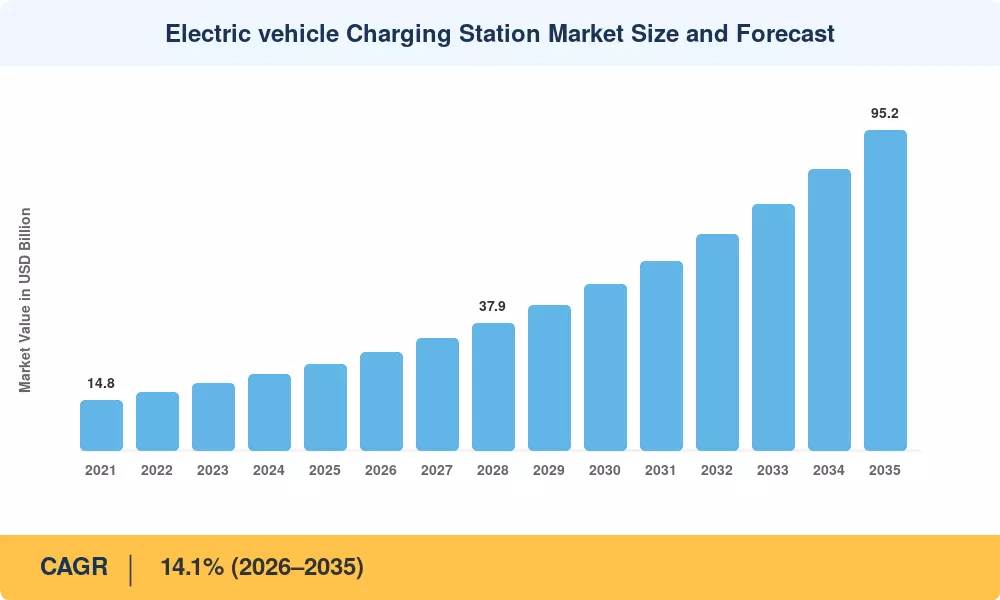
The global EV Charging Station Market reached an estimated USD 25.5 billion in 2025 and is projected to grow from USD 29.1 billion in 2026 to USD 95.2 billion by 2035, expanding at a CAGR of 14.1% during 2026–2035. Two forces are compressing deployment timelines across continents: the European Union's Alternative Fuels Infrastructure Regulation (AFIR), which mandates charging pools every 60 km along TEN-T corridors by 2026 [1], and the United States' National Electric Vehicle Infrastructure (NEVI) Formula Program, which allocated USD 7.5 billion for a national build-out through 2030 [2]. Together, these policies anchor a decade of sustained capital inflows into the EV Charging Station Market.

There is a significant change in the technological mix. Early adopters' slow AC Level 1 devices are being replaced with networked Level 2 and high-power DC systems that can deliver 150–350 kW. According to BloombergNEF, there will be more than 4.5 million public chargers installed worldwide by the end of 2024. However, the ratio of EVs to public chargers is still close to 10:1 in most areas, which is far higher than the IEA's proposed 6:1 target [3]. It will take infrastructure investments totaling more than USD 250 billion through 2035 to close that gap.

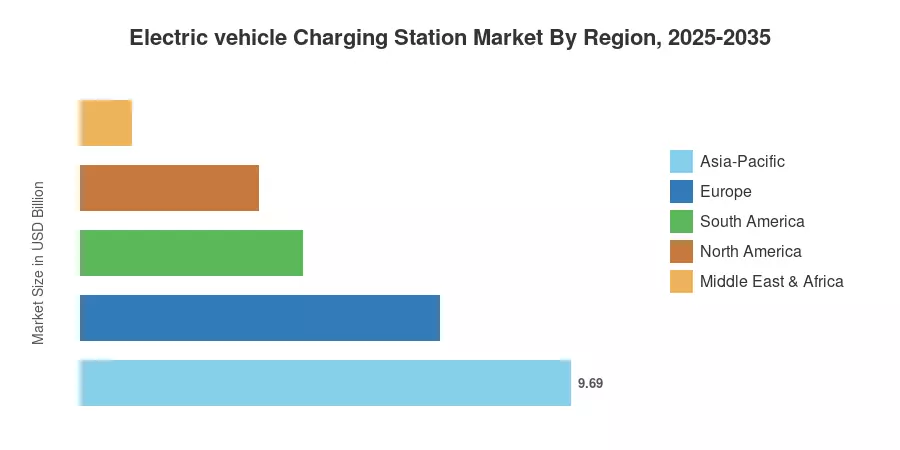
China's installed base of more than 3 million public chargers drives Asia-Pacific's dominance in the EV charging station market, accounting for about 38% of global revenue [4]. At 15.6%, the region also has the fastest predicted CAGR. Europe has the second-largest proportion, at about 28%, thanks to national subsidy programs in Germany, France, and the Netherlands as well as AFIR mandates. About 26% of the total is in North America, where deployment is accelerated by the Inflation Reduction Act tax credits and the NEVI program. Through 2035, the EV Charging Station Market is expected to continue to be one of the most capital-intensive verticals in the larger mobility transformation as fleet electrification increases across commercial, residential, and transit segments.


Key Report Takeaways

• By Charger Type

  • DC fast charging holds approximately 42% of EV Charging Station Market revenue, reflecting premium unit costs and growing highway-corridor demand.
  • Level 2 AC charging is the fastest-growing segment by installed unit count, expanding at a CAGR of 16.3% through 2035.
  • Level 1 charging accounts for less than USD 1.2 billion in annual revenue, primarily constrained to residential overnight use.

• By Application

  • Commercial applications command the largest revenue share at 51%, driven by fleet depots, retail destinations, and workplace installations.
  • Residential charging is forecast to reach USD 28.4 billion by 2035 as home EV penetration climbs.

• By Region

  • Asia-Pacific leads the EV Charging Station Market with a 38% share, anchored by China's aggressive subsidy structure.
  • North America is projected to grow at a 13.8% CAGR through 2035 as NEVI-funded corridors come online.
  • Europe contributes approximately USD 7.1 billion to the 2025 total, with AFIR enforcement tightening deployment deadlines.


EV Charging Station Market Size and Forecast (2021–2035)

Market size estimates draw on a triangulated methodology combining bottom-up unit shipment data from charging equipment OEMs, top-down revenue benchmarks from publicly listed charge-point operators, and regulatory spending commitments tracked across 40+ national programs. Historical figures (2021–2024) reflect verified deployment data; 2025 is the base-year estimate; and 2026–2035 values are forecast under the 14.1% CAGR scenario.
Electric vehicle Charging Station Market Size and Forecast
Our Impact
Enabled $4.3B Revenue Impact for Fortune 500 and Leading Multinationals
Partnering with 2000+ Global Organizations Each Year
30K+ Citations by Top-Tier Firms in the Industry

Driver Impact Analysis

Driver ~% Impact on CAGR Geographic Relevance Impact Timeline
Government subsidies & mandates 25–30 Global Short-term (≤2 yr)
Rising EV sales volumes 20–25 Global Medium-term (2–4 yr)
Utility grid modernization 10–15 North America, Europe Medium-term (2–4 yr)
Fleet electrification mandates 10–15 Europe, North America Medium-term (2–4 yr)
Real-estate & retail co-investment 5–10 Global Short-term (≤2 yr)
Battery cost decline enabling longer range 5–8 Global Long-term (≥4 yr)
V2G and bidirectional charging value stacks 3–5 Europe, Asia-Pacific Long-term (≥4 yr)


Government Subsidies and Infrastructure Mandates

Regulatory catalysts are the single largest growth lever for the EV Charging Station Market. The EU's AFIR requires member states to provide at least 1.3 kW of publicly accessible DC charging capacity for every battery-electric vehicle registered by 2025, scaling to 2.0 kW by 2030 [1]. In the US, the Bipartisan Infrastructure Law earmarked USD 7.5 billion specifically for EV charging under the NEVI program, while the Inflation Reduction Act extended a 30% Alternative Fuel Vehicle Refueling Property Tax Credit (Section 30C) through 2032, capping at USD 100,000 per commercial installation [2]. China's State Council issued a directive in mid-2023 targeting 6.36 million public and private charge points by 2025, backed by provincial subsidies averaging CNY 300–600 per kW [4].

Rising EV Sales Volumes

Global battery-electric and plug-in hybrid vehicle sales exceeded 17 million units in 2024, up 22% year-on-year, according to IEA Global EV Outlook data [3]. Each incremental EV sale generates recurring charging-infrastructure demand — roughly 0.5 public charge points and 0.8 private charge points per vehicle over the vehicle's lifetime, per BloombergNEF modelling [8]. As automakers like Volkswagen, Hyundai-Kia, and BYD expand affordable EV line-ups below USD 25,000, the addressable charger market widens substantially.

Utility Grid Modernization

Electricity distributors increasingly view charging stations as grid-edge assets. The US Department of Energy's Grid Deployment Office awarded USD 3.5 billion in 2024 for smart grid upgrades explicitly tied to EV load integration [5]. European DSOs are piloting dynamic tariff structures that reward off-peak charging, creating revenue-sharing models between utilities and charge-point operators. These investments reduce grid-upgrade bottlenecks that historically delayed station permitting by 12–18 months.

Fleet Electrification Mandates

California's Advanced Clean Fleets Rule requires medium- and heavy-duty fleets to transition to zero-emission vehicles starting in 2026, with full fleet conversion by 2042 [6]. The EU's CO₂ emission standards for heavy-duty vehicles mandate a 45% reduction by 2030, effectively forcing logistics operators to deploy depot-based charging infrastructure at scale. These mandates create captive demand for high-power DC stations in the EV Charging Station Market, particularly in the 150–350 kW range.


Restraints Impact Analysis

Restraint impact percentages follow the same directional methodology described in Section 4 and are not directly subtracted from the headline CAGR.

Restraint ~% Impact on CAGR Geographic Relevance Impact Timeline
Grid capacity and interconnection delays –15 to –20 North America, Europe Short-term (≤2 yr)
High upfront capital costs –10 to –15 Global Medium-term (2–4 yr)
Interoperability and standards fragmentation –5 to –10 Global Medium-term (2–4 yr)
Low utilization rates at public stations –5 to –8 North America, Europe Short-term (≤2 yr)
Permitting and land-use complexity –3 to –5 North America Short-term (≤2 yr)


Grid Capacity and Interconnection Delays

Installing a single 350 kW DC fast charger places electrical demand equivalent to roughly 70 average US homes. Utility interconnection timelines in the United States average 18–24 months for sites requiring transformer upgrades, and some California jurisdictions report waits exceeding 36 months [10]. This bottleneck directly constrains the pace at which the EV Charging Station Market can absorb new installations. European grid operators face similar congestion in urban centers where aging low-voltage networks resist high-power loads without costly reinforcement.

High Upfront Capital Costs

A fully installed dual-port 150 kW DC fast charging station costs between USD 100,000 and USD 180,000, while 350 kW systems can exceed USD 250,000 including civil works, permitting, and grid connection fees [11]. Payback periods of 7–10 years at current utilization rates deter independent investors. Although subsidies offset 30–50% of these costs in key markets, operators in regions without government support face unsustainable unit economics.

Low Utilization Rates

Average utilization at public DC fast chargers in the United States hovered near 15–20% during 2024, according to the National Renewable Energy Laboratory [13]. Low throughput compresses per-session revenues, extending breakeven timelines and discouraging private-sector expansion. Charge-point operators must balance network density — necessary for consumer confidence — against the financial drag of underutilized assets, a tension that continues to weigh on the EV Charging Station Market's growth trajectory.


EV Charging Station Market Opportunities

Vehicle-to-Grid (V2G) Revenue Stacks

Bidirectional charging enables electric vehicles to function as mobile energy storage, transforming them from passive loads into grid-responsive assets. The global V2G market is valued at approximately USD 2.3 billion in 2026 and is projected to reach USD 5.8 billion by 2036, representing a CAGR of 9.7% as fleets monetize frequency regulation and demand-response services [1.3.1].


Charging-as-a-Service for Commercial Fleets

Fleet operators increasingly prefer "Charging-as-a-Service" models that bundle hardware, software, energy procurement, and maintenance into a single, predictable monthly fee. This approach de-risks fleet electrification, enabling logistics companies to scale operations. With global electric car sales projected to reach 23 million units in 2026—nearly 28% of the global market—the recurring-revenue potential for charging operators is expanding rapidly

.

Emerging-Market Greenfield Deployment

Emerging markets are prioritizing infrastructure to support decarbonization. India’s PM E-DRIVE scheme, active through March 2026, allocates ₹2,000 crore specifically for public charging infrastructure, supporting the installation of approximately 72,300 new public chargers nationwide. These policy frameworks provide significant subsidies for upstream infrastructure, creating high-potential greenfield opportunities for first-movers to secure prime highway and urban transit locations.


Data Monetization and Energy Analytics

Connected charging stations generate granular data regarding driver behavior and grid-load patterns. By utilizing advanced analytics and dynamic pricing engines, operators can optimize station throughput; with global fast-charger market share reaching 51.7% in 2026, data-driven management is essential for balancing network density. Anonymized grid-analytics packages provide valuable insights to municipal planners, creating a secondary revenue stream that improves financial sustainability.

Retail and Hospitality Co-Location

Shopping centers, hotels, and restaurant chains are embedding EV chargers as amenities to extend dwell time and increase per-visit spending. Industry surveys indicate that EV drivers spend 20–30 minutes longer and 10–15% more per visit at retail locations with on-site charging, making co-location a compelling value proposition for both property owners and CPOs [7].


EV Charging Station Market Future Outlook

AI-Optimized Charging Networks

Machine-learning algorithms are increasingly essential for managing complex charging ecosystems. AI-driven demand management platforms can improve load forecasting accuracy by 20–40%. By optimizing supply-side generation and real-time balancing, these intelligent systems can reduce peak capacity costs by 15–25% [1.1.2]. Operators integrating these technologies gain significant structural advantages through improved efficiency and grid-load flexibility.


Megawatt Charging and Heavy-Duty Electrification

Heavy-duty vehicle electrification depends on the Megawatt Charging System (MCS) standard, which supports power levels up to 3.75 MW. The HDV-E project, a significant European endeavor, has won a €70.3 million EU grant to install roughly 330 megawatt-level charging stations at 55 key locations throughout nine nations by 2028, laying the groundwork for dependable, long-distance freight electrification.


Platform Economics and CPO Consolidation

Large-scale platforms are favored by operational efficiency, which is causing the charging environment to consolidate. To meet the anticipated demand, efficient infrastructure management and standardized roaming and payment protocols are essential. For example, national policies now mandate the coordinated deployment of thousands of public charging ports annually in order to accommodate millions more zero-emission vehicles on the road by 2040.


ESG Reporting and Carbon-Credit Integration

Verifiable renewable energy charging is becoming a top priority for corporate fleets in order to comply with Scope 2 and Scope 3 emission reporting regulations [1.5.1]. Businesses can meet stringent EU CSRD and SEC climate standards by using charging networks that use real-time data for carbon accounting [1.5.1]. As businesses actively invest in renewable energy certificates to meet sustainability objectives, this capability puts operators in a position to profit.


EV Charging Station Market Segmentation

By Charger Type

Segment Key Metric Primary Demand Driver
DC Fast Charging 42% revenue share (2025) Highway corridors, fleet depots
Level 2 AC Charging CAGR 16.3% Workplace, retail, residential
Level 1 AC Charging USD 1.2 B (2025) Residential overnight use


DC fast charging captures the largest revenue slice of the EV Charging Station Market because hardware costs per unit are 5–10× higher than Level 2 systems and high-power stations attract premium per-kWh pricing. Highway networks, fleet depots, and travel centers dominate deployments, with 150–350 kW units now standard for new installations.

Level 2 AC charging, while lower in per-unit revenue, is the volume leader. Workplace and retail installations are scaling rapidly as property managers recognize that mid-power charging aligns with natural dwell times of 2–4 hours. Government programs such as the UK OZEV Workplace Charging Scheme subsidize up to 75% of installation costs, further accelerating adoption.

By Application

Segment Key Metric Primary Demand Driver
Commercial 51% revenue share (2025) Fleet depots, retail, hospitality
Residential USD 10.4 B (2025) Home wallbox installations
Public Transit CAGR 17.8% E-bus depot electrification


Commercial charging dominates the EV Charging Station Market because fleet operators, retail chains, and hospitality groups deploy multi-unit stations with higher aggregate revenue per site. Residential charging is growing steadily but generates lower per-unit revenue due to the prevalence of sub-11 kW home wallboxes. Public transit charging is the fastest-growing application segment, driven by municipal e-bus mandates in cities like Shenzhen, Santiago, and London.

By Ownership Model

Segment Key Metric Primary Demand Driver
Operator-Owned (CPO) 58% revenue share (2025) Networked public charging
Site-Host Owned CAGR 15.9% Retail and workplace self-investment
Utility-Owned USD 3.2 B (2025) Rate-base infrastructure programs


Charge-point operators control the majority of the EV Charging Station Market through networked public and semi-public stations. Site-host ownership is growing as large retailers and property groups prefer direct hardware ownership paired with third-party software management. Utility-owned charging programs, permitted in states like Maryland and New York, are emerging as a complementary deployment channel.


Regional Market Share Analysis

Region Key Metric Primary Investment Themes
Asia-Pacific 38% revenue share (2025) State-led deployment, domestic OEM ecosystem
Europe USD 7.1 B (2025) AFIR compliance, cross-border interoperability
North America CAGR 13.8% NEVI build-out, IRA tax credits
South America CAGR 17.2% Greenfield expansion, utility-led programs
Middle East & Africa USD 1.0 B (2025) Smart-city projects, tourism corridors
Total USD 25.5 B (2025) —

The EV Charging Station Market displays pronounced regional variation shaped by EV adoption rates, grid maturity, and policy intensity. Asia-Pacific leads on both installed base and revenue share; Europe and North America trail but are accelerating through coordinated regulatory programs.


Asia-Pacific

Country Key Metric Key Driver
China 68% of regional share State Council charging directive [4]
India CAGR 19.4% FAME-III subsidy scheme [16]
Japan USD 1.1 B (2025) CHAdeMO legacy and 150 kW upgrades
South Korea CAGR 16.8% K-EV100 corporate fleet mandate
Australia USD 0.4 B (2025) National EV Strategy highway corridors


China's dominance in the Asia-Pacific EV Charging Station Market reflects over a decade of centralized planning. State Grid Corporation and private operators such as Star Charge and TELD collectively operate networks exceeding 3 million units. India represents the fastest ramp among large economies, with the government targeting 46,000 public chargers by 2026 under FAME-III, while Japan focuses on upgrading its existing CHAdeMO network to higher power levels.

Europe

Country Key Metric Key Driver
Germany 27% of regional share Deutschlandnetz highway network [17]
France CAGR 15.1% EUR 2 B public charging plan
Netherlands USD 0.9 B (2025) Highest charger-to-EV ratio in EU
United Kingdom CAGR 14.5% OZEV workplace charging scheme
Norway USD 0.5 B (2025) 90%+ BEV new-car share


Germany anchors European growth through its Deutschlandnetz initiative, which will deploy roughly 8,800 high-power charging points across autobahn service areas by 2026 [17]. France committed EUR 2 billion to reach 400,000 public charge points by 2030, and the Netherlands already operates the densest public network in the EU, supporting the EV Charging Station Market's interoperability benchmarks.

North America

Country Key Metric Key Driver
United States 82% of regional share NEVI + IRA Section 30C credits [2]
Canada CAGR 14.2% Zero-Emission Vehicle Infrastructure Program
Mexico USD 0.3 B (2025) Nearshoring-driven fleet demand


The United States accounts for the vast majority of North American revenue, buoyed by USD 7.5 billion in federal NEVI allocations flowing through state transportation departments. Canada's ZEVIP has funded over 43,000 charger installations through 2024, while Mexico's nascent EV Charging Station Market benefits from cross-border logistics electrification tied to nearshoring trends.

South America

Country Key Metric Key Driver
Brazil 62% of regional share ANEEL Resolution 1,000 [16]
Chile CAGR 18.5% Mining-fleet electrification
Colombia USD 0.1 B (2025) BogotĂĄ e-bus network expansion


Brazil leads South American deployment after ANEEL mandated utility participation in public charging, triggering investment commitments from Enel, CPFL, and EDP. Chile's mining sector is piloting high-power charging systems for electric haul trucks, creating an industrial niche within the broader EV Charging Station Market.

Middle East & Africa

Country Key Metric Key Driver
UAE 44% of regional share Dubai Green Mobility Strategy
Saudi Arabia CAGR 22.1% Vision 2030 smart-city rollouts
South Africa USD 0.1 B (2025) Eskom grid reform and IPP entry


The UAE leads MEA deployments, with DEWA and ADNOC Distribution installing chargers across Abu Dhabi and Dubai as part of broader smart-city agendas. Saudi Arabia's rapid CAGR reflects greenfield build-out under NEOM and other giga-projects that embed EV infrastructure from the design phase.


Electric vehicle Charging Station Market By Region, 2025-2035

Competitive Benchmarking

The EV Charging Station Market is moderately fragmented, with an estimated HHI below 600 and the top five players collectively holding approximately 28–33% of global revenue. Competition spans hardware manufacturers, software-platform providers, and vertically integrated charge-point operators, creating a multi-layered competitive dynamic.

Company Est. Revenue Share Range Key Offerings Strategic Positioning
Tesla (Supercharger/NACS) ~7–10% Proprietary DC network, NACS standard Vertically integrated, network-effect moat
ChargePoint ~5–8% Cloud-connected L2/DCFC hardware, software Open-platform leader, North America focus
ABB E-Mobility ~5–7% Terra HP/HPC 360 kW DC chargers Technology leader, global OEM partnerships
Shell Recharge ~4–6% Retail co-located DC fast charging Energy-major scale, fuel-retail conversion
BP Pulse ~3–5% Gigahub urban charging, fleet solutions Fossil-to-EV transition strategy
Star Charge (Wanbang) ~4–6% AC/DC hardware, China domestic network China's largest private CPO by connectors
Schneider Electric ~3–5% EVlink, EcoStruxure energy management Building-integration, behind-the-meter
EVgo ~2–4% Metro DC fast-charging, fleet hubs US urban network, 100% renewable energy
Blink Charging ~2–3% L2/DCFC, owner-operator model Distributed small-site network
Wallbox ~2–3% Pulsar Plus, Quasar bidirectional Residential/prosumer, V2G technology


Recent News & Developments


  • PowerX (July, 2026)—The company launched a partnership with the Premium Charging Alliance (PCA), allowing Porsche, Audi, and Volkswagen EV owners roaming access to PowerX charging stations.


  • Milence (May 2026)—The heavy-duty charging joint venture between Volvo Group, Traton Group, and Daimler Truck secured €120 million in additional financing to accelerate its European charging hub network expansion.


  • BYD (April, 2026)—BYD officially launched its "Flash Charging" network in Europe, committing to deploy 3,000 ultra-fast charging stations across the continent within the next 12 months.


EV Charging Station Market Report Scope

Parameter Detail
Market Scope Global EV Charging Station Market — hardware, software, and services
Study Period 2021–2035
CAGR 14.1% (2026–2035)
Base Year Value USD 25.5 Billion (2025)
Forecast Endpoint USD 95.2 Billion (2035)
Fastest Growing Segment Public Transit Charging (CAGR 17.8%)
Companies Profiled 10
Valuation Currency USD (constant 2025 dollars)


FAQs

What differentiates a DC fast charging station 150kW 350kW unit from lower-power alternatives for fleet operators?
Fleet operators choose 150–350 kW DC units because they reduce per-vehicle dwell time to 15–30 minutes, enabling tighter route scheduling. Lower-power chargers cannot support high-throughput depot operations [11].
How should commercial property owners evaluate ROI before installing EV chargers?
Owners should model utilization at 15–20% in year one, factor in applicable tax credits (up to USD 100,000 under IRA Section 30C), and project revenue from per-kWh fees plus increased foot traffic [2].
What role does the OCPP protocol EV charging station interoperability standard play in vendor selection?
OCPP 2.0.1 ensures hardware-agnostic backend connectivity, preventing vendor lock-in. Buyers should require OCPP certification to maintain flexibility across software upgrades and network-roaming partnerships [12].
How do bidirectional chargers create additional revenue for station operators?
V2G-capable chargers enable operators to sell stored EV energy back to the grid during peak-demand windows, generating EUR 1,200–2,000 per vehicle annually in European pilot programs [9].
What permitting risks should investors anticipate when funding EV charging projects in the United States?
Utility interconnection timelines average 18–24 months and can exceed 36 months in congested jurisdictions. Investors should budget 12–18 months of pre-revenue carrying costs into financial models [10].
How does battery-buffered charging reduce infrastructure costs at grid-constrained sites?
Integrated battery storage allows stations to charge from the grid at off-peak rates and dispense at high power without requiring costly transformer upgrades, cutting civil-works costs by 30–40% [25].
What cybersecurity standards apply to networked EV charging stations?
ISO 15118 and IEC 63110 govern secure communication between vehicles and chargers. Operators should also implement SOC 2 Type II compliance for backend cloud systems to protect payment and user data [12].    
Author
Author
Author Profile
Triveni Bhoyar LinkedIn
Senior Research Analyst
Triveni Bhoyar has over 5 years of experience in the market research industry, specializing in the Automotive and Aerospace & Defense sectors. She has contributed to 200+ reports, including numerous custom projects for leading global companies, delivering solutions to complex business challenges. Renowned for her ability to generate valuable insights, Triveni excels in addressing unique market dynamics with precision and depth. Her expertise spans market sizing, competitive intelligence, and trend analysis, enabling clients to craft data-driven growth strategies. With strong analytical rigor and a client-centric approach, she plays a pivotal role in driving impactful, strategic decision-making.
Co-Author
Co-Author Profile
Swapnil Palwe LinkedIn
Team Lead - Research
With a technical background as Bachelor's in Mechanical Engineering, with MBA in Operations Management , Swapnil has 6+ years of experience in market research, consulting and analytics with the tasks of data mining, analysis, and project execution. He is the POC for our clients, for their consulting projects running under the Automotive/A&D domain. Swapnil has worked on major projects in verticals such as Aerospace & Defense, Automotive and many other domain projects. He has worked on projects for fortune 500 companies' syndicate and consulting projects along with several government projects.

Research Approach


Secondary Research

The secondary research process involved comprehensive analysis of regulatory databases, technical standards publications, energy sector reports, and authoritative transportation and environmental organizations. Key sources included the US Department of Energy (DOE) Alternative Fuels Data Center, US Department of Transportation (DOT) Federal Highway Administration, Environmental Protection Agency (EPA) Transportation and Climate Division, European Alternative Fuels Observatory (EAFO), International Energy Agency (IEA) Global EV Outlook and Energy Technology Systems Analysis Programme, International Council on Clean Transportation (ICCT) Global EV Market Analysis, California Air Resources Board (CARB) Zero-Emission Vehicle Standards Database, European Commission Directorate-General for Mobility and Transport (DG MOVE), China Ministry of Industry and Information Technology (MIIT) New Energy Vehicle Infrastructure Division, Japan Agency for Natural Resources and Energy (ANRE), SAE International (Society of Automotive Engineers) Standards Database, International Electrotechnical Commission (IEC) 61851 and 62196 Standards, Institute of Electrical and Electronics Engineers (IEEE) 2030.5 Smart Grid Standards, CharIN e.V. (Charging Interface Initiative) Global Charging Database, Electric Power Research Institute (EPRI) Transportation Electrification Research, BloombergNEF (BNEF) Electric Vehicle Outlook, Wood Mackenzie Electric Vehicle Service reports, and national transport ministry statistical bulletins from key EV markets.

Statistics on EV registrations, data on the deployment of charging infrastructure, standards and interoperability protocols, grid integration studies, utility tariff structures, and policy landscape analyses for inductive/wireless charging technologies, AC charging stations, and DC fast charging systems were all gathered from these sources.


Primary Research

In order to gather both qualitative and quantitative insights, supply-side and demand-side stakeholders were interviewed during the primary research phase. CEOs, CTOs, VPs of Infrastructure Development, regulatory affairs directors, and heads of grid integration from manufacturers of charging stations, charge point operators (CPOs), and original equipment manufacturers (OEMs) were among the supply-side sources. Demand-side sources included government transport electrification planners from local, state, and federal agencies; fleet electrification managers; heads of automobile OEM charging infrastructure; sustainability directors for real estate development; and utility demand-side management leads. Primary research confirmed product development roadmaps for high-power charging (350kW+) and bi-directional charging capabilities, validated market segmentation across charging types (AC, DC, and inductive), and collected information on pricing models, interoperability standards adoption, utilization rates, and grid interconnection challenges.

Primary Respondent Breakdown:

• By Designation: C-level Executives (32%), Director Level (30%), Others (38%)

• By Region: North America (32%), Europe (30%), Asia-Pacific (28%), Rest of World (10%)


Market Size Estimation

Infrastructure deployment mapping and utilization-based revenue analysis were used to determine the global market valuation. The methods included:

• More than 50 major manufacturers and charging station operators in North America, Europe, Asia-Pacific, Latin America, and the Middle East have been identified.

• Product mapping for DC Fast Charging (CCS, CHAdeMO, Tesla Supercharger/NACS), AC Level 1/Level 2 charging stations, and inductive charging systems

•Examination of yearly earnings for EV charging hardware, network software, and installation services that have been reported and projected

• Manufacturers and significant CPOs that account for 75–80% of the installed charging point capacity worldwide in 2024

• To determine segment-specific valuations for residential, commercial, and public fast-charging deployments, extrapolation is done using top-down (utility EV program spending and manufacturer revenue validation) and bottom-up (installed base of charging points × utilization rates × average revenue per charging session by country) approaches.

Download Free Sample

Kindly complete the form below to receive a free sample of this Report

Download PDF ×

We do not share your information with anyone. However, we may send you emails based on your report interest from time to time. You may contact us at any time to opt-out.
















