Electronic Warfare Market (2025 - 2035)

Global Electronic Warfare Market Research Report: Information By Capability (Electronic Attack, Electronic Protection, Electronic Support), By Platform (Air, Sea, Land, Space), By Equipment (Jammer Systems, Radar Warning Receivers, Counter-UAS EW Suites, Other Equipment), By End User (Air Force, Navy, Army), By Fit (OEM (New-Build), Retrofit / Upgrades) - Forecast to 2035
ID: MRFR/AD/1023-CR
110 Pages
Shubham Munde, Swapnil Palwe
Last Updated: July 12, 2026
Electronic Warfare Market
Market Size
Forecast Period2025-2035
CAGR (2025-2035)9.45%
2025 Market SizeUSD 15.12 Billion
2035 Market SizeUSD 37.30 Billion
Key Players
BAE Systems
L3Harris Technologies
Northrop Grumman
RTX
Leonardo S.p.A.
Elbit Systems
Opportunities
  • Modular Open-Systems Architecture (MOSA) Adoption
  • Emerging-Market Indigenous EW Programs
  • EW-as-a-Service and Managed-Threat-Library Models

Electronic Warfare Market Summary

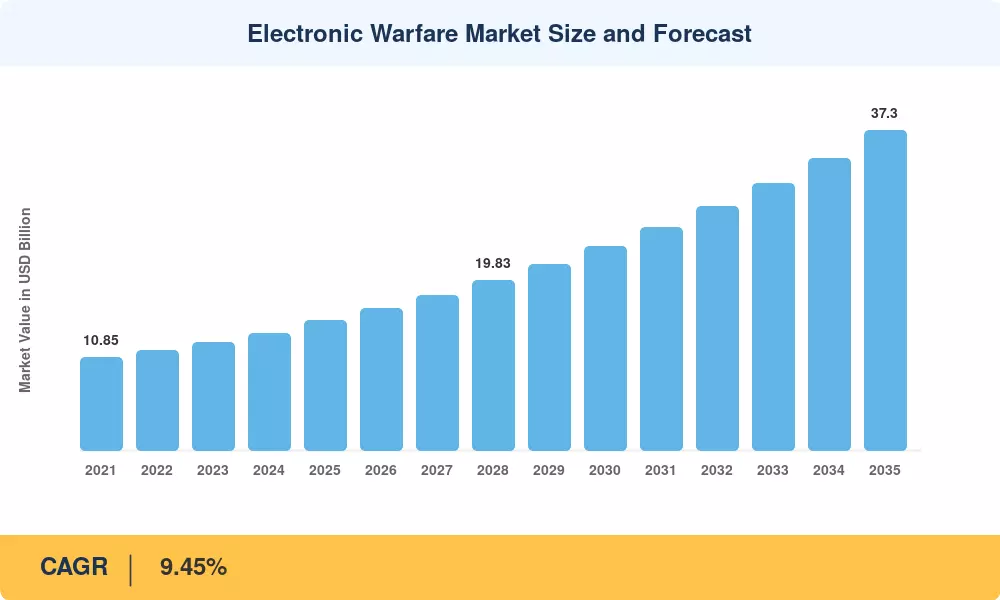
The Electronic Warfare Market reached USD 15.12 billion in 2025 and is projected to grow from USD 16.55 billion in 2026 to USD 37.30 billion by 2035, registering a 9.45% CAGR over the forecast period. Two catalysts anchor this trajectory: the U.S. Department of Defense allocated over USD 5.5 billion to electronic warfare programs in its FY 2025 budget request [1], and NATO's 2024 Vilnius Summit communiqué explicitly elevated electromagnetic spectrum operations to a tier-one warfighting priority [2]. These policy commitments create durable demand floors that insulate the Electronic Warfare Market from the cyclical defense-budget pressures facing more discretionary programs.

Procurement patterns are changing as a result of a technological turning point. Software-defined, cognitive architectures based on machine-learning signal classifiers and gallium-nitride (GaN) amplifier modules are replacing physically directed jammers and legacy analog receivers. A life-cycle cost estimate of USD 6.4 billion is associated with the U.S. Navy's Next Generation Jammer program alone [3], indicating the extent of platform-level change that is taking place. Operators with limited resources can obtain near-peer capabilities without completely replacing their platforms thanks to retrofit initiatives, which shorten integration timelines to 18–24 months.

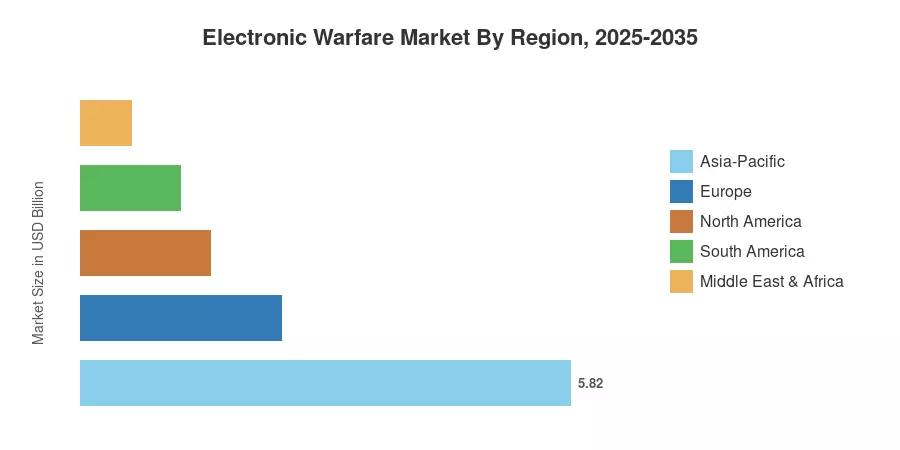
Due to India's domestic defense corridor initiatives and China's increasing investments in integrated electronic attack suites, Asia-Pacific accounts for around 38.5% of the electronic warfare market. Driven by Pentagon modernization objectives and classified special-access initiatives, North America comes in second with a 37.2% share and the fastest regional CAGR of 10.20%. Europe makes up 15.8% of the total, and spending is increasing around frameworks for pan-EU and Franco-German electronic defense cooperation. As drone proliferation and spectrum congestion increase the operational stakes for all services, the Electronic Warfare Market is expected to experience continuous double-digit regional growth pockets.


Key Report Takeaways

• By Capability

  • Electronic Protection held a 37.8% share of the Electronic Warfare Market in 2025, reflecting sustained spending on self-protection suites across fighter and rotorcraft fleets.
  • Electronic Attack is the fastest-expanding capability segment, advancing at a 9.92% CAGR through 2035 as offensive stand-in and stand-off missions gain operational priority.

• By Platform

  • Air-based systems led the Electronic Warfare Market with approximately USD 5.30 billion in revenue during 2025, anchored by fighter-pod and escort-jammer procurement cycles.
  • Space-based electronic warfare platforms are projected to record a 10.10% CAGR, the highest among all platform segments, as orbital sensing and denial capabilities attract dedicated budget lines.


• By Equipment

  • Counter-UAS electronic warfare suites are growing at a 9.72% CAGR, outpacing legacy equipment categories amid the global drone-threat surge.

• By Region

  • North America is on track to post a 10.20% CAGR in the Electronic Warfare Market through 2035.
  • Asia-Pacific maintains the largest regional revenue pool, valued at roughly USD 5.82 billion in 2025.


Electronic Warfare Market Size and Forecast (2021–2035)

Market Research Future's sizing methodology triangulates top-down government budget allocations, bottom-up OEM contract values, and independent trade-source benchmarking to produce consensus-grade estimates. Historical data (2021–2024) draw on audited defense-industry revenue filings and congressional budget justification documents; forecast values (2026–2035) apply a composite CAGR validated against program-of-record timelines and procurement pipeline visibility.
Electronic Warfare Market Size and Forecast
Our Impact
Enabled $4.3B Revenue Impact for Fortune 500 and Leading Multinationals
Partnering with 2000+ Global Organizations Each Year
30K+ Citations by Top-Tier Firms in the Industry

Driver Impact Analysis

Driver ~% Impact on CAGR Geographic Relevance Impact Timeline
Expanding counter-UAS mission requirements +1.6% Global Short-term (≤2 yr)
GaN amplifier retrofit cycles +1.4% North America, Europe Medium-term (2–4 yr)
Cognitive / AI-enabled threat libraries +1.3% North America, Asia-Pacific Medium-term (2–4 yr)
Space-based EW constellation funding +1.1% North America Long-term (≥4 yr)
NATO spectrum-superiority mandates +0.9% Europe, North America Short-term (≤2 yr)
Indo-Pacific force-posture expansion +0.8% Asia-Pacific Medium-term (2–4 yr)
Multi-domain command integration +0.7% Global Long-term (≥4 yr)


Expanding Counter-UAS Mission Requirements

The proliferation of low-cost commercial and military drones has made counter-unmanned aerial system missions the fastest-growing operational demand signal in the Electronic Warfare Market. The U.S. Army's Rapid Capabilities and Critical Technologies Office obligated over USD 800 million in FY 2024 for electronic-defeat solutions targeting Group 1–3 UAS threats [13]. Peer programs in the UK (ORCUS), France (PARADE), and Australia (Counter-UAS Task Force) mirror this urgency. The driver's short-term timeline reflects that many acquisitions bypass traditional milestone-based procurement in favor of rapid fielding authorities, compressing contract-to-delivery windows to 12–18 months.

GaN Amplifier Retrofit Cycles

Gallium-nitride power amplifiers deliver three to five times the power density of legacy gallium-arsenide modules, enabling pod-level upgrades that materially enhance effective radiated power without airframe modifications. The U.S. Air Force's ALQ-131 and ALQ-184 replacement programs, together worth an estimated USD 2.1 billion through 2030, are anchored on GaN insertion [8]. Budget-constrained air forces in Southeast Asia and the Middle East are also pursuing GaN retrofit pathways, extending this driver's geographic footprint beyond traditional NATO markets and sustaining medium-term demand in the Electronic Warfare Market.

Cognitive and AI-Enabled Threat Libraries

Machine-learning algorithms that classify, prioritize, and respond to novel emitters in real time represent the highest-value technology transition in the Electronic Warfare Market. DARPA's Behavioral Learning for Adaptive Electronic Warfare (BLADE) program demonstrated a 90% reduction in reaction time against previously uncatalogued threats during 2024 field tests [9]. AI-enabled threat libraries convert electronic warfare suites from pre-programmed reactive systems into adaptive platforms capable of autonomous countermeasure selection. This capability fundamentally alters the operational calculus for contested airspace penetration.

Space-Based EW Constellation Funding

The U.S. Space Development Agency's Tranche 2 architecture earmarks dedicated payloads for electromagnetic spectrum sensing from low-Earth orbit, with an estimated program value exceeding USD 3.2 billion through 2032 [10]. Space-based electronic warfare extends the detection and geolocation baseline from hundreds of kilometers to theater-wide coverage, creating demand for miniaturized, radiation-hardened receiver chains and wideband digital backends. This driver operates on a long-term timeline because orbital EW capabilities require multi-year integration, testing, and launch cadences that lag ground-based fielding by 3–5 years.


Restraints Impact Analysis

Restraint impact percentages are directional indicators of downward pressure on market momentum, derived from procurement-delay analysis and trade-barrier assessments. They do not net algebraically against driver impacts.

Restraint ~% Impact on CAGR Geographic Relevance Impact Timeline
Tightening export-control regimes (ITAR/EAR) –0.9% Global Long-term (≥4 yr)
Classification barriers limiting tech transfer –0.7% North America, Europe Medium-term (2–4 yr)
Supply-chain bottlenecks for RF microelectronics –0.6% Global Short-term (≤2 yr)
Spectrum-management regulatory fragmentation –0.5% Asia-Pacific, MEA Long-term (≥4 yr)
Extended certification and flight-test cycles –0.4% Europe Medium-term (2–4 yr)


Export-Control Regime Tightening

The International Traffic in Arms Regulations and Export Administration Regulations increasingly restrict the transfer of advanced electronic warfare sub-systems—particularly wideband digital receivers and cognitive-algorithm source code—to allied but non-Five Eyes partners. A 2024 Government Accountability Office report found that ITAR license processing times for EW-classified items averaged 87 days, up from 62 days in 2020 [15]. This elongation delays multinational co-development programs such as Tempest and GCAP, fragmenting what could otherwise be a unified transatlantic Electronic Warfare Market procurement pool. The restraint's long-term timeline reflects the structural nature of regulatory reform cycles.

RF Microelectronics Supply-Chain Bottlenecks

GaN-on-silicon-carbide wafer fabrication remains concentrated among a handful of foundries in the United States and Japan, with aggregate military-grade capacity estimated at fewer than 15,000 wafer starts per quarter [17]. Surging demand from 5G telecommunications and radar modernization programs competes directly for the same epitaxial growth capacity. Lead times for military-specification GaN monolithic microwave integrated circuits stretched to 52 weeks in late 2024, constraining Electronic Warfare Market OEMs' ability to fulfill retrofit contract schedules and pressuring near-term revenue recognition.


Electronic Warfare Market Opportunities

Modular Open-Systems Architecture (MOSA) Adoption

Pentagon acquisition directives now mandate MOSA compliance for all new EW programs of record, creating a multi-billion-dollar addressable opportunity for middleware and hardware vendors who design to open standards. Companies that deliver plug-and-play sensor-processing cards and software-defined waveform libraries compatible with MOSA frameworks will capture integration revenue traditionally locked inside proprietary prime-contractor ecosystems.


Emerging-Market Indigenous EW Programs

India's Defense Research and Development Organisation allocated USD 1.2 billion to indigenous electronic warfare development under the 2024–2029 defense plan [6]. Indonesia, Saudi Arabia, and Turkey are pursuing similar self-reliance mandates. These programs create partnership and licensed-production opportunities for Western and Israeli EW specialists willing to share technology within offset frameworks, expanding the Electronic Warfare Market beyond its traditional NATO-centric revenue base.

EW-as-a-Service and Managed-Threat-Library Models

Defense operators increasingly seek subscription-based threat-library updates and cloud-hosted mission-data-file management rather than purchasing static software loads. This shift toward recurring-revenue models mirrors the broader defense-SaaS trend. It could generate annual service-contract streams worth 15–20% of initial platform sale value, improving vendor margin profiles across the Electronic Warfare Market.

Directed-Energy and Electronic Warfare Convergence

High-power microwave weapons and electronic attack systems share radio frequency generation, power conditioning, and beam-steering subsystems. Programs like the joint Air Force Research Laboratory and Office of Naval Research HiJENKS initiative aim to integrate advanced non-kinetic directed-energy payloads into airborne platforms and weapon pods, creating a dual-use upgrade pathway that expands the serviceable market without requiring wholly new platform allocations.

Counter-Swarm Electronic Warfare Solutions

The asymmetric threat posed by autonomous drone swarms cannot be economically addressed by kinetic remedies alone. Wide-area radio frequency denial, GPS spoofing grids, and protocol-level link disruption are electronic defeat strategies that offer per-engagement costs orders of magnitude lower than missile-based intercepts [13]. There is a greenfield opportunity in the land, naval, and fixed-site divisions of the electronic warfare market due to the demand for scalable counter-swarm EW systems.


Electronic Warfare Market Future Outlook

AI-Driven Autonomous Electronic Warfare Operations

Autonomous electronic warfare agents capable of detecting, classifying, and countering novel threats without human intervention are transitioning from laboratory demonstrations to operational fielding. Programs like DARPA’s Behavioral Learning for Adaptive Electronic Warfare (BLADE) initiative have pioneered algorithmic approaches to address uncatalogued threat emitters at machine speed. As a result, the Electronic Warfare Market is shifting procurement emphasis from traditional hardware-only architectures to adaptive algorithm development, cognitive processing frameworks, and long-term mission software contracts.

Platform-Agnostic and Distributed EW Architectures

The move toward modular, platform-agnostic electronic warfare suites—deployable across manned aircraft, unmanned systems, and ground vehicles using common hardware cards—will compress development costs and accelerate time-to-capability. The U.S. Army's Terrestrial Layer System and the Navy's Surface Electronic Warfare Improvement Program exemplify this shift [11]. Distributed architectures that network multiple emitters for cooperative jamming will multiply effective radiated power without proportional cost increases, reshaping the Electronic Warfare Market economics.

Electrification and Power-Budget Expansion

Next-generation combat assets are integrating high-output electrical architectures to support electronic warfare payloads that were previously constrained by available airframe power. This systemic push for better power management is central to major multi-year modernization efforts, such as the U.S. Department of Defense's $991 million global fleet modification program to deliver upgraded electronic warfare capabilities for the F-35 through 2032. Overcoming legacy power and thermal management constraints acts as a critical enabler, unlocking the integration of advanced electronic attack modes and active electronically scanned array (AESA) jamming lines onto tactical platforms.


Spectrum Governance and Electromagnetic Battle Management

As electromagnetic spectrum operations gain doctrinal parity with kinetic warfare, dedicated spectrum-management command centers and real-time electromagnetic battle-management systems will become standard force-structure elements. NATO's Electromagnetic Spectrum Operations doctrine, published in 2024, mandates theater-level spectrum coordination across all allied forces [2]. The resulting demand for battle-management software, spectrum-situational-awareness tools, and joint interoperability gateways will create a durable growth layer within the Electronic Warfare Market through 2035.


Electronic Warfare Market Segmentation

By Capability

Segment Key Metric Primary Demand Driver
Electronic Protection 37.8% share (2025) Self-protection suite procurement for fighter fleets
Electronic Attack CAGR 9.92% Offensive stand-off and stand-in mission growth
Electronic Support USD 3.85 Billion (2025) Signal-intelligence and threat-warning modernization


Electronic Protection dominates the Electronic Warfare Market by revenue share because every combat aircraft, warship, and armored vehicle fielded by modern militaries requires baseline self-protection against radar-guided threats. Procurement of missile-approach warning systems, RF countermeasure dispensers, and towed decoys sustains a broad, recurring revenue stream across airborne and naval platforms. Electronic Attack is gaining relative share as a stand-in jamming concept—where unmanned platforms penetrate contested airspace to disrupt adversary air defenses—transition from concept to funded program.

By Platform

Segment Key Metric Primary Demand Driver
Air USD 5.30 Billion (2025) Fighter-pod and escort-jammer programs
Sea 23.7% share (2025) Ship self-protection and fleet EW coordination
Land CAGR 9.15% Tactical ground-force EW and counter-UAS
Space CAGR 10.10% Orbital sensing and denial constellations


Air-based platforms anchor the Electronic Warfare Market because high-value tactical aircraft carry dedicated EW pods, integrated apertures, and expendable countermeasures that represent significant per-unit revenue. The Electronic Warfare Market is also experiencing strong demand in land-based systems as armies prioritize tactical EW for brigade-level formations following operational lessons from Ukraine, where ground-based electronic attack proved decisive in suppressing adversary drone operations.

By Equipment

Segment Key Metric Primary Demand Driver
Jammer Systems 42.3% share (2025) Active countermeasure demand across domains
Radar Warning Receivers USD 2.70 Billion (2025) Passive-detection fleet modernization
Counter-UAS EW Suites CAGR 9.72% Drone-threat neutralization urgency
Other Equipment 9.1% share (2025) Directed-energy, chaff/flare, decoy systems


By End User

Segment Key Metric Primary Demand Driver
Air Force 41.5% share (2025) Airborne EW pod and integrated-suite budgets
Navy CAGR 9.55% Ship electronic warfare suite upgrades
Army USD 2.95 Billion (2025) Ground-force tactical EW and C-UAS


By Fit

Segment Key Metric Primary Demand Driver
Retrofit / Upgrades 59.0% share (2025) GaN insertion and software-defined upgrades
OEM (New-Build) CAGR 9.05% Next-gen platform EW integration


Retrofit and upgrade programs dominate the Electronic Warfare Market because the global combat-aircraft fleet averages 25+ years of service life, and replacing entire platforms is cost-prohibitive for most operators. Slotting new GaN amplifiers, updated digital receivers, and refreshed threat libraries into existing pods delivers 80% of new-build capability at roughly 30% of the cost, making retrofit the default procurement mode for the majority of Electronic Warfare Market participants.


Regional Market Share Analysis

Region Key Metric Primary Investment Themes
North America CAGR 10.20% (2026–2035) Next-gen jammer delivery, cognitive EW, space-based sensing
Europe USD 2.39 Billion (2025) Tempest/GCAP integration, NATO interoperability upgrades
Asia-Pacific 38.5% revenue share (2025) Indigenous programs, Indo-Pacific posture, naval EW
South America CAGR 7.85% (2026–2035) Border-security modernization, light-force EW kits
Middle East & Africa USD 0.60 Billion (2025) Counter-UAS procurement, offset-driven tech transfer
Total USD 15.12 Billion (2025)

The Electronic Warfare Market exhibits pronounced regional concentration driven by defense-budget scale, threat proximity, and indigenous industrial capacity. Asia-Pacific's dominant position reflects China's rapid force modernization, while North America's fastest CAGR stems from the Pentagon's aggressive recapitalization of legacy electronic warfare inventories.


North America

Country Key Metric Key Driver
United States 88.4% of regional share Pentagon EW modernization mandates
Canada CAGR 8.90% CF-18/F-35 EW suite integration
Mexico USD 0.04 Billion (2025) Emerging border-surveillance EW needs


The United States anchors North American demand through programs such as the Next Generation Jammer (NGJ-MB/LB), the F-35's AN/ASQ-239 Block 4 upgrades, and classified airborne electronic attack initiatives managed by the Air Force's Big Safari office [1][3]. Canada's Electronic Warfare Market participation is scaling as the Royal Canadian Air Force integrates EW suites into its CF-188 successor platform. At the same time, Mexico's defense ministry has initiated preliminary procurement studies for fixed-site spectrum-monitoring systems along its northern border.

Europe

Country Key Metric Key Driver
Germany 22.6% of regional share FCAS / SCAF EW subsystem development
United Kingdom CAGR 9.15% Tempest EW architecture investment
France USD 0.37 Billion (2025) Rafale F5 electronic warfare upgrade
Italy CAGR 8.45% Leonardo EW export platform growth
Spain 5.8% of regional share Eurofighter Typhoon EW mid-life update
Nordic Countries CAGR 8.70% Arctic surveillance and Gripen EW pods
Russia USD 0.22 Billion (2025) Domestic Khibiny / Richag-AV production
Rest of Europe 8.3% of regional share Eastern-flank NATO EW hardening


European Electronic Warfare Market growth is underpinned by two parallel procurement streams: the Franco-German-Spanish Future Combat Air System, which embeds distributed EW as a core design feature, and the UK-Italy-Japan Global Combat Air Programme, whose EW subsystem contracts are expected to exceed USD 1.8 billion through 2032 [7]. Eastern NATO members are accelerating acquisitions of ground-based electronic warfare systems following lessons from the Ukraine conflict, widening the buyer base beyond Western European incumbents.

Asia-Pacific

Country Key Metric Key Driver
China 41.2% of regional share PLA electronic warfare force build-out
India CAGR 10.75% DRDO indigenous EW development
Japan USD 0.85 Billion (2025) GCAP EW integration and island-defense posture
South Korea CAGR 9.60% KF-21 Boramae EW suite fielding
ASEAN 8.4% of regional share Maritime EW and counter-UAS adoption
Rest of Asia-Pacific CAGR 8.30% Australia and Taiwan's regional deterrence


China's People's Liberation Army Strategic Support Force has centralized electronic warfare under a unified command structure, channeling an estimated USD 3.8 billion annually into airborne, shipborne, and ground-based systems [6]. India's Electronic Warfare Market trajectory accelerated after the 2020 Ladakh standoff, with the DRDO delivering the Shakti and Divya Drishti suites for frontline deployment. Japan's record-setting defense budgets through FY 2027 include dedicated line items for stand-off electronic warfare capabilities integrated into its GCAP sixth-generation fighter.

South America

Country Key Metric Key Driver
Brazil 62.5% of regional share Gripen E/F EW integration program
Argentina CAGR 7.40% Air Force recapitalization planning
Rest of South America USD 0.09 Billion (2025) Incremental border-surveillance needs


Brazil drives the Electronic Warfare Market in South America through its partnership with Saab on the Gripen E/F program, which includes the transfer of EW pod integration technology to Embraer's defense division. Argentina's modest but growing allocation toward air-force modernization represents a latent demand pocket, while Colombia and Chile are evaluating ground-based electronic support measures for counter-narcotics operations.

Middle East & Africa

Country Key Metric Key Driver
Saudi Arabia 33.5% of regional share Vision 2030 defense-industrial offset programs
UAE CAGR 9.30% Advanced counter-UAS EW procurement
South Africa USD 0.05 Billion (2025) Domestic EW R&D via the Saab Grintek partnership
Egypt CAGR 8.10% Air-defense modernization under U.S. FMF
Rest of MEA 18.7% of regional share Turkish EW export penetration


The Middle East & Africa Electronic Warfare Market is shaped by offset-driven technology transfer and counter-UAS urgency. Saudi Arabia's General Authority for Military Industries is channeling defense-localization mandates into domestic EW assembly facilities. At the same time, the UAE procured advanced Israeli-origin electronic warfare systems valued at over USD 400 million during 2023–2024 [19]. Africa's contribution remains modest but is growing as Egypt, Morocco, and Nigeria field ground-based electronic support systems sourced through U.S. Foreign Military Financing and Turkish defense-export programs.


Electronic Warfare Market By Region, 2025-2035

Competitive Benchmarking

The Electronic Warfare Market exhibits medium concentration, with an estimated top-five revenue share of 55–62% and a Herfindahl-Hirschman Index in the 900–1,200 range. The competitive structure blends large vertically integrated defense primes with specialist electronic warfare houses and emerging software-defined entrants. Scale advantages in RF hardware manufacturing coexist with innovation-driven disruption from algorithm-first companies, creating a dynamic competitive environment.

Company Est. Revenue Share Range Key Offerings for the Electronic Warfare Market Strategic Positioning
BAE Systems ~10–14% AN/ALQ-239, DEWS, Advanced EW Solutions Full-spectrum prime; dominant in U.S. airborne EW
L3Harris Technologies ~9–13% Viper Shield, integrated EW suites, C-UAS Cross-domain integrator; strong retrofit franchise
Northrop Grumman ~8–12% AN/ALQ-131 successor, space-based EW, SIGINT Space and airborne EW leader; cognitive-EW R&D
RTX (Raytheon) ~7–11% Next Generation Jammer, MALD-J, shipboard EW Naval and airborne attack; largest NGJ contractor
Leonardo S.p.A. ~5–8% BriteCloud, Miysis DIRCM, Eurofighter EW suite European champion; strong export portfolio
Elbit Systems ~4–7% EW and SIGINT suites, C-UAS systems Israeli innovation; agile emerging-market exporter
Thales Group ~4–6% Spectra EW suite, Vigile naval EW, COMINT Rafale EW integration; naval EW specialist
Lockheed Martin ~3–6% F-35 AN/ASQ-239 integration, silent-strike EW Platform-level EW integrator; 5th-gen expertise
Saab AB ~2–4% Arexis, Gripen EW, Sirius IRST-EW Nordic innovation; modular pod architecture
General Dynamics ~2–4% Ground-force EW, tactical SIGINT, C4ISR Land-domain EW and mission-system integration


Recent News & Developments

  • Elt Group and Rohde & Schwarz- (June 17, 2026)-- Signed a framework cooperation agreement to jointly develop and pursue commercial electronic warfare and ground-based counter-drone defense technologies across Europe.
  • L3Harris Technologies- (February 2025)-- Completed the first test flight of its Viper Shield electronic warfare suite on a Block 70 F-16 aircraft to enhance tactical jet jamming capabilities.


Electronic Warfare Market Report Scope

Parameter Details
Market Scope Global Electronic Warfare Market covering electronic attack, protection, and support across air, sea, land, and space platforms.
Study Period 2021–2035
CAGR (2026–2035) 9.45%
Market Size (2025) USD 15.12 Billion
Market Size (2035) USD 37.30 Billion
Fastest Growing Segments Space-based platform (10.10% CAGR); Electronic Attack capability (9.92% CAGR)
Companies Profiled BAE Systems, L3Harris, Northrop Grumman, RTX, Leonardo, Elbit Systems, Thales, Lockheed Martin, Saab, General Dynamics
Valuation Currency USD Billion


FAQs

How do cognitive electronic warfare algorithms change procurement evaluation criteria?
Procurement offices now weigh software-update cadence and algorithm-training infrastructure alongside traditional hardware metrics like power output and frequency range. Contracts increasingly mandate quarterly threat-library refreshes and open API access for third-party algorithm integration [9].
What is the typical integration timeline for a GaN retrofit on a fighter-aircraft EW pod?
Most GaN amplifier retrofits require 18–24 months from contract award to flight-test completion. Modular pod architectures with pre-qualified card slots can compress this to 12 months [8].
How do export-control restrictions affect multinational EW co-development programs?
ITAR and EAR classifications force non-U.S. partners to develop clean-sheet subsystems for jointly fielded platforms, adding a significant percentage to program costs. Bilateral technology-sharing agreements can mitigate this, but require multi-year negotiation [15].
What role does electronic warfare play in counter-hypersonic defense architectures?
Electronic warfare contributes through RF-based tracking augmentation and communications disruption of hypersonic-vehicle guidance links. Dedicated EW layers are being studied as complements to kinetic interceptors [12].
How are small and mid-tier defense firms competing against established EW primes?
Smaller firms focus on software-defined waveform libraries and niche sensor-processing modules that plug into open-architecture pods. Their agility in algorithm development offsets scale disadvantages in hardware production [11].
What cybersecurity risks accompany software-defined electronic warfare suites?
Software-defined architectures expand the attack surface through over-the-air threat-library updates and networked mission-data systems. Programs now allocate 8–12% of EW subsystem budgets to embedded cybersecurity hardening [16].
How does the Electronic Warfare Market address spectrum-sharing conflicts with commercial 5G networks?
Military operators negotiate dedicated spectrum corridors or dynamic-access agreements with telecom regulators. Cognitive EW systems increasingly incorporate spectral-awareness features that avoid commercial-band interference during peacetime operations [18].    
Author
Author
Author Profile
Shubham Munde LinkedIn
Team Lead - Research
Shubham brings over 7 years of expertise in Market Intelligence and Strategic Consulting, with a strong focus on the Automotive, Aerospace, and Defense sectors. Backed by a solid foundation in semiconductors, electronics, and software, he has successfully delivered high-impact syndicated and custom research on a global scale. His core strengths include market sizing, forecasting, competitive intelligence, consumer insights, and supply chain mapping. Widely recognized for developing scalable growth strategies, Shubham empowers clients to navigate complex markets and achieve a lasting competitive edge. Trusted by start-ups and Fortune 500 companies alike, he consistently converts challenges into strategic opportunities that drive sustainable growth.
Co-Author
Co-Author Profile
Swapnil Palwe LinkedIn
Team Lead - Research
With a technical background as Bachelor's in Mechanical Engineering, with MBA in Operations Management , Swapnil has 6+ years of experience in market research, consulting and analytics with the tasks of data mining, analysis, and project execution. He is the POC for our clients, for their consulting projects running under the Automotive/A&D domain. Swapnil has worked on major projects in verticals such as Aerospace & Defense, Automotive and many other domain projects. He has worked on projects for fortune 500 companies' syndicate and consulting projects along with several government projects.
Download Free Sample

Kindly complete the form below to receive a free sample of this Report

Download PDF ×

We do not share your information with anyone. However, we may send you emails based on your report interest from time to time. You may contact us at any time to opt-out.
















