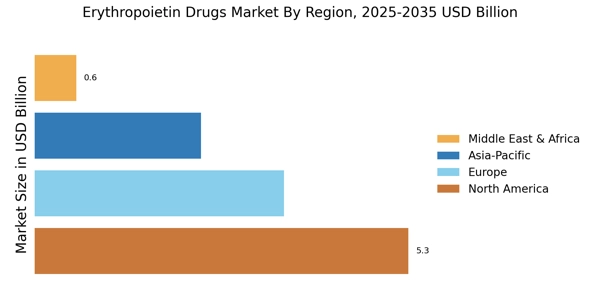
As per Market Research Future analysis, the Erythropoietin Drugs Market Size was estimated at 11.74 USD Billion in 2024. The Erythropoietin industry is projected to grow from 12.88 USD Billion in 2025 to 32.45 USD Billion by 2035, exhibiting a compound annual growth rate (CAGR) of 9.68% during the forecast period 2025 - 2035
Key Market Trends & Highlights
The Erythropoietin Drugs Market is experiencing robust growth driven by increasing demand for anemia treatments and technological advancements.
- The market is witnessing a rising demand for anemia treatments, particularly in North America, which remains the largest market.
- Technological innovations in drug delivery are enhancing the efficacy and accessibility of erythropoietin therapies across various demographics.
- The focus on personalized medicine is gaining traction, especially in the oncology segment, which is currently the fastest-growing area.
- Key market drivers include the increasing prevalence of chronic kidney disease and growing awareness of anemia management, particularly in the Asia-Pacific region.
Market Size & Forecast
| 2024 Market Size | 11.74 (USD Billion) |
| 2035 Market Size | 32.45 (USD Billion) |
| CAGR (2025 - 2035) | 9.68% |
Major Players
Amgen (US), Roche (CH), Johnson & Johnson (US), Eli Lilly (US), Pfizer (US), Novartis (CH), Boehringer Ingelheim (DE), Sandoz (CH), Teva Pharmaceutical Industries (IL)