Gas Turbine Market (2026 - 2035)

Gas Turbine Market Size, Share & Growth Analysis Report By Type (Heavy Duty, Industrial, Aeroderivative), By Rating Capacity (Less Than 40 MW, 40 to 120 MW, 121 to 300 MW, Above 300 MW), By End-User (Power Generation, Oil and Gas, Marine, Process Plant, Others), By Technology (Open Cycle, Combined Cycle) and By Regional (North America, Europe, South America, Asia Pacific, Middle East and Africa) - Industry Forecast to 2035
ID: MRFR/EnP/2368-CR
128 Pages
Chitranshi Jaiswal
Last Updated: July 07, 2026
Gas Turbine Market
Market Size
Forecast Period2026-2035
CAGR (2026-2035)7.86%
2025 Market SizeUSD 34.010 Billion
2035 Market SizeUSD 50.200 Billion
Key Players
GE Vernova
Siemens Energy
Mitsubishi Heavy Industries
Baker Hughes
Solar Turbines
Ansaldo Energia
Opportunities
  • Rise in the Adoption of Combined Heat & Power (CHP) Systems

Gas Turbine Market Summary

The global gas turbine market was valued at USD 34.010 billion in 2025 and is projected to reach approximately USD 35.897 billion by 2026, growing to USD 50.200 billion by 2035 at a compound annual growth rate of 3.80% during the 2026–2035 forecast period. Growth is fundamentally anchored by the increasing demand for reliable and efficient power generation solutions across both industrialized and emerging economies. The expanding global electricity demand—driven by urbanization, data-center proliferation, and electrification of transport—continues to reinforce the central role of gas turbines in baseload and peaking power infrastructure. Simultaneously, the growing emphasis on cleaner energy sources has accelerated the replacement of coal-fired assets with natural-gas-fired combined-cycle plants, which offer roughly half the carbon intensity per unit of electricity generated. Siemens Energy's USD 1 billion investment announced in November 2025 to expand gas turbine and grid equipment manufacturing in the United States underscores the scale of capital flowing into the sector [1].

With a 2025 valuation of USD 24,596.05 million, which reflects the installed base of big utility-scale plants worldwide, the heavy-duty turbine category leads the market in terms of both product and technology. However, because of its quick start-up time, small size, and suitability for dispersed generation and LNG applications, the aeroderivative segment—valued at USD 7,263.08 million in 2025—is the turbine type with the quickest rate of growth, with a CAGR of 5.24%. With a CAGR of 3.87%, combined-cycle technology accounts for USD 24,798.00 million of the 2025 market, demonstrating the industry's structural shift toward more efficient plant architectures. Next-generation fuel flexibility is becoming a competitive differentiator, as evidenced by significant developments like Mitsubishi Heavy Industries' June 2024 Memorandum of Understanding with the Electricity Generating Authority of Thailand to test 20% hydrogen co-firing in large gas turbines and Baker Hughes' contract to supply hydrogen-capable NovaLT12 turbocompressors to Italy's Snam [2][3].

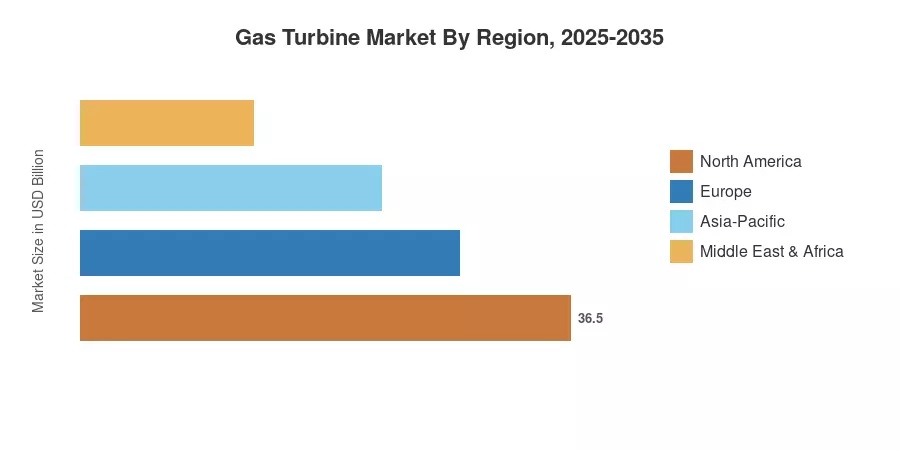
With a 2025 market value of USD 11,155.18 million, Asia Pacific leads the world in demand due to extensive capacity additions throughout China, India, and Southeast Asia. North America comes in second at USD 9,747.18 million, supported by robust legislative support for gas-to-power transitions and an established replacement and upgrade cycle. With a projected CAGR of 7.86%, the Middle East and Africa area is expected to grow at the fastest rate due to sub-Saharan electrification initiatives and infrastructure investments in Gulf Cooperation Council nations. Gas turbines function as a bridge fuel within the EU's taxonomic framework as Europe, the third-largest region with a GDP of USD 7,237.27 million, navigates a challenging energy transition. Through 2035, regional competitive dynamics will be increasingly defined by the convergence of grid-balancing requirements, digitization, and hydrogen readiness [4].


Key Report Takeaways

Segment Dimension Key Metric Notes
By Type — Dominant Heavy Duty: USD 24,596.05 Mn (2025) Accounts for ~72% of the global market; driven by utility-scale baseload demand
By Type — Fastest Growing Aeroderivative: CAGR 5.24% Compact, fast-start capability suits distributed generation and LNG applications
By Rating Capacity — Dominant Above 300 MW: USD 12,486.46 Mn (2025) Large combined-cycle installations in the Asia Pacific and North America
By Rating Capacity — Fastest Growing Less Than 40 MW: CAGR 4.85% Growth in industrial cogeneration and remote/island power
By End-User — Dominant Power Generation: USD 23,151.66 Mn (2025) ~68% market share; core demand driver across all regions
By End-User — Fastest Growing Marine: CAGR 5.01% LNG-fueled marine propulsion and offshore FPSO demand
By Technology — Dominant Combined Cycle: USD 24,798.00 Mn (2025) Higher efficiency (>60% HHV) is favored in new-build power plants
By Technology — Fastest Growing Combined Cycle: CAGR 3.87% Regulatory push for fuel efficiency over open-cycle configurations
By Region — Dominant Asia Pacific: USD 11,155.18 Mn (2025) China, India, and Southeast Asia capacity additions
By Region — Fastest Growing Middle East & Africa: CAGR 7.86% GCC diversification, sub-Saharan electrification programs


Market Size and Forecast (2019–2035)

Market Research Future employs a rigorous bottom-up and top-down methodology that triangulates supply-side revenue data from OEM financial disclosures, order-book announcements, and trade databases with demand-side indicators including power-plant commissioning schedules, government energy-sector capital expenditure plans, and utility procurement pipelines. The historical period (2019–2024) is validated against public financial filings and industry association reports, while the forecast period (2026–2035) incorporates regression analysis, expert interviews, and scenario modeling to project market trajectories under varying macroeconomic and policy conditions.
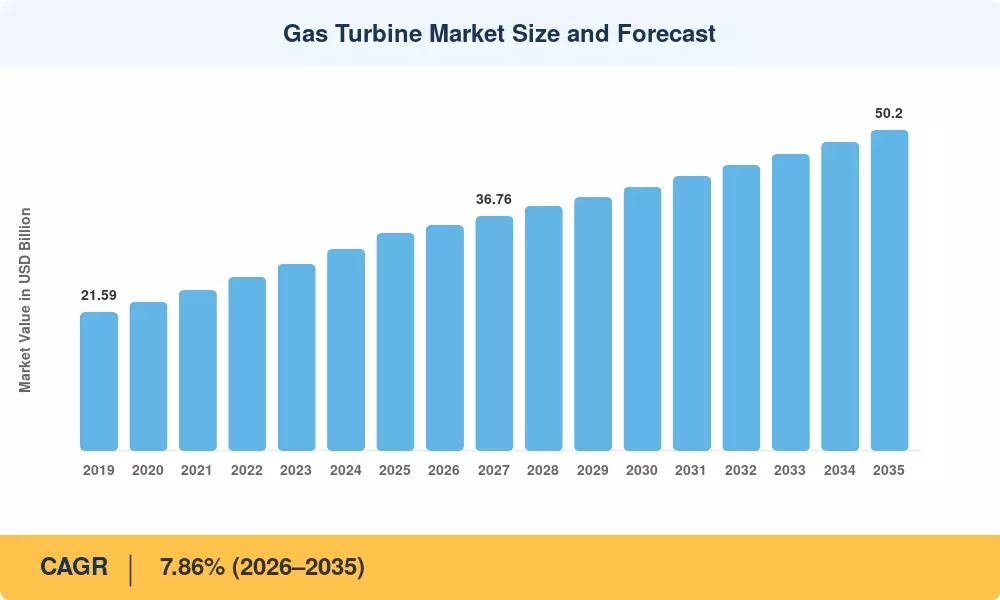
Gas Turbine Market Size and Forecast
Our Impact
Enabled $4.3B Revenue Impact for Fortune 500 and Leading Multinationals
Partnering with 2000+ Global Organizations Each Year
30K+ Citations by Top-Tier Firms in the Industry

Driver Impact Analysis

Driver ~% Impact on CAGR Geographic Relevance Impact Timeline
Increasing demand for reliable and efficient power generation solutions ~60% Global — especially Asia Pacific, MEA, South America Short to Long-term
Growing emphasis on cleaner energy sources ~40% Global — especially Europe, North America Medium to Long-term


Increasing Demand for Reliable and Efficient Power Generation Solutions

The global electricity demand trajectory is the single most powerful driver of the gas turbine market. The International Energy Agency projects that global electricity consumption will grow by more than 25% between 2025 and 2035, underpinned by population growth, rapid urbanization in emerging economies, and the electrification of sectors including transport, heating, and industrial processes. Gas turbines—particularly combined-cycle configurations operating at thermal efficiencies exceeding 60%—provide dispatchable, high-capacity power generation that renewable intermittent sources cannot fully replicate. This reliability premium is especially pronounced in fast-growing regions: Asia Pacific, the largest regional market at USD 11,155.18 million in 2025, relies on gas turbines to meet surging industrial and residential load requirements. Similarly, the Middle East & Africa region, forecast to grow at 7.86% CAGR, is deploying gas-fired generation to support economic diversification and electrification of underserved populations.

Within this macro-driver, the upgrade and modernization cycle in mature markets adds a secondary demand stream. GE Vernova's January 2024 modernization of four 9E gas turbines at Kuwait's Sabiya Combined Cycle Power Plant—delivering up to 70 MW of additional output through Advanced Gas Path upgrades without incremental fuel consumption—illustrates how efficiency improvement on existing installed fleets sustains OEM revenues even where net new capacity additions are slower [7].

Growing Emphasis on Cleaner Energy Sources

Natural gas-fired power generation is quickly replacing higher-emission coal and oil-fired power generation due to the global energy shift. In contemporary combined-cycle facilities, natural gas generates about 50–60% less CO2 per megawatt-hour than coal, making gas turbines a practical bridging fuel for national decarbonization plans. This trend is especially evident in Asia, where China and India are diversifying their generation mix away from coal, and in Europe, where the EU Taxonomy for Sustainable Activities offers conditional "green" categorization for gas-fired facilities fulfilling lifecycle emissions limitations.

The next frontier for this driver is hydrogen readiness. Baker Hughes' hydrogen-capable NovaLT12 turbocompressors demonstrate OEM commitment to zero-carbon fuel routes for Snam's Italian pipeline network and Mitsubishi Heavy Industries' June 2024 Memorandum of Understanding with Thailand's EGAT to test 20% hydrogen co-firing in big gas turbines. Hydrogen blending, and eventually full hydrogen combustion might expand the addressable market for gas turbines well beyond the traditional fossil-fuel lifespan as green-hydrogen production costs drop, approaching USD 2/kg by the early 2030s [2][3].


Restraints Impact Analysis

Restraint ~% Drag on CAGR Geographic Relevance Impact Timeline
High initial investment costs ~100% Global — most acute in South America and sub-Saharan Africa Short to Medium-term


High Initial Investment Costs

A single large-frame combined-cycle unit frequently costs more than USD 600–800 million when balance-of-plant, engineering, procurement, and building expenses are taken into account. Gas turbine power plants require significant upfront capital expenditures. These capital requirements might postpone or cancel planned capacity additions for developing economies in South America and sub-Saharan Africa, where access to long-term project financing is limited and sovereign risk premiums are high. In markets where regulatory frameworks promote lowest-cost generation, investment substitution pressure is created by the increasingly competitive levelized cost of energy from solar PV and onshore wind, which have low fuel costs and shorter building schedules. Over the course of the projected horizon, this limitation is being somewhat mitigated by the dispatchability premium of gas turbines, their smaller land footprint in comparison to equivalent renewable capacity, and the increasing availability of concessional climate-finance instruments [8][9].


Gas Turbine Market Opportunities

Rise in the Adoption of Combined Heat & Power (CHP) Systems

In the industrial sector, where simultaneous production of electricity and usable thermal energy can achieve total system efficiencies of 80–90% as opposed to 35–45% for traditional separate-generation approaches, combined heat and power systems offer a substantial growth opportunity for the gas turbine market. As industrial operators in chemicals, refining, food processing, and district heating strive to lower energy costs and reduce carbon intensity, the global CHP industry is growing. Because they meet the scale and heat-to-power ratios needed by the majority of industrial facilities, gas turbines in the less-than-40-MW and 40-to-120-MW capacity bands—which together account for USD 12,914.40 million of the 2025 market—are the main beneficiaries of CHP adoption.


In Europe, government incentive programs and carbon pricing under the EU Emissions Trading System are accelerating CHP deployment, while in North America, rising natural gas availability from shale production supports competitive operating economics. The industrial end-user segment (USD 2,150.58 million in 2025, CAGR 5.01%) and process-plants end-user segment (USD 3,310.18 million, CAGR 4.23%) both stand to benefit from CHP adoption trends. MRFR estimates that CHP-related gas turbine demand could contribute an incremental USD 3–4 billion in cumulative market value over the 2026–2035 forecast period [10][11].


Gas Turbine Market Future Outlook

Technology Evolution Trajectory

The gas turbine industry is converging toward a dual-track technology roadmap: continued improvement in natural-gas combustion efficiency and the parallel development of hydrogen and ammonia fuel capability. Major OEMs have committed to delivering turbines capable of burning 100% hydrogen by the early 2030s, with current-generation frames already validated for 20–30% hydrogen blending. Combined-cycle plant efficiencies are approaching 65% HHV for the latest H-class and J-class machines, narrowing the thermodynamic gap with theoretical limits and sustaining the economic competitiveness of gas-fired generation against renewables-plus-storage alternatives.

Competitive Dynamics and Market Structure

The market remains an oligopoly dominated by four global OEMs—GE Vernova, Siemens Energy, Mitsubishi Heavy Industries, and Baker Hughes—that collectively command the majority of the large-frame installed base and the associated long-term service agreements that generate recurring revenue streams. Regional manufacturers, including BHEL, Doosan Enerbility, and Kawasaki Heavy Industries, compete primarily in their domestic and adjacent markets. Over the forecast period, competitive differentiation will increasingly center on digital services (predictive maintenance, digital twins, fleet optimization), hydrogen-readiness certification, and integrated energy-island solutions that bundle turbines with electrolyzers and storage.

Regulatory and Sustainability-Driven Shifts

Carbon pricing mechanisms—including the EU ETS, the UK ETS, and emerging systems in Canada, Japan, and South Korea—are progressively internalizing the emissions cost of gas-fired generation, creating economic incentives for higher-efficiency and lower-carbon turbine technologies. The EU Carbon Border Adjustment Mechanism (CBAM), effective from 2026, will further influence trade flows for energy-intensive goods and indirectly support gas-to-power investment in exporting economies seeking to maintain market access. Simultaneously, methane-emission regulations targeting upstream gas supply chains are raising lifecycle-emission scrutiny on gas turbine operations.

Long-Range Demand Scenario

MRFR's central demand scenario projects the global gas turbine market reaching USD 50.200 billion by 2035, anchored by continued baseload and peaking demand in emerging economies, fleet modernization in OECD markets, and the incremental contribution of hydrogen-fueled generation. Under an accelerated hydrogen scenario—assuming green hydrogen reaches cost parity with natural gas by 2032—cumulative market value over the forecast period could exceed the baseline by 8–12%, as retrofit and new-build hydrogen turbine demand supplements conventional gas orders.


Gas Turbine Market Segmentation

Dimension Sub-Segments Dominant Segment (2025) Fastest Growing Segment
By Type Heavy Duty, Industrial, Aeroderivative Heavy Duty (USD 24,596.05 Mn) Aeroderivative (CAGR 5.24%)
By Rating Capacity Less Than 40 MW, 40 to 120 MW, 121 to 300 MW, Above 300 MW Above 300 MW (USD 12,486.46 Mn) Less Than 40 MW (CAGR 4.85%)
By End-User Power Generation, Oil & Gas, Marine, Process Plants, Others Power Generation (USD 23,151.66 Mn) Marine (CAGR 5.01%)
By Technology Open Cycle, Combined Cycle Combined Cycle (USD 24,798.00 Mn) Combined Cycle (CAGR 3.87%)


By Type

Segment 2025 (USD Mn) CAGR (2026–2035) Primary Demand Driver
Heavy Duty 24,596.05 3.21% Utility-scale baseload and combined-cycle power plants
Industrial 2,150.58 5.01% Mechanical drive for compressors, pumps and CHP applications
Aeroderivative 7,263.08 5.24% Fast-start peaking, distributed generation, LNG facilities


The heavy-duty segment commands approximately 72% of total market value, reflecting the dominance of large-frame gas turbines (F, H, and J classes) in utility-scale combined-cycle and simple-cycle power plants worldwide. The aeroderivative segment, while smaller in absolute terms, is growing most rapidly at a CAGR of 5.24% due to its superior operational flexibility—sub-10-minute start-up times, high part-load efficiency, and compact footprint—which positions it as the turbine of choice for grid-balancing services, LNG liquefaction plants, and island or remote-location power systems. The industrial segment at CAGR 5.01% benefits from CHP expansion and mechanical-drive applications in the oil and gas midstream sector.

By Rating Capacity

Segment 2025 (USD Mn) CAGR (2026–2035) Primary Demand Driver
Less Than 40 MW 4,787.93 4.85% Distributed generation, CHP, remote/island power
40 to 120 MW 8,126.47 4.31% Industrial cogeneration, mid-scale peaking plants
121 to 300 MW 8,608.85 3.70% Combined-cycle blocks, single-shaft configurations
Above 300 MW 12,486.46 3.07% Large combined-cycle GTs; utility baseload additions


The above-300-MW segment dominates with USD 12,486.46 million in 2025, reflecting the prevalence of large H-class and J-class frames in combined-cycle new-build projects. However, the fastest growth is in the sub-40-MW category (CAGR 4.85%), where demand is driven by distributed and industrial generation applications, where smaller, modular turbine packages offer superior capital efficiency and operational flexibility compared to centralized plants.

By End-User

Segment 2025 (USD Mn) CAGR (2026–2035) Primary Demand Driver
Power Generation 23,151.66 3.82% Baseload, peaking, grid-balancing electricity generation
Oil & Gas 4,641.05 2.93% Pipeline compression, offshore platforms, LNG plants
Marine 2,065.50 5.01% LNG-fueled propulsion, FPSO power generation
Process Plants 3,310.18 4.23% CHP in chemicals, refining and food processing
Others 841.31 2.66% Mining, desalination, district heating


Power generation is the core demand anchor, accounting for approximately 68% of total market value. The marine end-user segment exhibits the highest growth rate at 5.01% CAGR, driven by the International Maritime Organization's decarbonization regulations, which are accelerating the adoption of LNG-fueled gas turbines for vessel propulsion and floating production, storage, and offloading (FPSO) units. Process plants represent a growing CHP opportunity, particularly in the European chemical and refining sectors.

By Technology

Segment 2025 (USD Mn) CAGR (2026–2035) Primary Demand Driver
Open Cycle 9,211.71 3.59% Peaking power, mechanical drive, rapid-deployment applications
Combined Cycle 24,798.00 3.87% Baseload power, efficiency mandates and carbon-intensity reduction


Combined-cycle technology represents nearly 73% of the global market by value, reflecting the industry's structural preference for higher thermal efficiency. Combined-cycle gas turbine (CCGT) plants achieve net efficiencies exceeding 60%, compared with 33–42% for open-cycle configurations, making them the preferred technology for new-build baseload generation in most geographies. Open-cycle turbines retain a critical role in peaking, emergency, and mechanical-drive applications where rapid deployment and start-up flexibility outweigh efficiency considerations.


Regional Market Share Analysis

Region 2025 Market (USD Mn) CAGR (2026–2035) Primary Investment Themes
North America 9,747.18 3.47% Fleet modernization, LNG export and hydrogen pilots
Europe 7,237.27 3.04% Energy transition bridge fuel, CHP, hydrogen blending
Asia Pacific 11,155.18 2.30% Baseload capacity additions, industrial growth
South America 1,979.36 5.89% Thermal backup for hydro, LNG-to-power projects
Middle East & Africa 3,890.71 7.86% GCC diversification, sub-Saharan electrification
Total 34,009.71 3.80%


North America

Country Key Metric Key Driver
United States Largest national market; ~75% of regional revenue Fleet modernization, grid reliability mandates, LNG-linked demand
Canada Significant upstream oil & gas turbine installations LNG Canada and pipeline compression
Mexico Emerging combined-cycle build-out CFE thermal-generation expansion


North America's gas turbine market benefits from a mature installed base undergoing a multi-decade replacement and efficiency-upgrade cycle. The United States accounts for the majority of regional demand, driven by utility-scale combined-cycle additions displacing retiring coal plants, grid-reliability requirements in deregulated power markets, and the expansion of LNG liquefaction capacity along the Gulf Coast. Siemens Energy's November 2025 announcement of USD 1 billion in U.S. manufacturing investment—including a new Mississippi switchgear plant and upgrades to facilities in North Carolina, Florida, Alabama, New York, and Texas—reflects OEM confidence in the region's sustained procurement pipeline. Regulatory frameworks such as the EPA's power-plant emissions standards and the Inflation Reduction Act's hydrogen production tax credits are also shaping technology selection toward higher-efficiency and hydrogen-ready turbine platforms [1][13].

Europe

Country Key Metric Key Driver
Germany Largest European market Coal phase-out, Energiewende hydrogen strategy
United Kingdom Major offshore wind backup requirements Capacity market contracts for gas peakers
Italy Growing hydrogen infrastructure Snam pipeline modernization, Baker Hughes supply contracts


Europe is navigating a complex energy transition in which gas turbines serve as a critical bridging technology between the retirement of coal and nuclear baseload and the scaling of renewable generation. The EU Taxonomy's conditional classification of gas-fired plants under sustainability criteria provides a regulatory pathway for new investment, while national programs—such as Germany's Kraftwerkstrategie to procure up to 10 GW of hydrogen-ready gas capacity—create substantial near-term order opportunities. The regional market, valued at USD 7,237.27 million in 2025 with a CAGR of 3.04%, is characterized by technology premiumization, with OEMs competing on hydrogen co-firing readiness, digital monitoring capabilities, and lifecycle service agreements [3][14].

Asia Pacific

Country Key Metric Key Driver
China Largest turbine market in the region Peaking-plant demand, energy security diversification
India Rapidly growing gas infrastructure City gas distribution, LNG regasification capacity
Southeast Asia (Thailand, Vietnam, Indonesia) Emerging combined-cycle build-out Coal-to-gas switching, bilateral MoUs with OEMs


Asia Pacific is the largest regional market by 2025 revenue at USD 11,155.18 million, although its comparatively lower CAGR of 2.30% reflects a maturing demand cycle in China and Japan. Growth momentum is increasingly shifting to Southeast Asian economies—Thailand, Vietnam, and Indonesia—where coal-to-gas fuel switching aligns with national climate commitments under the Paris Agreement. Mitsubishi Heavy Industries' June 2024 MoU with EGAT for hydrogen co-firing trials in Thailand exemplifies the technology-transfer and pilot-program model through which OEMs are securing long-term positions in emerging ASEAN markets [2][15].

South America

Country Key Metric Key Driver
Brazil Dominant South American market Thermal backup during dry hydro seasons
Argentina Vaca Muerta shale gas development Domestic gas-to-power projects
Chile Decarbonization targets LNG import and combined-cycle investments


South America's gas turbine market, valued at USD 1,979.36 million in 2025 with a robust CAGR of 5.89%, is driven primarily by Brazil's structural need for thermal generation capacity to backstop its hydro-dominated electricity system during increasingly frequent drought periods. Argentina's Vaca Muerta shale play is creating a new domestic gas supply that supports gas-to-power project economics, while Chile's decommissioning of coal plants under its National Decarbonization Plan is opening procurement opportunities for combined-cycle replacements [12][16].

Middle East & Africa

Country Key Metric Key Driver
Saudi Arabia Largest MEA market Vision 2030 power-sector expansion
UAE High-efficiency fleet upgrade cycle Abu Dhabi and Dubai utility modernization
Nigeria Emerging electrification demand Gas-to-power in the Niger Delta, captive generation
South Africa Grid reliability crisis driving gas alternatives IRP 2019 gas-to-power allocation


The Middle East & Africa region exhibits the highest forecast CAGR at 7.86%, rising from USD 3,890.71 million in 2025. Gulf Cooperation Council states—particularly Saudi Arabia and the UAE—are investing heavily in gas-fired generation to free crude oil for export and to meet soaring electricity demand driven by industrial diversification, desalination, and cooling loads. In sub-Saharan Africa, Nigeria and South Africa represent the primary demand centers, where chronic generation shortfalls and grid-reliability challenges create urgent procurement requirements for gas turbine capacity in both utility and captive-power configurations [4][17].


Gas Turbine Market By Region, 2025-2035

Competitive Benchmarking

The global gas turbine market is highly concentrated, with the top four manufacturers—GE Vernova, Siemens Energy, Mitsubishi Heavy Industries, and Baker Hughes—collectively commanding an estimated 60–65% share of the large-frame turbine market. The Herfindahl-Hirschman Index for the sector is estimated in the 1,500–2,000 range, indicative of a moderately concentrated oligopoly. Competition centers on technology performance (efficiency, emissions, flexibility), lifecycle service offerings, hydrogen-readiness roadmaps, and regional manufacturing and service footprints.

Company Est. Revenue Share Key Offerings Strategic Positioning
GE Vernova ~22% HA-class gas turbines, Advanced Gas Path upgrades, digital solutions Largest installed base globally; strong services revenue stream
Siemens Energy ~20% SGT-8000H/9000HL series, hydrogen-ready configurations USD 1 Bn U.S. manufacturing expansion; integrated grid solutions
Mitsubishi Heavy Industries ~15% M501JAC, hydrogen co-firing R&D, GTCC packages Technology leader in J-class efficiency; ASEAN market penetration
Baker Hughes ~8% NovaLT series, LM aeroderivatives, turbocompressors Hydrogen-capable turbocompressors; oil & gas midstream focus
Solar Turbines (Caterpillar) ~5% Titan, Mars, Mercury industrial turbines Leading position in the sub-40 MW industrial and CHP segment
Ansaldo Energia ~4% GT36 H-class, GT26 upgrades European presence; hydrogen combustion development
Doosan Enerbility ~4% Licensed large-frame turbines, localized service Korean and Southeast Asian market focus
Bharat Heavy Electricals (BHEL) ~4% Licensed GE frames, indigenous development programs Dominant Indian public-sector supplier
Kawasaki Heavy Industries ~3% L30A, L20A industrial turbines, hydrogen combustion R&D Niche industrial turbine expertise; Japan hydrogen strategy alignment
IHI Corporation ~3% Aero-engine derivatives, industrial turbines Japanese defense and industrial applications
Other Market Players ~12% Various regional and niche manufacturers Service providers, component suppliers, EPC contractors


Recent News & Developments

Siemens Energy (November 2025):

Siemens Energy announced a landmark USD 1 billion investment to expand its gas turbine and grid equipment manufacturing capacity in the United States, a commitment expected to create more than 1,500 skilled jobs. The investment includes the construction of a new switchgear manufacturing plant in Mississippi, alongside upgrades to existing facilities in North Carolina, Florida, Alabama, New York, and Texas, as well as expanded workforce training programs. This initiative reinforces Siemens Energy's century-long U.S. industrial presence and signals OEM confidence in sustained North American demand for gas turbine and grid modernization equipment. The scale of the investment—one of the largest single manufacturing commitments in the gas turbine sector in recent years—positions Siemens Energy to capture share in the U.S. replacement and upgrade cycle while establishing localized supply-chain resilience [1].

GE Vernova (January 2024):

GE Vernova completed the modernization of four 9E gas turbines at Kuwait's Sabiya Combined Cycle Power Plant. This project enhanced plant efficiency and increased output by up to 70 MW through the installation of Advanced Gas Path (AGP) upgrades. The upgrade achieved higher power generation without additional fuel consumption, demonstrating the commercial and environmental value of fleet-modernization programs. This project exemplifies the recurring-revenue service model that underpins OEM profitability, as upgrade programs on installed bases generate revenue streams comparable to new-unit sales while extending asset lifespans by 15–20 years [7].

Mitsubishi Heavy Industries (June 2024):

Mitsubishi Heavy Industries signed a Memorandum of Understanding with the Electricity Generating Authority of Thailand (EGAT) to develop and pilot hydrogen co-firing technology for large gas turbines, targeting a 20% hydrogen blend by volume. The MoU supports Thailand's national transition toward net-zero emissions and positions MHI as a technology partner for fuel-flexibility upgrades across Southeast Asia. The partnership is strategically significant for MHI's regional market development, as Thailand serves as a gateway to broader ASEAN procurement opportunities [2].

Baker Hughes (April 2024):

Baker Hughes secured a contract from Snam, Italy's major gas transmission system operator, to supply NovaLT12 gas turbine-driven turbocompressors with hydrogen blending capability of up to 10% by volume. The contract supports the decarbonization and resilience of Italy's natural gas pipeline network and represents an early commercial deployment of hydrogen-capable compression technology in European transmission infrastructure. Baker Hughes' positioning in the hydrogen value chain—spanning both power generation and midstream compression—differentiates it from competitors focused primarily on the power-generation segment [3].


Gas Turbine Market Report Scope

Parameter Detail
Market Scope Global Gas Turbine Market
Study Period 2019–2035
CAGR Window 2026–2035
Base Year 2025
Market Size (2025) USD 34.010 Billion
Market Size (2035) USD 50.200 Billion
Fastest Growing Region Middle East & Africa (CAGR 7.86%)
Dominant Region North America (USD 9,747.18 Mn, 2025)
Fastest Growing Segment — By Type Aeroderivative (CAGR 5.24%)
Fastest Growing Segment — By Rating Capacity Less Than 40 MW (CAGR 4.85%)
Fastest Growing Segment — By End-User Marine (CAGR 5.01%)
Fastest Growing Segment — By Technology Combined Cycle (CAGR 3.87%)
Companies Profiled Siemens Energy, GE Vernova, Mitsubishi Heavy Industries, Baker Hughes, Ansaldo Energia, IHI Corporation, Solar Turbines, Bharat Heavy Electricals Limited, Kawasaki Heavy Industries, Doosan Enerbility
Valuation Currency USD (Billion for headline; Million for segmental)
Segments Covered By Type, By Rating Capacity, By End-User, By Technology, By Region


FAQs

What is the projected size of the global gas turbine market by 2035?
The global gas turbine market is projected to reach USD 50.200 billion by 2035, growing from USD 34.010 billion in 2025 at a CAGR of 3.80% during the 2026–2035 forecast period. Rising global electricity demand, fleet modernization programs, and the transition from coal to gas-fired generation drive growth.
Which turbine type is growing the fastest?
The aeroderivative turbine segment is the fastest growing by type, at a CAGR of 5.24% over 2026–2035. This growth is driven by the segment's operational flexibility, rapid start-up times, and suitability for distributed generation, LNG facilities, and grid-balancing applications. Aeroderivative turbines are valued at USD 7,263.08 million in 2025.
Which region offers the highest growth potential through 2035?
The Middle East & Africa region offers the highest growth potential with a forecast CAGR of 7.86%, driven by GCC power-sector expansion under economic diversification programs such as Saudi Vision 2030, and sub-Saharan Africa's acute electrification requirements. The region's 2025 market value stands at USD 3,890.71 million.
How is hydrogen readiness shaping competitive dynamics?
Hydrogen readiness is emerging as a critical competitive differentiator among OEMs. Mitsubishi Heavy Industries is piloting 20% hydrogen co-firing in Thailand, Baker Hughes is supplying hydrogen-capable turbocompressors in Italy, and Siemens Energy's HL-class turbines are designed for up to 75% hydrogen blending. OEMs that can credibly offer zero-carbon fuel pathways are gaining procurement preference in Europe and the Asia Pacific.
What role does the combined-cycle technology segment play?
Combined-cycle gas turbine technology dominates the market at USD 24,798.00 million in 2025 with a CAGR of 3.87%. Its thermal efficiency exceeding 60% makes it the preferred choice for new-build baseload and mid-merit generation globally. Regulatory pressure to reduce carbon intensity further strengthens the economic case for combined-cycle over open-cycle configurations.
Which end-user segments present the strongest growth opportunities?
The marine end-user segment (CAGR 5.01%) and the industrial turbine segment (CAGR 5.01%) present the strongest growth opportunities. Marine demand is driven by IMO decarbonization regulations accelerating LNG-fueled propulsion adoption, while industrial demand benefits from the expansion of combined heat and power installations in the chemical, refining, and food-processing sectors.
What are the key barriers to market growth?
High initial investment costs remain the primary restraint, as a single large combined-cycle project can exceed USD 600–800 million. This capital intensity is particularly constraining in developing economies with limited project-finance access. Additionally, the declining levelized cost of solar PV and wind creates investment substitution pressure in markets where policy frameworks prioritize lowest-cost generation.  
Author
Author
Author Profile
Chitranshi Jaiswal LinkedIn
Team Lead - Research
Chitranshi is a Team Leader in the Chemicals & Materials (CnM) and Energy & Power (EnP) domains, with 6+ years of experience in market research. She leads and mentors teams to deliver cross-domain projects that equip clients with actionable insights and growth strategies. She is skilled in market estimation, forecasting, competitive benchmarking, and both primary & secondary research, enabling her to turn complex data into decision-ready insights. An engineer and MBA professional, she combines technical expertise with strategic acumen to solve dynamic market challenges. Chitranshi has successfully managed projects that support market entry, investment planning, and competitive positioning, while building strong client relationships. Certified in Advanced Excel & Power BI she leverages data-driven approaches to ensure accuracy, clarity, and impactful outcomes.

Research Approach

Secondary Research

The secondary research process involved comprehensive analysis of energy regulatory databases, power generation publications, technical engineering journals, and authoritative energy organizations. Key sources included the International Energy Agency (IEA), US Energy Information Administration (EIA), Federal Energy Regulatory Commission (FERC), International Electrotechnical Commission (IEC), International Organization for Standardization (ISO) technical committees, International Gas Turbine Institute (IGTI/ASME), European Association of Gas Turbine Manufacturers (EUGT), US Department of Energy (DOE) National Energy Technology Laboratory (NETL), IEEE Power & Energy Society, World Energy Council, Gas Turbine Association (GTA), International Association of Power Generation Companies, BP Statistical Review of World Energy, Eurostat Energy Database, Power Engineering International archives, and national energy ministry reports from key markets (US DOE, India's Ministry of Power, China's National Energy Administration, EU Directorate-General for Energy). These sources were used to collect installed capacity statistics, regulatory policy frameworks, emissions standards data, fuel price trends, technological efficiency studies, and market landscape analysis for heavy-duty, industrial, and aeroderivative gas turbine categories across open cycle and combined cycle configurations.


Primary Research

To gather both qualitative and quantitative insights, supply-side and demand-side stakeholders were interviewed during the primary research phase. Chief executive officers, chief technology officers, vice presidents of engineering, heads of product development, and directors of aftermarket services from gas turbine OEMs, component suppliers, and maintenance, repair, and overhaul (MRO) service providers were examples of supply-side sources. Demand-side sources included EPC (engineering, procurement, construction) contractors with a focus on power infrastructure, director-level executives from oil and gas upstream and downstream facilities, marine fleet engineering managers, procurement heads from electric utilities and independent power producers (IPPs), and plant managers from process industries (petrochemical, steel, and cement). Primary research confirmed technological advancement timelines (digital twin integration, hydrogen-capable turbines), validated market segmentation across capacity ratings (below 40 MW to above 300 MW), and collected data on fleet utilization rates, long-term service agreement (LTSA) pricing structures, and carbon neutrality compliance strategies.

Primary Respondent Breakdown:

By Designation: C-level Primaries (42%), Director Level (33%), Others (25%)

By Region: North America (42%), Europe (30%), Asia-Pacific (18%), Rest of World (10%)


Market Size Estimation

Global market valuation was derived through revenue mapping and installed capacity analysis. The methodology included:

Identification of 35+ key manufacturers across North America, Europe, Asia-Pacific, Middle East & Africa, and Latin America, including major OEMs and emerging regional players

Product mapping across heavy-duty (>100 MW), industrial (15-100 MW), and aeroderivative (<50 MW) turbine categories with segmentation by open cycle and combined cycle technologies

Analysis of reported and modeled annual revenues specific to gas turbine new unit sales, aftermarket services, and long-term maintenance contracts

Coverage of manufacturers representing 75-80% of global market share in 2024

Extrapolation using bottom-up (installed capacity × unit pricing by region and rating capacity) and top-down (manufacturer revenue validation) approaches to derive segment-specific valuations for power generation, oil & gas, marine, and process plant end-user segments

Download Free Sample

Kindly complete the form below to receive a free sample of this Report

Download PDF ×

We do not share your information with anyone. However, we may send you emails based on your report interest from time to time. You may contact us at any time to opt-out.

















