Segmentation Quick Reference
| Dimension | Sub-Segments | Dominant Segment | Fastest Growing Segment |
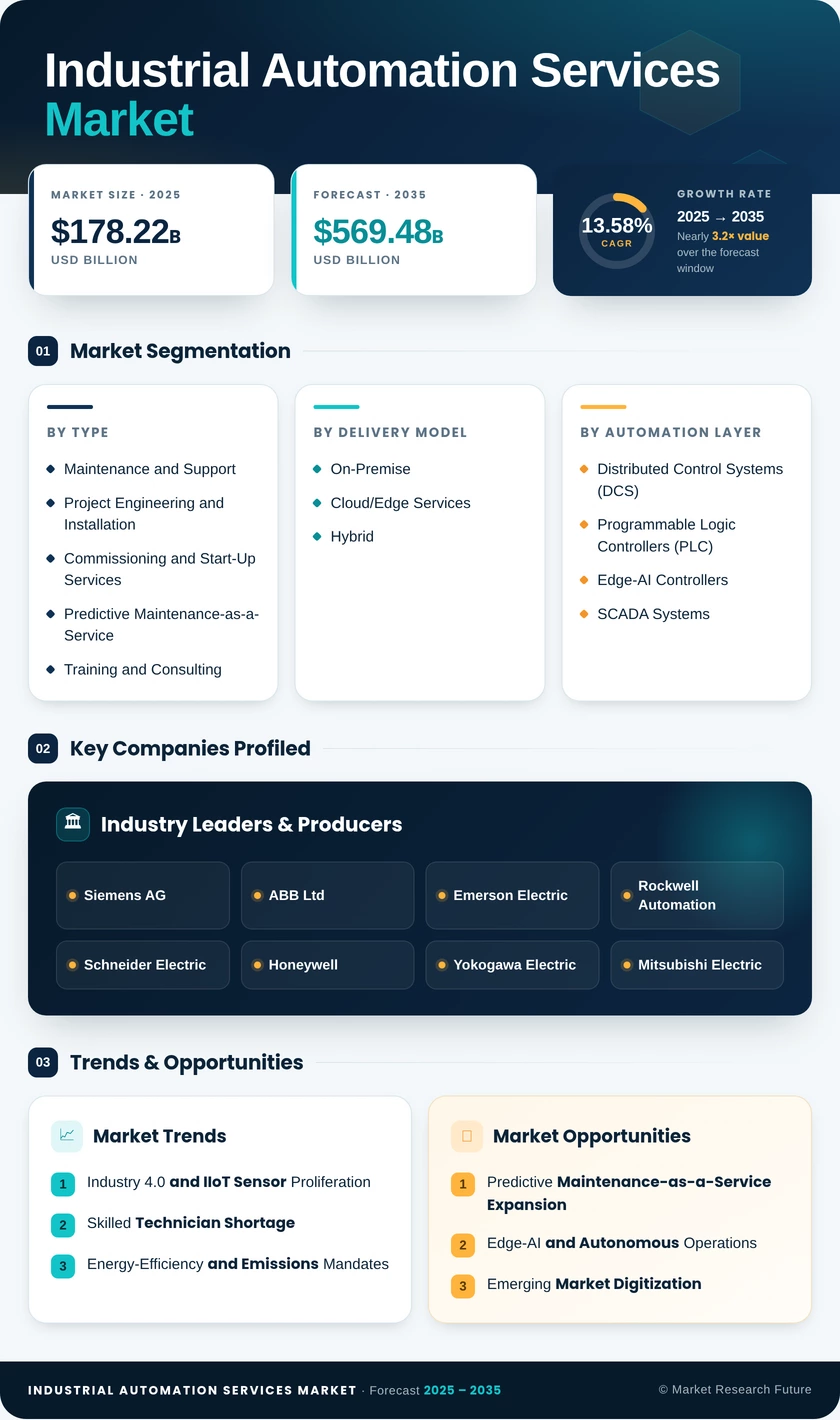
| Service Type | Maintenance and Support; Project Engineering and Installation; Commissioning and Start-Up Services; Predictive Maintenance-as-a-Service; Training and Consulting | Maintenance and Support | Predictive Maintenance-as-a-Service |
| Delivery Model | On-Premise; Cloud/Edge Services; Hybrid | On-Premise | Cloud/Edge Services |
| Automation Layer | Distributed Control Systems (DCS); Programmable Logic Controllers (PLC); Edge-AI Controllers; SCADA Systems | Distributed Control Systems (DCS) | Edge-AI Controllers |
| End-User Industry | Oil and Gas; Automotive and Transportation; Industrial Automation Services Market and Biotechnology; Food and Beverage; Power and Utilities | Oil and Gas | Automotive and Transportation |
| Geography | North America; Europe; Asia-Pacific; South America; Middle East & Africa | Asia-Pacific | Asia-Pacific |
Market Segmentation Overview
By Service Type
| Sub-Segment | Key Trend |
| Maintenance and Support | Transition from calendar-based to condition-based contracts driven by IIoT data streams |
| Project Engineering and Installation | Greenfield capacity additions in Asia-Pacific and Middle East sustain double-digit growth |
| Commissioning and Start-Up Services | Accelerated plant-activation timelines compressing from 18 to 12 months |
| Predictive Maintenance-as-a-Service | ML-powered anomaly detection enabling guaranteed-uptime service models |
| Training and Consulting | Workforce upskilling mandates creating recurring revenue in digital-literacy programs |
Maintenance and Support remains the largest service-type segment, underpinned by the long operational lifecycles of industrial assets that require continuous monitoring, calibration, and parts replacement. Predictive Maintenance-as-a-Service is rapidly gaining share as factory automation solutions providers leverage sensor-driven analytics to shift from reactive repair to proactive asset management.
By Delivery Model
| Sub-Segment | Key Trend |
| On-Premise | Persistent dominance in regulated industries with strict data residency requirements |
| Cloud/Edge Services | Hyperscaler-OEM partnerships accelerating cloud-native analytics adoption |
| Hybrid | Transitional architecture bridging legacy on-site systems with cloud-based analytics |
On-premise deployments continue to hold the majority share due to regulatory constraints in oil and gas, pharmaceuticals, and defense. Cloud and edge delivery models are, however, the fastest-growing segment, enabled by industrial-grade cybersecurity frameworks and subscription-based pricing that lowers adoption barriers for mid-market manufacturers.
By Automation Layer
| Sub-Segment | Key Trend |
| Distributed Control Systems (DCS) | Entrenched in refining and chemicals; evolving toward open-architecture platforms |
| Programmable Logic Controllers (PLC) | Mainstay of discrete manufacturing with growing edge-connectivity capabilities |
| Edge-AI Controllers | Enabling on-device inference for autonomous quality inspection and adaptive control |
| SCADA Systems | Expanding remote-monitoring reach across geographically dispersed asset fleets |
DCS platforms dominate service revenue in continuous-process industries, while PLC-based architectures lead in discrete manufacturing. Edge-AI controllers represent the fastest-growing automation layer, driven by demand for low-latency, on-premises AI inference in high-precision manufacturing environments.
By End-User Industry
| Sub-Segment | Key Trend |
| Oil and Gas | Upstream digitization and integrated operations centers driving service demand |
| Automotive and Transportation | EV battery line buildouts requiring comprehensive automation overhauls |
| Industrial Automation Services Market and Biotechnology | GMP-compliant automation mandates and serialization requirements |
| Food and Beverage | Farm-to-fork traceability and hygienic-design automation standards |
| Power and Utilities | Grid modernization and renewable energy integration creating new service verticals |
Oil and Gas leads end-user demand due to the capital intensity and safety requirements of upstream and refining operations. Automotive and Transportation is the fastest-growing vertical, propelled by the global transition to electric vehicle manufacturing that demands entirely new assembly-line architectures and robotic process integration capabilities.
By Geography
| Sub-Segment | Key Trend |
| Asia-Pacific | Manufacturing digitization driven by China's industrial policy and India's PLI scheme |
| Europe | EU Green Deal compliance and energy-transition mandates |
| North America | Reshoring incentives and acute skilled-labor shortages |
| South America | Automotive and mining-sector modernization |
| Middle East & Africa | Vision 2030 industrial diversification and oil & gas downstream expansion |
Asia-Pacific retains both the largest market share and the fastest growth rate, driven by aggressive manufacturing-policy programs across China, India, and ASEAN economies. Europe and North America maintain high per-plant service spending due to mature installed bases and stringent regulatory environments.