Liquefied Natural Gas (LNG) Market Summary
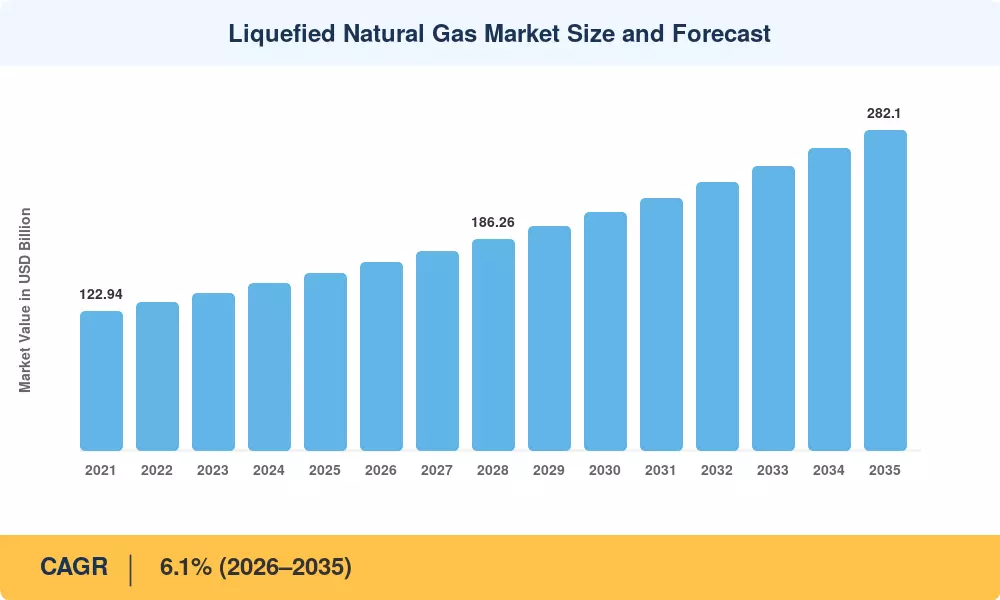
The Liquefied Natural Gas Market reached an estimated USD 155.9 billion in 2025 and is projected to grow from USD 165.5 billion in 2026 to USD 282.1 billion by 2035, registering a CAGR of 6.1% during the forecast period. Two catalysts are reshaping the trajectory of this expansion: the EU's REPowerEU plan, which triggered over USD 12 billion in new regasification infrastructure commitments since 2022, and the U.S. Department of Energy's resumed permitting of long-stalled export terminal applications in late 2024 [1]. These policy shifts have injected fresh urgency into a sector that was already riding structural demand from coal-to-gas switching across South and Southeast Asia.
The technology landscape within the Liquefied Natural Gas Market is shifting decisively away from conventional onshore baseload plants toward modular and floating solutions. Floating production units now account for a growing share of sanctioned capacity, while mid-scale and micro-scale configurations are opening inland and island markets that legacy infrastructure could never reach. Qatar's USD 28.7 billion North Field expansion — the single largest LNG project ever sanctioned — exemplifies the capital intensity still required at the top end of the value chain [2].
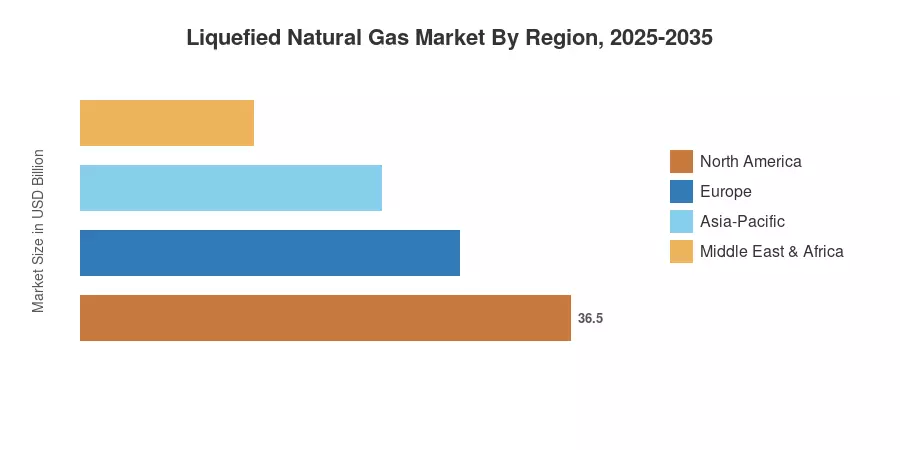
Asia-Pacific commands roughly 42% of global consumption and remains the dominant region, anchored by Japan, China, South Korea, and a rapidly scaling India. The region is simultaneously the fastest-growing, projected at a 7.3% CAGR through 2035 as emerging importers such as Vietnam, the Philippines, and Bangladesh commission their first receiving terminals. Europe holds the second-largest share at approximately 20%, driven by energy security mandates that have fundamentally redrawn its supply map since 2022. The Liquefied Natural Gas Market stands at the intersection of decarbonization ambitions and energy reliability imperatives — a dual mandate that will define its evolution over the coming decade.
Key Report Takeaways
• By Application
- Power generation accounts for an estimated 38% share of the Liquefied Natural Gas Market, sustained by coal displacement programs across Asia and peaking-plant demand in Europe.
- Marine transportation is expanding at a CAGR of 9.4%, the fastest among application segments, as fleet owners retrofit and newbuild LNG-fueled vessels to comply with tightening emissions standards.
- Industrial feedstock consumption, valued at approximately USD 29.8 billion in 2025, is concentrated in fertilizer, petrochemicals, and metals processing.
• By Infrastructure Type
- Regasification terminals represent a 34% revenue share, reflecting the rapid buildout of import capacity in Europe and South Asia.
- Liquefaction infrastructure commands the highest absolute value within the Liquefied Natural Gas Market at roughly USD 48.6 billion in 2025, driven by mega-project sanctioning in Qatar, the U.S. Gulf Coast, and Mozambique.
- LNG carriers and floating infrastructure are recording a combined CAGR of 7.8%, outpacing onshore segments.
• By Region
- Asia-Pacific leads with a 42% share of the Liquefied Natural Gas Market, underpinned by long-term offtake agreements and government-backed terminal investments.
- North America is projected to reach USD 62.1 billion by 2035, reflecting export-driven growth from U.S. and Canadian projects.
- The Middle East & Africa region is growing at a 6.8% CAGR as both production hubs and new consuming economies emerge.
Liquefied Natural Gas Market Size and Forecast (2021–2035)
Market Research Future derived all size estimates through a triangulated methodology combining top-down trade-flow analysis (GIIGNL annual reports), bottom-up capacity utilization modeling at the terminal level, and cross-validation against publicly reported contract values and shipping fixture data. Historical figures are anchored to customs and port authority records, while forecast projections incorporate sanctioned FID pipelines, policy-driven demand inflections, and contract tenor analysis.