Segmentation Quick Reference
| Dimension | Sub-Segments | Dominant Segment | Fastest Growing Segment |
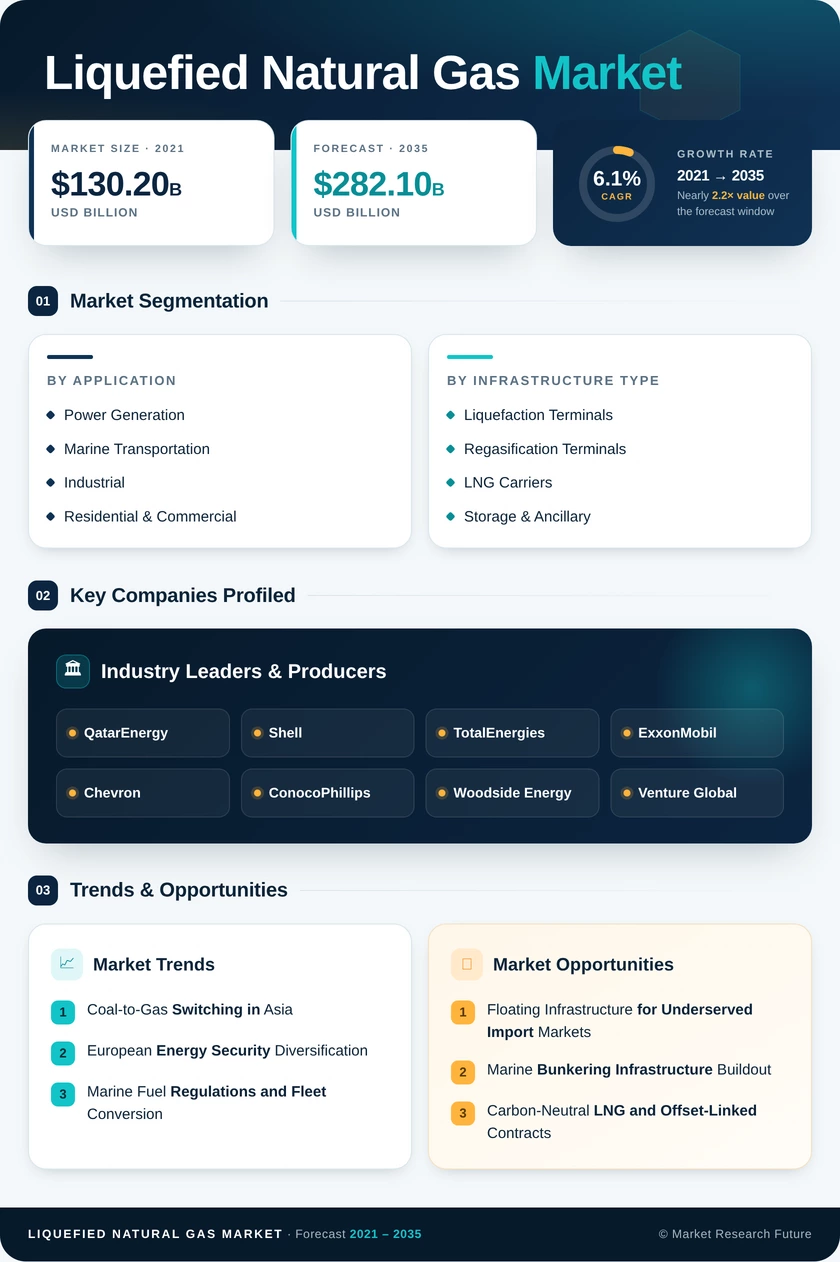
| By Application | Power Generation; Marine Transportation; Industrial; Residential & Commercial | Power Generation (38% share) | Marine Transportation (9.4% CAGR) |
| By Infrastructure Type | Liquefaction Terminals; Regasification Terminals; LNG Carriers; Storage & Ancillary | Liquefaction Terminals (USD 48.6 B) | LNG Carriers (7.8% CAGR) |
Market Segmentation Overview
By Application
| Sub-Segment | Key Trend |
| Power Generation | Coal-to-gas switching in Asia and flexible peaking demand in high-renewables grids drive sustained dominance |
| Marine Transportation | Dual-fuel vessel orderbook expansion and tightening IMO emissions standards accelerate adoption |
| Industrial | Fertilizer and petrochemical sectors anchor stable demand, particularly in South Asia and the Middle East |
| Residential & Commercial | India's city gas distribution rollout and Chinese urban gasification programs expand the end-user base |
Power generation remains the anchor application for global LNG consumption, providing both baseload and dispatchable capacity in markets undergoing rapid coal phase-out. Marine transportation is the growth story, with LNG-fueled shipping orders transforming the fuel mix of the global merchant fleet over the next decade.
By Infrastructure Type
| Sub-Segment | Key Trend |
| Liquefaction Terminals | Mega-project sanctioning cycle in Qatar, U.S. Gulf Coast, and East Africa dominates capital flows |
| Regasification Terminals | Emergency FSRU procurement in Europe and new importer buildout in Asia drive rapid unit deployment |
| LNG Carriers | Historic orderbook levels strain shipyard capacity and extend delivery timelines to 2028 and beyond |
| Storage & Ancillary | Strategic reserve mandates and peak-shaving facilities support steady but moderate growth |
Liquefaction terminals represent the highest capital intensity segment, with individual mega-projects exceeding USD 10 billion. Regasification infrastructure is seeing the broadest geographic diversification as floating solutions enable rapid market entry for first-time importers across South Asia, Southeast Asia, and Sub-Saharan Africa.