Liquefied Petroleum Gas (LPG) Market (2026 - 2035)

Liquefied Petroleum Gas (LPG) Market Size, Share & Growth Analysis Report By Source of Production (Natural Gas Liquids, Refinery-Derived LPG, Bio-LPG/Renewable Propane), By Distribution Channel (Cylinder Gas, Pipeline and Virtual Pipeline, Bulk and Retail Bulk Supply), By Application (Residential and Commercial Cooking/Heating, Petrochemical Feedstock, Autofuel/Autogas, Other Applications) and By Regional (North America, Europe, South America, Asia Pacific, Middle East and Africa) – Industry Growth & Forecast to 2035
ID: MRFR/EnP/10246-HCR
128 Pages
Anshula Mandaokar
Last Updated: July 01, 2026
Liquefied Petroleum Gas (LPG) Market
Market Size
Forecast Period2026-2035
CAGR (2026-2035)4.95%
2025 Market SizeUSD 166.82 Billion
2035 Market SizeUSD 270.46 Billion
Key Players
Saudi Aramco
Shell plc
ExxonMobil Corporation
Sinopec
Indian Oil Corporation Limited
TotalEnergies SE
Opportunities
  • Bio-LPG Scale-Up under Decarbonization Mandates
  • Virtual Pipeline Distribution in Underserved Geographies
  • Petrochemical Feedstock Diversification in the Middle East

Liquefied Petroleum Gas LPG Market Summary

The Liquefied Petroleum Gas Market reached USD 166.82 billion in 2025 and is projected to grow from USD 175.08 billion in 2026 to USD 270.46 billion by 2035, expanding at a CAGR of 4.95% during the forecast period (2026–2035). Two structural catalysts anchor this trajectory: India's Pradhan Mantri Ujjwala Yojana (PMUY) program, which has connected over 104 million below-poverty-line households to clean cooking fuel since 2016 [1], and the rapid scaling of propane dehydrogenation (PDH) capacity across China's eastern seaboard, where cumulative installed capacity exceeded 24 million tonnes by late 2024 [2].

The Liquefied Petroleum Gas Market is undergoing a major change away from conventional refinery-based supply chains. Record shale production in the Permian Basin and improved fractionation infrastructure along the U.S. Gulf Coast [3] have taken natural gas liquids processing to the forefront of upstream production. Meanwhile, bio-LPG has been identified as a feasible decarbonization pathway under the European Union’s revised Renewable Energy Directive (RED III), with biopropane being categorized as an advanced biofuel that can be double-counted towards member state targets [4].


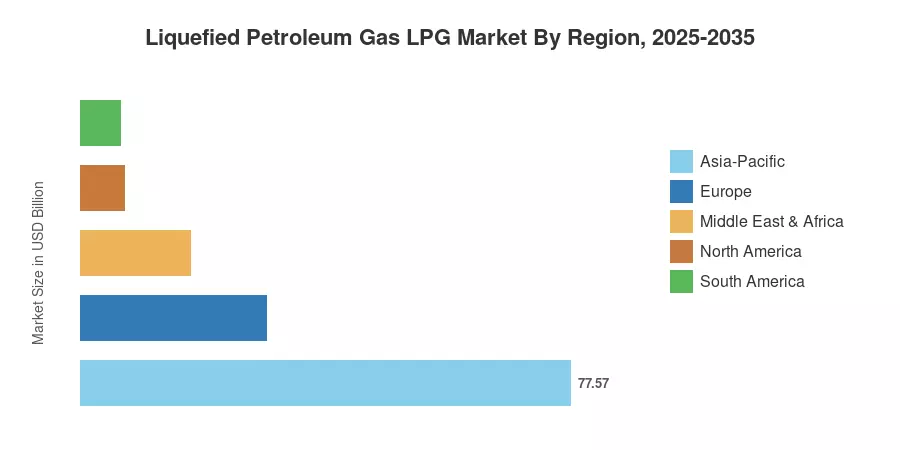
China’s petrochemical demand and India’s rural distribution expansion will drive the Asia-Pacific region to account for 46.5% of the liquefied petroleum gas market revenue in 2025. The primary export hub is North America, with shale volumes moving through Gulf Coast terminals. Europe, the No. 2 consumption region, is turning to renewable blends of propane to meet net-zero objectives. The projection period will see if the supply infrastructure can keep up with downstream demand across all three corridors.


Key Liquefied Petroleum Gas Market Takeaways

By Source of Production

  • Natural Gas Liquids held a 55.6% share of the Liquefied Petroleum Gas Market in 2025, reflecting U.S. shale fractionation dominance and Middle Eastern gas-processing expansions.
  • Bio-LPG/Renewable Propane is forecast to register the fastest CAGR of 15.8% through 2035, propelled by EU RED III mandates and biorefinery investment cycles.

By Distribution Channel

  • Cylinder Gas accounted for 52.8% of the Liquefied Petroleum Gas Market in 2025, driven by decentralized consumption across rural Asia and Sub-Saharan Africa.
  • Pipeline and Virtual Pipeline channels are projected to expand at a 9.0% CAGR to 2035 as India, Nigeria, and Brazil invest in last-mile connectivity.

By Application

  • Residential and Commercial Cooking/Heating comprised 48.4% of the Liquefied Petroleum Gas Market in 2025, sustained by subsidy programs and urbanization.
  • Petrochemical Feedstock is advancing at an 8.3% CAGR during 2026–2035, led by new PDH and steam cracker installations in East Asia.

By Geography

  • Asia-Pacific commanded a 46.5% revenue share in 2025 and is expected to post the fastest regional CAGR of 5.8% through 2035.
  • North America's export infrastructure expansions continue to shape global pricing benchmarks.


Liquefied Petroleum Gas Market Size and Forecast (2021–2035)

Market Research Future (MRFR) employs its own estimation methodology, which includes the use of national production data (IEA, EIA), customs-level trade information, downstream capacity databases, and primary interviews with terminal operators and distributors. Historical numbers are matched to reported volumes, and the forecast applies an econometric model calibrated to GDP growth, urbanization rates, petrochemical capex cycles and regulatory subsidy trajectories.
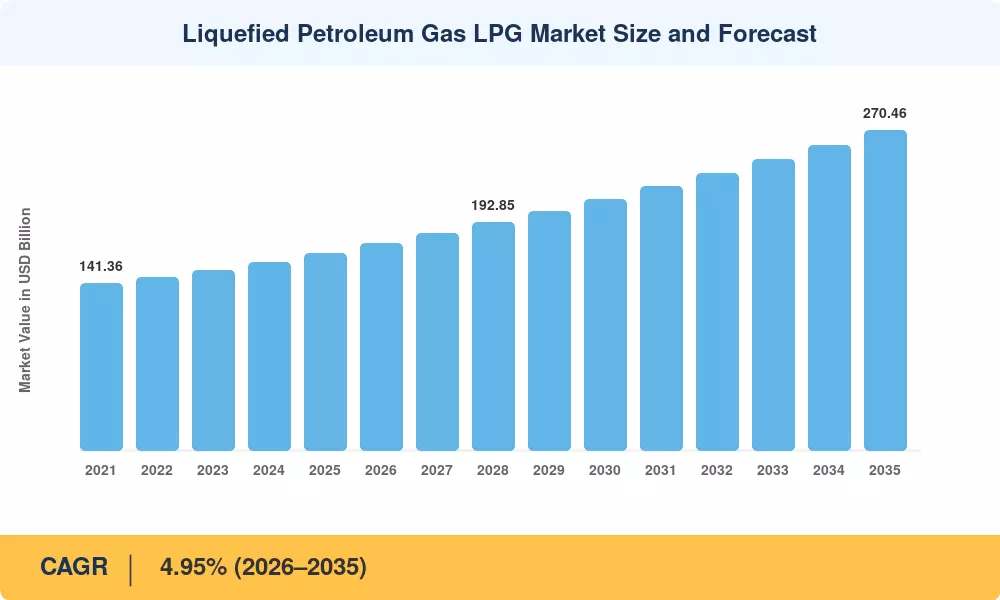
Liquefied Petroleum Gas LPG Market Size and Forecast
Our Impact
Enabled $4.3B Revenue Impact for Fortune 500 and Leading Multinationals
Partnering with 2000+ Global Organizations Each Year
30K+ Citations by Top-Tier Firms in the Industry

Driver Impact Analysis

Driver ~% Impact on CAGR Geographic Relevance Impact Timeline
Asian petrochemical feedstock expansion +1.3% Asia-Pacific Medium-term (2–4 yr)
Rural clean cooking access programs +0.9% India, Indonesia, Sub-Saharan Africa Short-term (≤2 yr)
Shale NGL supply abundance +0.7% North America Long-term (≥4 yr)
IMO 2020 marine fuel switching +0.4% Global (shipping corridors) Short-term (≤2 yr)
Bio-LPG regulatory incentives +0.3% Europe Medium-term (2–4 yr)
Autogas fleet conversion subsidies +0.2% Turkey, South Korea, Poland Medium-term (2–4 yr)
Cold-chain logistics expansion +0.2% Southeast Asia, Africa Long-term (≥4 yr)


Asian Petrochemical Feedstock Expansion

China's PDH build-out has become the single largest incremental demand driver for the Liquefied Petroleum Gas Market. By the end of 2024, the country operated approximately 24.5 million tonnes per annum of PDH capacity—up from 14 million tonnes in 2020—with another 8 million tonnes under construction across Shandong, Zhejiang, and Guangdong provinces [2]. Each new PDH unit locks in roughly 450,000–500,000 tonnes of annual propane imports, creating a structural floor under Asian spot prices and reshaping global trade flows away from the traditional Middle East–Japan corridor.

Rural Clean Cooking Access Programs

Government-subsidized cylinder distribution remains a potent growth engine. India's PMUY has disbursed initial connections to over 104 million households, and Phase-III targets an additional 10 million connections by 2027 [1]. Indonesia's "3 kg cylinder" program serves approximately 55 million low-income families, while Nigeria's National LPG Expansion Implementation Plan aims to raise per-capita consumption from 1.8 kg to 5 kg by 2030 [10]. These programs convert biomass-dependent households into recurring purchasers, expanding addressable volume at a pace that commercial demand alone could not sustain.

Shale NGL Supply Abundance

U.S. natural gas liquids production reached 6.8 million barrels per day in 2024, with the Permian Basin accounting for nearly 40% of output [3]. Enterprise Products Partners, Targa Resources, and ONEOK collectively added over 600,000 bpd of fractionation capacity along the Gulf Coast between 2022 and 2024 [11]. This export-oriented infrastructure turns North America into a swing supplier, compressing delivered costs into Asia and creating arbitrage windows that incentivize long-term offtake contracts.

IMO 2020 Marine Fuel Switching

The International Maritime Organization's global sulfur cap triggered renewed interest in LPG as a marine bunker fuel. Vessels operating on LPG propulsion emit virtually zero sulfur oxides and reduce CO₂ output by roughly 17% compared with heavy fuel oil [8]. BW LPG, the world's largest owner of very large gas carriers, began dual-fuel LPG engine retrofits in 2022, and the order book for LPG-fueled newbuilds reached 28 vessels by mid-2024 [8].


Restraints Impact Analysis

Restraint ~% Impact on CAGR Geographic Relevance Impact Timeline
Price volatility and subsidy fiscal burden –0.5% India, Indonesia, Egypt Short-term (≤2 yr)
Electrification of cooking and heating –0.4% Europe, China Long-term (≥4 yr)
Cylinder safety incidents and regulatory tightening –0.3% Sub-Saharan Africa, South Asia Medium-term (2–4 yr)
Carbon tax and emissions pricing frameworks –0.2% EU, Canada Medium-term (2–4 yr)
Port and terminal congestion bottlenecks –0.2% Asia-Pacific import hubs Short-term (≤2 yr)


Price Volatility and Subsidy Fiscal Burden

LPG import-dependent nations face recurring budget stress when global propane benchmarks spike. India's petroleum subsidy bill exceeded USD 7.5 billion in FY 2023-24, prompting the government to calibrate cylinder prices quarterly rather than absorbing full swings [12]. Indonesia and Egypt apply similar subsidy structures. When fiscal pressure forces subsidy reductions, retail prices rise and refill rates drop—particularly among below-poverty-line consumers—temporarily suppressing volume growth.

Electrification of Cooking and Heating

Induction cooking adoption in Europe and urban China represents a long-term substitution threat to the residential segment of the Liquefied Petroleum Gas Market. The European Commission's Energy Performance of Buildings Directive revision encourages heat pump deployment for space heating, gradually eroding LPG's off-grid heating niche [13]. In China, government-subsidized electric cooking appliances in Tier-1 and Tier-2 cities have already displaced measurable cylinder volumes, though rural and semi-urban markets remain LPG-dependent.

Cylinder Safety Incidents and Regulatory Tightening

Cylinder explosions in Nigeria, Bangladesh, and parts of South Asia generate periodic regulatory crackdowns that temporarily freeze distribution. Nigeria recorded over 120 cylinder-related incidents in 2023 alone, leading the Standards Organisation of Nigeria (SON) to mandate valve recertification across its installed base. This process slowed refill throughput by an estimated 8% during the compliance window [14].


Liquefied Petroleum Gas LPG Market Opportunities

Bio-LPG Scale-Up under Decarbonization Mandates

The EU's RED III framework and the UK's Renewable Transport Fuel Obligation classify biopropane as an advanced biofuel, creating margin premiums of USD 150–200 per tonne over fossil LPG [4]. Neste, SHV Energy, and several European refiners are scaling hydrotreated vegetable oil (HVO) by-product routes to produce bio-LPG at commercial volumes. By 2030, bio-LPG could capture 3–4% of European consumption, offering incumbents a pathway to preserve market share in a tightening carbon regime.

Virtual Pipeline Distribution in Underserved Geographies

Compressed and mini-bulk delivery trucks—so-called virtual pipelines—can reach communities lacking fixed pipeline infrastructure at roughly 30% lower capital intensity than conventional steel pipelines. India's City Gas Distribution (CGD) licensing rounds have opened 295 geographic areas, many of which will rely on cascaded CNG-LPG virtual pipeline solutions to achieve last-mile coverage [1]—West Africa and Southeast Asia present analogous white-space opportunities.

Petrochemical Feedstock Diversification in the Middle East

Saudi Arabia's Amiral petrochemical complex (scheduled for 2027 commissioning) and Qatar's Ras Laffan Petrochemicals project will together consume over 3 million tonnes per annum of LPG feedstock [7]. These integrated refinery-petrochemical configurations lock in captive demand and de-risk price cyclicality, providing stable offtake anchors for upstream gas-processing expansions.

Digital Supply-Chain Monetization

IoT-enabled cylinder tracking, smart metering on bulk tanks, and AI-driven demand forecasting are transforming legacy LPG distribution into data-rich platforms. Indian distributor Supergas has deployed GPS-tagged cylinders across 200,000 commercial clients, reducing delivery cycle times by 18% and cutting pilferage losses [17]. This data infrastructure opens ancillary revenue streams—usage-based insurance, predictive maintenance contracts, and micro-credit lending against consumption history.

Autogas Fleet Conversion in Emerging Economies

Turkey operates the world's fourth-largest autogas fleet (over 4.8 million vehicles), and South Korea, Poland, and Thailand maintain active LPG vehicle conversion incentive programs [9]. As emission standards in megacities tighten, autogas provides a lower-capital-cost bridge fuel compared with full electrification, particularly for taxi, ride-hailing, and light commercial vehicle fleets.


Liquefied Petroleum Gas LPG Market Future Outlook

Digital Transformation of Distribution Networks

AI-powered route optimization and IoT cylinder tracking will reduce last-mile delivery costs by an estimated 15–20% across large-scale distributors by 2030 [17]. Digital twins of terminal infrastructure—already piloted by ADNOC and Indian Oil—enable predictive maintenance that cuts unplanned downtime and improves throughput utilization.

Bio-LPG and Renewable Propane Integration

The IEA projects global bio-LPG production capacity could reach 4 million tonnes per annum by 2035 if refinery co-processing investments follow current EU policy trajectories [5]. Early movers in the Nordic countries are blending biopropane at 20–30% ratios, demonstrating drop-in compatibility that eliminates consumer switching costs.

Petrochemical Supercycle and Feedstock Locking

Cumulative global PDH capacity is expected to surpass 45 million tonnes by 2032, with roughly 70% concentrated in China and the Middle East [2]. This structural demand lock secures long-term offtake for propane, partially insulating the Liquefied Petroleum Gas Market from residential electrification headwinds.

ESG Reporting and Carbon Intensity Benchmarking

Scope 3 emissions disclosure requirements under the EU Corporate Sustainability Reporting Directive (CSRD) and the U.S. SEC climate rule will compel LPG distributors to quantify and report lifecycle carbon intensity [15]. Companies that invest in emissions-measurement infrastructure and bio-LPG blending will enjoy preferential access to institutional capital and ESG-screened procurement contracts.


Liquefied Petroleum Gas LPG Market Segmentation

By Source of Production

Segment Key Metric Primary Demand Driver
Natural Gas Liquids 55.6% share (2025) U.S. shale processing; Qatar gas expansion
Refinery-Derived LPG USD 58.72 Billion (2025) Integrated refinery operations in Asia and MEA
Bio-LPG/Renewable Propane 15.8% CAGR (2026–2035) EU RED III mandates; HVO co-processing


Natural Gas Liquids remain the backbone of the Liquefied Petroleum Gas Market supply chain, sourced predominantly from wet-gas processing plants in the Permian Basin, Qatar's North Field, and Australia's North West Shelf. The segment benefits from favorable well economics—NGL extraction improves overall gas-plant margins by 12–18% per unit of throughput [3]. Bio-LPG/Renewable Propane, while still marginal in absolute volume, commands premium pricing and regulatory preference that make it the fastest-growing source segment over the forecast horizon.

By Distribution Channel

Segment Key Metric Primary Demand Driver
Cylinder Gas 52.8% share (2025) Rural Asia and Africa have decentralized cooking demand
Pipeline and Virtual Pipeline 9.0% CAGR (2026–2035) India CGD licensing; Nigeria distribution reform
Bulk and Retail Bulk Supply USD 42.15 Billion (2025) Industrial, petrochemical, and commercial offtake


Cylinder Gas continues to dominate the Liquefied Petroleum Gas Market distribution landscape, driven by the sheer scale of decentralized household consumption in India, Indonesia, Bangladesh, and Nigeria. Average refill cycles in India have shortened from 82 days (2019) to 61 days (2024) as PMUY households increase consumption frequency [1]. Pipeline and Virtual Pipeline represent the fastest-growing channel, reflecting both fixed-pipeline expansion in India's CGD network and cascaded truck delivery in geographies where pipeline capital cannot be justified.

By Application

Segment Key Metric Primary Demand Driver
Residential and Commercial Cooking/Heating 48.4% share (2025) Subsidy programs; urbanization; off-grid heating
Petrochemical Feedstock 8.3% CAGR (2026–2035) PDH, steam cracker additions in China and MEA
Autofuel/Autogas USD 14.28 Billion (2025) Fleet conversion incentives in Turkey, South Korea
Other Applications 3.7% CAGR (2026–2035) Refrigerant gas, aerosols and agriculture


Residential and Commercial Cooking/Heating anchors nearly half of the Liquefied Petroleum Gas Market by value, sustained by subsidy-backed programs in the developing world and off-grid heating reliance in rural Europe. Petrochemical Feedstock is accelerating fastest, powered by the wave of PDH units in China and integrated complexes under construction in Saudi Arabia and the UAE [2]. The application mix is gradually rebalancing: cooking's share will erode modestly as petrochemical pull intensifies and autogas adoption grows in select corridors.


Regional Market Share Analysis

Region Key Metric Primary Investment Themes
Asia-Pacific 46.5% revenue share (2025) PDH capacity; rural cooking programs
North America 4.2% CAGR (2026–2035) Export terminal expansion; fractionation
Europe USD 29.42 Billion (2025) Bio-LPG blending; off-grid heating
South America 3.8% CAGR (2026–2035) Cylinder distribution infrastructure
Middle East & Africa USD 17.35 Billion (2025) Downstream petrochemical integration
Total USD 166.82 Billion (2025)

The Liquefied Petroleum Gas Market exhibits a pronounced Asia-centric gravity, with the Asia-Pacific region absorbing the majority of global trade flows. Regional demand profiles differ sharply: North America is a net exporter powered by shale NGL surpluses; Europe balances decarbonization pressure against off-grid heating dependence; and emerging regions in South America and Africa are in early-stage infrastructure build-out.


North America

Country Key Metric Key Driver
United States 78.4% of regional share Shale NGL fractionation and Gulf Coast exports
Canada 5.6% CAGR Western Canadian Sedimentary Basin production
Mexico USD 4.92 Billion (2025) Residential cylinder consumption and Pemex refinery output


The United States functions as a structural price-setter in the Liquefied Petroleum Gas Market, exporting over 2.2 million barrels per day of LPG and NGLs from terminals at Mont Belvieu, Marcus Hook, and Corpus Christi [3]. Canada's Pembina Pipeline and Inter Pipeline assets feed growing Asia-destined cargoes through Pacific coast terminals. Mexico remains predominantly import-dependent for its residential cylinder market, sourcing roughly 60% of supply from U.S. pipeline cross-border flows [3].

Europe

Country Key Metric Key Driver
Germany USD 4.18 Billion (2025) Off-grid heating and industrial process heat
United Kingdom 4.5% CAGR Rural heating; BioLPG blending mandates
France 18.2% of regional share Residential heating in rural zones
Italy USD 3.54 Billion (2025) Autogas fleet penetration
Spain 3.9% CAGR Industrial and commercial heating
Nordic Countries 12.8% of regional share Bio-LPG mandates and off-grid districts
Russia USD 5.10 Billion (2025) Refinery-derived volumes; domestic heating
Rest of Europe 4.1% CAGR Varied distribution maturity


Europe's Liquefied Petroleum Gas Market is shaped by the tension between decarbonization policy and the 13 million households—primarily in France, the UK, and Italy—that depend on LPG for off-grid heating [13]. The European Liquid Gas Association estimates that bio-LPG blending could displace up to 40% of fossil volumes in these applications by 2040, provided refinery co-processing capacity scales alongside HVO production [4].

Asia-Pacific

Country Key Metric Key Driver
China 35.2% of regional share PDH feedstock and residential cooking
India 6.4% CAGR PMUY rural access and refinery capacity additions
Japan USD 12.85 Billion (2025) Industrial process heat and autogas
South Korea 5.1% CAGR Petrochemical feedstock and taxi-fleet autogas
ASEAN 14.6% of regional share Indonesia and Vietnam cylinder demand
Rest of Asia-Pacific 4.8% CAGR Bangladesh and Pakistan residential growth


The Liquefied Petroleum Gas Market in Asia-Pacific benefits from dual demand anchors—China's petrochemical appetite and India's policy-driven residential expansion. China's eastern provinces alone imported approximately 28 million tonnes of LPG in 2024, predominantly through Ningbo, Dongguan, and Qingdao terminals [2]. India's Oil Marketing Companies commissioned 11 new LPG bottling plants between 2022 and 2024 to meet PMUY-driven demand [1].

South America

Country Key Metric Key Driver
Brazil 62.5% of regional share Petrobras refinery output; household cylinder demand
Argentina 4.0% CAGR Vaca Muerta shale NGL production
Rest of South America USD 2.48 Billion (2025) Distributed cylinder networks


Brazil dominates South American consumption, with Petrobras and Ultrapar controlling integrated refinery-to-cylinder value chains. Argentina's Vaca Muerta shale play is poised to shift the country from a net importer to a marginal exporter by 2030, potentially reshaping Southern Cone trade balances [18].

Middle East & Africa

Country Key Metric Key Driver
Saudi Arabia 28.4% of regional share Aramco integrated petrochemical complexes
UAE 5.9% CAGR ADNOC gas-processing expansion
South Africa USD 1.92 Billion (2025) Industrial and residential heating
Egypt 4.3% CAGR Subsidy reform; urban cylinder distribution
Rest of MEA 38.1% of regional share Nigeria, Ghana, Kenya, clean cooking initiatives


Middle Eastern producers are pivoting from pure export models toward domestic petrochemical integration, capturing higher value per molecule. In Sub-Saharan Africa, the World LPG Association's "Cooking For Life" initiative targets a fivefold increase in per-capita consumption across 15 priority nations by 2030 [10].


Liquefied Petroleum Gas LPG Market By Region, 2025-2035

Competitive Benchmarking

The Liquefied Petroleum Gas Market is moderately concentrated, with the top five players accounting for around 28-35% of the total revenue. The Herfindahl-Hirschman Index (HHI) is in the 600-900 band, indicating a fairly fragmented landscape with national oil firms, integrated majors and specialist midstream businesses. Competition relies on port access, long-term supply contracts and downstream distribution footprint.

Company Est. Revenue Share Range Key Offerings Strategic Positioning
Saudi Aramco ~8–11% Integrated upstream-to-petrochemical LPG supply Largest crude-associated LPG producer globally
Shell plc ~5–8% Global LPG trading, bio-LPG blending Leading trader with bioLPG portfolio
ExxonMobil Corporation ~5–7% NGL fractionation, export terminal operations Gulf Coast export infrastructure anchor
Sinopec ~4–7% Refinery-derived LPG; PDH feedstock China's largest domestic LPG supplier
Indian Oil Corporation Limited ~4–6% Cylinder distribution, bottling plants, pipeline India's dominant LPG distributor
TotalEnergies SE ~3–5% LPG trading, African terminal investments West Africa distribution expansion
QatarEnergy ~3–5% NGL processing, North Field LPG exports Low-cost supply from the world's largest gas field
Bharat Petroleum Corporation Limited ~2–4% Cylinder distribution, PMUY implementation Second-largest Indian LPG distributor
Phillips 66 ~2–4% NGL fractionation, midstream logistics U.S. midstream and export operations
Enterprise Products Partners LP ~2–3% Fractionation, pipelines, export terminals Largest U.S. NGL infrastructure operator


Recent News & Developments

  • QatarEnergy (February 2025): Awarded EPC contracts for the North Field South expansion, which will add 16 million tonnes per annum of LNG and associated LPG output by 2029 [7].
  • Nigerian Federal Government (July 2023): Launched the revised National LPG Expansion Plan targeting 5 kg per-capita consumption by 2030 through cylinder deposit subsidy and retail outlet licensing reforms [10].


Liquefied Petroleum Gas LPG Market Report Scope

Parameter Details
Market Scope Global Liquefied Petroleum Gas Market — production, distribution, and end-use applications
Study Period 2021–2035
CAGR (Forecast) 4.95% (2026–2035)
Market Size (2025) USD 166.82 Billion
Market Size (2035) USD 270.46 Billion
Fastest Growing Segment Bio-LPG/Renewable Propane (by source); Pipeline and Virtual Pipeline (by channel)
Companies Profiled 10 (Saudi Aramco, Shell, ExxonMobil, Sinopec, Indian Oil, TotalEnergies, QatarEnergy, Bharat Petroleum, Phillips 66, Enterprise Products)
Valuation Currency USD Billion


FAQs

How does LPG pricing correlate with crude oil and natural gas benchmarks?
LPG spot prices (Mont Belvieu, Far East Index) typically track crude oil at a 70–85% correlation but decouple during periods of high NGL fractionation output. Seasonal heating demand in Northeast Asia can add USD 50–80 per tonne premiums above parity [21].
What infrastructure investment is needed to convert a diesel fleet to autogas?
A single-vehicle LPG conversion kit costs USD 1,200–2,500 depending on engine size, with payback within 12–18 months at current fuel differentials. Fleet operators also require dedicated refueling stations, averaging USD 150,000–250,000 per installation [9].
How do carbon credits apply to bio-LPG blending in European markets?
Under RED III, each tonne of certified biopropane generates tradeable renewable fuel certificates worth EUR 200–350. Distributors blending at 20% ratios can offset compliance costs entirely against fossil LPG margins [4].
What safety certifications govern cross-border LPG cylinder trade?
ISO 22991 and EN 1442 standards regulate cylinder design, testing, and valve specifications for international commerce. Importing nations often layer additional national marks, adding 6–12 months to market-entry timelines [14].
Which emerging economies offer the highest unmet demand for LPG?
Sub-Saharan Africa—where per-capita consumption averages 1.5 kg annually versus 8 kg in Asia—presents the largest gap. Nigeria, Ethiopia, and the DRC collectively represent over 350 million potential new consumers [10].
How does PDH competitiveness compare with naphtha-based cracking for propylene production?
PDH achieves 10–15% lower cash costs than naphtha crackers when propane trades below USD 550 per tonne. Above that threshold, integrated naphtha crackers regain margin advantage [2].
What role does LPG play in off-grid cold-chain logistics for perishable goods?
LPG-powered absorption refrigeration units serve last-mile cold chains in rural India and East Africa, where grid electricity is unreliable. Operating costs run 20–30% below diesel-generator alternatives [10].    
Author
Author
Author Profile
Anshula Mandaokar LinkedIn
Team Lead - Research
Anshula Mandaokar holds an academic degree in Chemical Engineering and has been contributing to the field for more than 5 years. She has expertise in Market Research and Business Consulting and serves as a Team Lead for a reputed Market Research firm under the Chemicals and Materials domain spectrum. She has worked on multiple projects, generating explicit results in a quick turnaround time. Her understanding of data interpretation justifies her role as a leader.

Research Approach


Secondary Research

The secondary research process involved comprehensive analysis of energy regulatory databases, industry publications, government statistical repositories, and authoritative energy organizations. Key sources included the US Energy Information Administration (EIA), International Energy Agency (IEA), Organization of the Petroleum Exporting Countries (OPEC), Gas Technology Institute (GTI), World LPG Association (WLPGA), US Department of Energy (DOE), International Gas Union (IGU), National Propane Gas Association (NPGA), European LPG Association (AEGPL), China Petroleum and Chemical Industry Federation (CPCIF), Petroleum Planning & Analysis Cell (PPAC) India, BP Statistical Review of World Energy, International Monetary Fund (IMF) Energy Data, UN Energy Statistics Database, World Bank Energy & Extractives Open Data, and national energy ministry reports from key markets including Saudi Arabia, India, China, and Brazil. These sources were used to collect production statistics, consumption trends, import/export data, pricing dynamics, infrastructure development metrics, and regulatory policy analysis for refinery-sourced LPG, associated gas, non-associated gas, and application segments across residential, commercial, industrial, agricultural, and transportation sectors.


Primary Research

In order to gather both qualitative and quantitative insights, supply-side and demand-side stakeholders were interviewed during the primary research process. CEOs, VPs of Operations, heads of regulatory affairs, and commercial directors from LPG manufacturers, refiners, midstream logistics companies, and OEMs were examples of supply-side sources. Procurement heads from petrochemical factories, fleet operators, agricultural processing facilities, residential distributors, and energy procurement leads from businesses and governmental organizations were examples of demand-side sources. In addition to gathering information on supply chain dynamics, pricing volatility drivers, and infrastructure investment trends, primary research verified capacity development timetables and validated market segmentation.

Primary Respondent Breakdown:

By Designation: C-level Primaries (28%), Director Level (32%), Others (40%)

By Region: North America (28%), Europe (32%), Asia-Pacific (35%), Rest of World (5%)


Market Size Estimation

Global market valuation was derived through volume mapping and pricing analysis across the value chain. The methodology included:

Identification of 50+ key producers and marketers across North America, Europe, Asia-Pacific, Middle East, and Latin America

Source mapping across refinery, associated gas, and non-associated gas production categories

Application mapping across residential, commercial, industrial, agricultural, transportation, and other end-use segments

Analysis of reported and modeled annual revenues specific to LPG portfolios

Coverage of producers and distributors representing 75-80% of global market share in 2024

Extrapolation using bottom-up (consumption volume × regional pricing by country) and top-down (producer revenue validation) approaches to derive segment-specific valuations

Download Free Sample

Kindly complete the form below to receive a free sample of this Report

Download PDF ×

We do not share your information with anyone. However, we may send you emails based on your report interest from time to time. You may contact us at any time to opt-out.
















