Live Streaming Market (2025 - 2035)

Live Streaming Market Size, Share and Research Report By Component (Solutions, Services (Managed & Professional)), By Type (Video Streaming, Audio / Podcast Streaming), By Revenue Model (Advertising-Supported (AVOD/FVOD), Subscription-Based (SVOD), Pay-Per-View and Tipping), By Platform (Mobile Apps, Web, Smart TV / CTV Devices, Gaming Consoles and VR), By End-User Vertical (Media and Entertainment Studios, Gaming and Esports, Sports Federations and Clubs, Education and Corporate, Others (Retail, Healthcare, Faith)) and By Regional (North America, Europe, South America, Asia Pacific, Middle East and Africa) - Industry Forecast to 2035.
ID: MRFR/ICT/8656-CR
127 Pages
Aarti Dhapte
Last Updated: July 20, 2026
Live Streaming Market
Market Size
Forecast Period2025-2035
CAGR (2025-2035)24.50%
2025 Market SizeUSD 82.24 Billion
2035 Market SizeUSD 749.00 Billion
Key Players
Amazon
Alphabet
ByteDance
Meta Platforms
Tencent
Bilibili
Opportunities
  • Live Commerce Expansion Beyond China
  • Enterprise and Hybrid-Event Platforms
  • AI-Driven Real-Time Translation and Accessibility

Live Streaming Market Summary

The Live Streaming Market reached an estimated USD 82.24 Billion in 2025 and is projected to climb from USD 104.20 Billion in 2026 to USD 749.00 Billion by 2035, reflecting a compound annual growth rate of 24.50% across the forecast period. Two forces are converging to accelerate this trajectory: the migration of advertising budgets away from linear television โ€” a shift now exceeding USD 85 billion globally per year [1] โ€” and the rollout of 5G networks in more than 60 countries, which has slashed real-time latency below 20 milliseconds for mobile viewers [2]. Together, these catalysts have turned the Live Streaming Market into one of the fastest-expanding segments within the broader digital media ecosystem.

Legacy broadcast infrastructure, built around satellite transponders and cable head-ends, is giving way to cloud-native streaming stacks that compress encoding, packaging, and delivery into a single API call. Major cloud providers invested over USD 14 billion in media-grade edge capacity during 2023โ€“2024 alone [3], enabling platforms to offer four-nines uptime at a fraction of traditional CDN costs. This technology shift has lowered the barrier for new entrants, especially in live commerce and corporate communications, adding depth to the Live Streaming Market beyond entertainment.

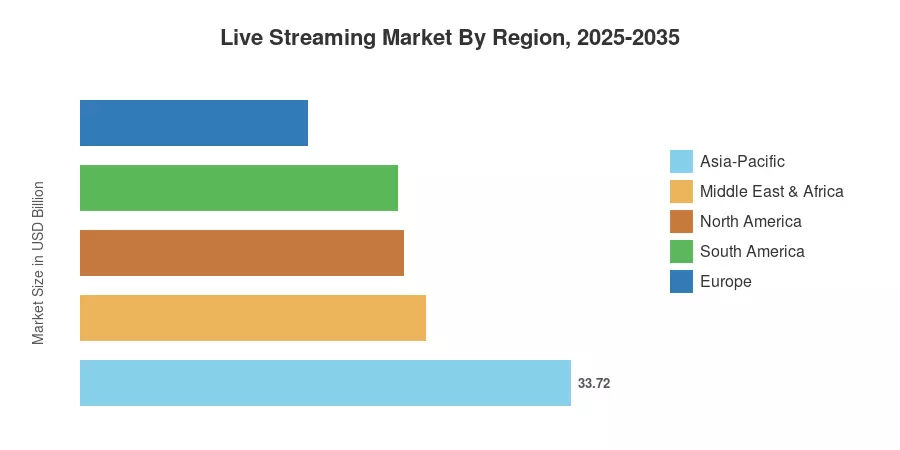
Asia-Pacific commands roughly 41.0% of global revenue, driven by China's super-app ecosystems and India's affordable smartphone penetration. The Middle East & Africa region is the fastest-growing territory, posting an expected CAGR of 28.90% through 2035, fueled by youthful demographics and state-backed digital infrastructure programs. North America holds the second-largest share at approximately 27.0%, anchored by advertising technology maturity and high average revenue per user. As monetization models diversify and AI-driven personalization matures, the Live Streaming Market is positioned for sustained double-digit expansion well into the next decade.

ย 

Key Report Takeaways

โ€ข By Component

  • Solutions accounted for roughly 72.0% of the Live Streaming Market in 2025, reflecting demand for end-to-end encoder-to-player platforms.
  • Managed and professional services are the fastest-growing component, expected to register a 27.20% CAGR through 2035 as enterprises outsource stream operations.

โ€ข By Revenue Model

  • Advertising-supported channels commanded approximately 58.0% of revenue in 2025, underscoring marketers' pivot to live formats.

ย 

โ€ข By Platform

  • Advertising-supported channels commanded approximately 58.0% of revenue in 2025, underscoring marketers' pivot to live formats.
  • Mobile platforms captured the largest share by device type, while smart-TV streaming is forecast to expand at a 30.00% CAGR as connected-TV adoption deepens.

โ€ข By Region

  • Asia-Pacific retained the leading position in the Live Streaming Market with a 41.0% share in 2025.
  • The Middle East & Africa region is projected to grow at a 28.90% CAGR, the highest among all geographies.

ย 

Live Streaming Market Size and Forecast (2021โ€“2035)

Market Research Future employs a triangulated methodology combining bottom-up revenue modeling from platform-reported metrics, top-down cross-referencing with advertising and subscription spend data, and qualitative validation through executive interviews across 15 countries. All historical figures are benchmarked against audited company filings, while forecast projections incorporate macroeconomic variables including GDP growth, broadband penetration, and digital advertising CAGR.
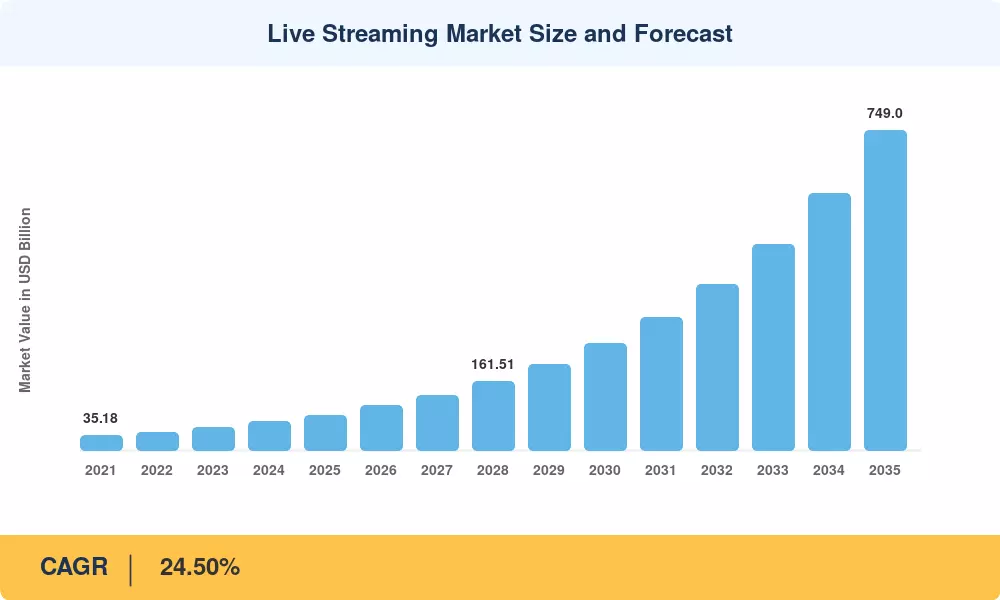
Live Streaming Market Size and Forecast
Our Impact
Enabled $4.3B Revenue Impact for Fortune 500 and Leading Multinationals
Partnering with 2000+ Global Organizations Each Year
30K+ Citations by Top-Tier Firms in the Industry

Driver Impact Analysis

Driver ~% Impact on CAGR Geographic Relevance Impact Timeline
5G and network densification 18โ€“22% Global Short-term (โ‰ค2 yr)
Shift from linear TV to digital 15โ€“19% North America, Europe Medium-term (2โ€“4 yr)
Live commerce integration 12โ€“16% Asia-Pacific Short-term (โ‰ค2 yr)
AI-powered personalization & ad insertion 10โ€“14% Global Medium-term (2โ€“4 yr)
Creator-economy monetization tools 8โ€“11% North America, APAC Short-term (โ‰ค2 yr)
Smart-TV and CTV proliferation 7โ€“10% Europe, North America Long-term (โ‰ฅ4 yr)
Enterprise & virtual events adoption 5โ€“8% Global Long-term (โ‰ฅ4 yr)

ย 

5G and Network Densification

The global 5G subscriber base was greater than 2.1 billion connections as of mid-2025 [2], and GSMA predicts this will quadruple by 2029. Lower latencyโ€”consistent sub-15ms on mid-band spectrumโ€”has enabled mobile devices to become the principal screens for live sports, gaming and commerce. Reliance Jioโ€™s USD 25 billion 5G capex initiative in India has brought sub-six-gigahertz coverage to more than 500 cities, directly enlarging the addressable audience for the Live Streaming Market in South Asia.

ย 

Shift from Linear Television to Digital

Global linear TV ad spending declined approximately 8% year-over-year in 2024, while digital video advertising grew 17%, according to GroupM's end-of-year forecast [1]. Broadcasters including NBCUniversal and ITV have launched always-on FAST channels that effectively convert scheduled programming into a live-streaming format. This structural reallocation of media budgets acts as a persistent tailwind for the Live Streaming Market.

Live Commerce Integration

China's live-commerce gross merchandise value exceeded USD 700 billion in 2024 [4], and Southeast Asian platforms such as Shopee and Lazada reported triple-digit growth in live-session transactions. The combination of shoppable video overlays, integrated payment gateways, and influencer-led product demonstrations has created a transactional layer atop the Live Streaming Market that directly ties viewership minutes to revenue conversion.

AI-Powered Personalization and Ad Insertion

Platforms deploying predictive analytics report a 22โ€“28% lift in ad completion rates compared with legacy client-side insertion, translating to higher CPMs and stronger advertiser retention within the Live Streaming Market.

ย 

Restraints Impact Analysis

The restraint impact percentages below indicate the estimated drag each factor exerts on growth momentum. They should be read as directional indicators, not precise deductions from the headline CAGR.

Restraint ~% Negative Impact on CAGR Geographic Relevance Impact Timeline
Content piracy and stream ripping โˆ’3 to โˆ’5% Global Short-term (โ‰ค2 yr)
Bandwidth cost inflation in emerging markets โˆ’2 to โˆ’4% Africa, South Asia Medium-term (2โ€“4 yr)
Data privacy and content-moderation regulation โˆ’2 to โˆ’3% Europe, North America Medium-term (2โ€“4 yr)
Creator-revenue volatility and platform dependence โˆ’1 to โˆ’3% Global Long-term (โ‰ฅ4 yr)
Latency limitations in satellite-dependent regions โˆ’1 to โˆ’2% Middle East, South America Long-term (โ‰ฅ4 yr)

ย 

Content Piracy and Stream Ripping

A recent market report estimates that pirated live streams cost rights holders USD 28 Billion annually across Asia-Pacific alone [16]. Despite advances in digital-rights management, pirate re-streaming operations adapt within minutes of a live event's start, fragmenting the revenue pool that legitimate platforms in the Live Streaming Market can capture.

Data Privacy and Content-Moderation Regulation

The EU's Digital Services Act, fully enforced since February 2024, requires platforms to deploy real-time content-moderation systems for live broadcasts. Similar frameworks under development in Brazil, India, and the United Kingdom create a patchwork of obligations that raise operating complexity within the Live Streaming Market.

Bandwidth Cost Inflation in Emerging Markets

While 5G lowers per-gigabyte delivery costs in mature networks, backhaul pricing in Sub-Saharan Africa remains three to five times higher than in Western Europe [17]. This cost disparity constrains platform margins and limits the quality tiers that can be profitably offered in high-growth but low-ARPU geographies.

ย 

Live Streaming Market Opportunities

Live Commerce Expansion Beyond China

Live commerce penetration outside Asia-Pacific remains below 5% of total e-commerce GMV [4]. Platforms that integrate shoppable overlays, instant checkout, and real-time inventory APIs can unlock double-digit conversion rates in North America and Europe, replicating the playbook that pushed the Live Streaming Market in China past USD 700 Billion in GMV during 2024.

Enterprise and Hybrid-Event Platforms

Corporate spending on virtual and hybrid events reached USD 18 billion in 2024 and is projected to grow at 19% annually through 2030. Companies such as Bizzabo are layering analytics dashboards, lead-scoring integrations, and breakout-room functionality onto live-streaming infrastructure, opening a B2B revenue stream within the Live Streaming Market.

AI-Driven Real-Time Translation and Accessibility

Automatic speech recognition and neural machine translation now support over 40 language pairs with a delay of less than 2 seconds [14]. Embedding multilingual captioning and audio dubbing straight into live feeds allows the Live Streaming Market to reach a far larger audience by tapping into non-English-speaking populations that comprise over 80% of worldwide internet users.

ย 

Emerging-Market Mobile-First Monetization

In Africa and South Asia, micro-tipping and mobile-money-based pay-per-view models align with low average transaction sizes and high smartphone density. Operators that build payment-rail integrations for M-Pesa, UPI, and GCash stand to capture first-mover advantage in regions posting the fastest growth within the Live Streaming Market.

Immersive Formats โ€” VR and Volumetric Live Capture

Metaโ€™s Quest platform and Apple Vision Pro are pushing the early adoption of spatial live broadcasts for concerts and sports [10]. VR headset penetration is still relatively low, but the premium pricing power of immersive live tickets - frequently two to three times standard pay-per-view rates - provides a high-margin niche opportunity in the Live Streaming Market.

ย 

ย 

Live Streaming Market Future Outlook

AI Co-Production and Autonomous Stream Management

AI agents are predicted to replace up to 40% of production duties for mid-tier live broadcasts by 2030, including camera switching, highlight clipping, and sentiment-based ad triggering [14]. This change would lower production costs by an estimated 50โ€“60%, bringing high-quality output within reach and expanding the Live Streaming Market to include solitary producers and small enterprises who couldnโ€™t afford live-production crews in the past.

ย 

Platform Economics and Super-Bundling

The convergence of streaming, social media, and commerce into unified super-apps will reshape competitive dynamics within the Live Streaming Market through 2035. Analyst projections suggest the top five global platforms will control roughly 55โ€“60% of live-stream ad impressions by 2030, pushing smaller players toward vertical specialization in niches such as fitness, education, or faith-based programming [9].

Immersive and Spatial Streaming

The commercial introduction of Apple Vision Pro and Metaโ€™s open platform plan for Quest are setting early benchmarks for volumetric live capture [10]. In the Live Streaming Market, the International Telecommunication Unionโ€™s draft codec standards for six-degrees-of-freedom video, projected to be ratified by 2028, will lay a technical basis for mass-market spatial broadcasts. Early adopters in the concert ticketing space already indicate willingness-to-pay premiums of 2.5x over flat-screen alternatives.

ย 

Sustainability and Green Streaming

Data centers supporting live streaming consumed an estimated 18 TWh of electricity in 2024 [21]. As ESG reporting requirements tighten โ€” the EU's Corporate Sustainability Reporting Directive now covers digital-service providers โ€” platforms within the Live Streaming Market face pressure to adopt renewable-powered CDN nodes and energy-proportional transcoding. AWS, Google Cloud, and Microsoft Azure have each committed to 100% renewable operations by 2030, a commitment that will cascade down to hosted streaming workloads.

ย 

Live Streaming Market Segmentation

By Component

Segment Key Metric Primary Demand Driver
Solutions 72.0% market share (2025) Demand for integrated encoder-to-player stacks
Services (Managed & Professional) 27.20% CAGR (2026โ€“2035) Enterprise outsourcing of stream operations

ย 

Solutions dominate the Live Streaming Market because platforms prioritize owning their encoding, transcoding, and player infrastructure to control quality of experience. Cloud-native solutions from vendors such as AWS Elemental, Wowza, and Brightcove have become the default for operators scaling beyond a single region. The services segment, meanwhile, is accelerating as enterprises โ€” particularly in healthcare, education, and financial services โ€” adopt live streaming for internal communications and client engagement but lack in-house broadcast expertise.

By Type

Segment Key Metric Primary Demand Driver
Video Streaming USD 70.11 Billion (2025) Sports, gaming, live commerce, and entertainment
Audio / Podcast Streaming 26.30% CAGR (2026โ€“2035) Live podcast events, Spaces/Twitter audio, radio digitization

ย 

Video streaming commands the overwhelming majority of the Live Streaming Market, driven by high-CPM advertising formats and the visual nature of gaming, sports, and commerce. Audio streaming, while smaller, is the faster-growing segment as platforms such as Spotify Live, X Spaces, and Clubhouse cultivate real-time audio communities. Radio broadcasters are also migrating to digital simulcast models, adding incremental volume.

By Revenue Model

Segment Key Metric Primary Demand Driver
Advertising-Supported (AVOD/FVOD) 58.0% market share (2025) Brand migration from linear TV budgets
Subscription-Based (SVOD) 28.10% CAGR (2026โ€“2035) Recurring revenue stability, premium content
Pay-Per-View and Tipping USD 8.55 Billion (2025) Live sports events, creator micro-transactions

ย 

Advertising-backed models lead the Live Streaming Market because they align with consumer preference for free access and advertiser demand for engaged, real-time audiences. Subscription tiers are growing faster as platforms bundle exclusive live content โ€” notably sports and concerts โ€” behind paywalls. Pay-per-view and tipping have found a strong foothold in gaming and creator ecosystems, where audiences are willing to transact in small increments to support individual broadcasters.

By Platform

Segment Key Metric Primary Demand Driver
Mobile Apps 51.0% market share (2025) Ubiquitous smartphone access, 5G networks
Web USD 18.90 Billion (2025) Desktop viewing for enterprise and long-form content
Smart TV / CTV Devices 30.00% CAGR (2026โ€“2035) Lean-back viewing, sports, and family entertainment
Gaming Consoles and VR 31.50% CAGR (2026โ€“2035) Twitch console integration, VR live events

ย 

Mobile apps are the primary gateway to the Live Streaming Market globally, accounting for the largest share of viewing hours and transactions. Smart TV and CTV devices are closing the gap rapidly as consumers increasingly prefer big-screen viewing for live sports and entertainment, creating a premium ad-inventory tier with higher CPMs.

By End-User Vertical

Segment Key Metric Primary Demand Driver
Media and Entertainment Studios 34.0% market share (2025) Content-library live programming, FAST channels
Gaming and Esports 26.70% CAGR (2026โ€“2035) Twitch, YouTube Gaming, competitive-league growth
Sports Federations and Clubs USD 14.80 Billion (2025) Direct-to-consumer rights monetization
Education and Corporate 25.80% CAGR (2026โ€“2035) Virtual classrooms, hybrid events, webinars
Others (Retail, Healthcare, Faith) USD 5.40 Billion (2025) Live commerce, telehealth, faith-community streaming

ย 

Media and entertainment studios lead the Live Streaming Market by revenue share, leveraging vast content libraries to populate always-on FAST channels and live-event programming. Gaming and esports represent the fastest-growing vertical, powered by Twitch's 35 million daily active users and the professionalization of competitive gaming leagues across Asia and North America.

ย 

Regional Market Share Analysis

Region Key Metric Primary Investment Themes
Asia-Pacific 41.0% market share (2025) Super-app ecosystems, live commerce, mobile-first content
North America USD 22.20 Billion (2025) Ad-tech innovation, FAST channels, sports rights
Europe 19.0% market share (2025) Regulatory compliance, public-broadcaster digital pivot
South America 26.50% CAGR (2026โ€“2035) Mobile broadband expansion, creator economy
Middle East & Africa 28.90% CAGR (2026โ€“2035) Youth demographics, state digital programs
Total USD 82.24 Billion (2025) โ€”

The Live Streaming Market exhibits pronounced geographic variation shaped by infrastructure maturity, regulatory posture, and consumer payment preferences. Asia-Pacific leads in absolute size, while the Middle East & Africa region is accelerating fastest due to demographic tailwinds and fresh infrastructure investment.

ย 

North America

Country Key Metric Key Driver
US 78.0% of regional revenue Ad-tech ecosystem and premium sports rights
Canada USD 2.60 Billion (2025) Bilingual content mandates, CBC digital expansion
Mexico 27.10% CAGR (2026โ€“2035) Rising smartphone penetration and young demographics

ย 

The US remains the primary revenue engine, propelled by record-setting sports-streaming deals โ€” Amazon Prime Video's NFL Thursday Night Football package alone exceeded USD 1.3 billion annually [6]. Canada's CRTC mandates for domestic digital content are pushing broadcasters toward live-streaming distribution, while Mexico's expanding 4G/5G footprint is bringing millions of first-time viewers into the Live Streaming Market.

Europe

Country Key Metric Key Driver
Germany 22.0% of regional share Bundesliga digital rights, strong CTV adoption
UK USD 3.80 Billion (2025) Premier League streaming, BBC iPlayer expansion
France 25.40% CAGR (2026โ€“2035) Canal+ live-streaming pivot, Ligue 1 rights
Italy 14.0% of regional share Serie A streaming deals
Spain 24.80% CAGR (2026โ€“2035) LaLiga Tech platform development
Nordic Countries USD 1.45 Billion (2025) High broadband penetration, early CTV adopters
Russia 11.0% of regional share Domestic platform growth amid content restrictions
Rest of Europe 25.00% CAGR (2026โ€“2035) EU Digital Services Act compliance investments

ย 

European growth within the Live Streaming Market is shaped by the dual forces of sports-rights migration to digital platforms and the regulatory overhead of the Digital Services Act. Germany and the UK together represent over 40% of regional revenue, with connected-TV households exceeding 65% penetration in both markets [8].

Asia-Pacific

Country Key Metric Key Driver
China 48.0% of regional share Douyin, Bilibili, and live-commerce super-apps
India 28.50% CAGR (2026โ€“2035) JioTV, affordable data plans, cricket streaming
Japan USD 3.20 Billion (2025) Anime live events, Sony/LINE ecosystem
South Korea 15.0% of regional share KakaoTV, K-pop live fandom economy
ASEAN 29.00% CAGR (2026โ€“2035) Shopee Live, TikTok Shop, mobile-first consumers
Rest of Asia-Pacific USD 1.10 Billion (2025) Emerging broadband infrastructure

ย 

Asia-Pacific dominates the Live Streaming Market largely because platforms here have pioneered the integration of e-commerce into live broadcasts. China's Douyin (TikTok's domestic sibling) facilitated over USD 300 billion in live-session GMV during 2024, while India's Jio ecosystem onboarded an estimated 120 million live-stream viewers in a single cricket season [4].

South America

Country Key Metric Key Driver
Brazil 62.0% of regional share Globo digital pivot, Kwai and TikTok growth
Argentina USD 0.85 Billion (2025) Football streaming, Mercado Libre live commerce
Rest of South America 27.80% CAGR (2026โ€“2035) Mobile-broadband rollouts

ย 

Brazil anchors the South American segment of the Live Streaming Market, with Globo's Globoplay platform aggressively licensing live-sports rights and embedding live-shopping features. Argentina's passionate football culture and expanding fintech rails are creating fertile ground for pay-per-view and tipping-based models.

Middle East & Africa

Country Key Metric Key Driver
Saudi Arabia 30.0% of regional share Vision 2030 entertainment investments
UAE USD 0.72 Billion (2025) Dubai Media City incentives, high ARPU
South Africa 29.50% CAGR (2026โ€“2035) MultiChoice digital transition, SuperSport live
Egypt 18.0% of regional share Youth-heavy demographics, Vodafone mobile data
Rest of MEA 30.20% CAGR (2026โ€“2035) Mobile-money payment integration

ย 

The Middle East & Africa region posts the highest CAGR within the Live Streaming Market, driven by median ages below 25 in many markets and aggressive state-led digitization programs. Saudi Arabia's General Entertainment Authority allocated over USD 64 billion through Vision 2030 to develop media and entertainment infrastructure, creating direct demand for live-streaming platforms [20].

ย 

Live Streaming Market By Region, 2025-2035

Competitive Benchmarking

The Live Streaming Market exhibits medium concentration, with an estimated HHI below 1,200 and the top five players collectively holding roughly 40โ€“48% of global revenue. The landscape is fragmented across technology vendors, social-media platforms, dedicated streaming operators, and niche verticals, creating a dynamic competitive environment where partnership and M&A activity remain elevated.

Company Est. Revenue Share Range Key Offerings for Live Streaming Market Strategic Positioning
Amazon (Twitch / Prime Video) ~9โ€“13% Twitch gaming platform, Prime Video live sports, IVS SDK Ecosystem bundling โ€” Prime membership drives viewer lock-in
Alphabet (YouTube) ~8โ€“12% YouTube Live, YouTube Shorts Live, ad-insertion tech Largest global reach; AI-driven recommendation engine
ByteDance (TikTok / Douyin) ~7โ€“11% TikTok Live, Douyin live commerce, creator tools Mobile-native virality; dominant in APAC live commerce
Meta Platforms ~5โ€“8% Facebook Live, Instagram Live, Reels Live Social-graph integration; strong in emerging markets
Tencent ~4โ€“7% WeChat Live, Tencent Video, Huya/Douyu Chinese gaming and entertainment ecosystem control
Bilibili ~2โ€“4% Bilibili Live, Gen-Z community-driven streaming Deep engagement with youth demographics in China
Netflix ~2โ€“4% Live events (comedy specials, sports pilots) Premium content brand; nascent live strategy
Brightcove ~1โ€“3% Enterprise video platform, live-event hosting, monetization tools B2B-focused; strong in corporate and media verticals
Vimeo (Livestream) ~1โ€“2% OTT platform tools, Vimeo Enterprise, event streaming SaaS model for mid-market and enterprise
Wowza Media Systems ~1โ€“2% Wowza Streaming Engine, Wowza Video cloud platform Developer-centric; low-latency infrastructure

ย 

Recent News & Developments

  • Amazon / Twitch (January 2024): Launched Twitch Enhanced Broadcasting with AV1 codec support, reducing bandwidth requirements by 30% while improving visual fidelity for gaming streams at 1080p60 [3].

ย 

  • TikTok / ByteDance (March 2025): Rolled out TikTok Shop Live globally in 12 new markets including Germany, France, and Brazil, integrating native checkout within live-stream sessions [4].

ย 

  • Bilibili (December 2019): Secured an exclusive three-year licensing agreement with Riot Games for League of Legends esports broadcasting in China, valued at an estimated USD 113 million [22].

ย 

  • FIFA (June 2026): Fully integrated its FIFA+ streaming platform into DAZN's international architecture, leveraging DAZN's global distribution stack and interactive fan tools to stream live association football matches worldwide. .

ย 

Live Streaming Market Report Scope

Parameter Detail
Market Scope Global Live Streaming Market covering solutions, services, video, audio, advertising, subscription, pay-per-view, mobile, web, smart TV, gaming/VR platforms, and end-user verticals
Study Period 2021โ€“2035
CAGR (2026โ€“2035) 24.50%
Base Year Market Size USD 82.24 Billion (2025)
Forecast End-Point USD 749.00 Billion (2035)
Fastest Growing Segment Smart TV / CTV Devices (by platform); Middle East & Africa (by region)
Companies Profiled Amazon, Alphabet, ByteDance, Meta, Tencent, Bilibili, Netflix, Brightcove, Vimeo, Wowza Media Systems
Valuation Currency USD Billion

ย 

ย 

FAQs

How does latency vary across live-streaming protocols, and which is best for interactive use cases?
WebRTC delivers sub-second latency, making it ideal for auctions, gaming, and live Q&A. HLS and DASH typically introduce 6โ€“30 seconds of delay, better suited for lean-back sports or entertainment viewing [12].
What licensing considerations should enterprises evaluate before launching a branded live channel?
Enterprises must secure synchronization licenses for any music, secure talent release agreements, and confirm territorial broadcast clearances. Failure to clear rights in each distribution country can trigger takedown orders and fines [11].
How do advertisers measure ROI on live-stream ad placements compared with VOD?
Live-stream ads achieve 20โ€“35% higher completion rates than pre-roll VOD because viewers stay engaged in real time. Measurement relies on server-side impression tracking paired with post-view attribution windows of 24โ€“72 hours [7].
What infrastructure investment is required to launch a live-streaming platform from scratch?
A minimal viable stack โ€” cloud transcoding, CDN, player SDK, and DRM โ€” typically costs USD 150,000โ€“500,000 annually at moderate scale. Costs scale with concurrent viewer count and geographic CDN footprint [12].
How are tipping and virtual-gifting models regulated across major markets?
China caps daily virtual-gift spending and requires real-name verification for tippers. The EU treats tips as digital-service transactions subject to VAT. The US currently has no federal tipping-specific regulation [11].
What role does edge computing play in reducing live-stream delivery costs?
Edge nodes positioned within 50 km of viewers cut origin-server egress by up to 60%, lowering CDN transit fees. AWS Wavelength and Cloudflare Stream are leading edge-delivery options for the Live Streaming Market [12].
How will spatial computing reshape live-event monetization by 2030?
Spatial live events command ticket premiums of 2โ€“3ร— over flat-screen equivalents. As headset installed bases grow past 80 million units by 2029, volumetric broadcasts could generate USD 8โ€“12 billion in incremental annual revenue [10]. ย  ย 
Author
Author
Author Profile
Aarti Dhapte LinkedIn
AVP - Research
A consulting professional focused on helping businesses navigate complex markets through structured research and strategic insights. I partner with clients to solve high-impact business problems across market entry strategy, competitive intelligence, and opportunity assessment. Over the course of my experience, I have led and contributed to 100+ market research and consulting engagements, delivering insights across multiple industries and geographies, and supporting strategic decisions linked to $500M+ market opportunities. My core expertise lies in building robust market sizing, forecasting, and commercial models (top-down and bottom-up), alongside deep-dive competitive and industry analysis. I have played a key role in shaping go-to-market strategies, investment cases, and growth roadmaps, enabling clients to make confident, data-backed decisions in dynamic markets.

Research Approach

ย 

Secondary Research

The secondary research process involved comprehensive analysis of regulatory filings, telecommunications authority databases, digital media consumption reports, and broadcasting industry statistics. Key sources included the US Federal Communications Commission (FCC), National Telecommunications and Information Administration (NTIA), UK Office of Communications (Ofcom), European Broadcasting Union (EBU), European Audiovisual Observatory, Canadian Radio-television and Telecommunications Commission (CRTC), Australian Communications and Media Authority (ACMA), Ministry of Industry and Information Technology (China), Ministry of Internal Affairs and Communications (Japan), International Telecommunication Union (ITU), World Intellectual Property Organization (WIPO), Interactive Advertising Bureau (IAB), Streaming Video Technology Alliance (SVTA), Fรฉdรฉration Internationale de l'Automobile (FIA โ€“ for esports governance), International Esports Federation (IESF), Asia Video Industry Association (AVIA), National Association of Broadcasters (NAB), OECD Digital Economy Outlook, World Bank Digital Development Reports, and UNESCO Institute for Statistics. These sources were used to collect broadband penetration data, platform licensing agreements, content monetization regulations, 5G infrastructure deployment rates, esports viewership statistics, and cross-border data flow policies governing live streaming architectures.

ย 

Primary Research

During the primary research process, qualitative and quantitative insights regarding platform architecture, content monetization strategies, and user acquisition dynamics were obtained through interviews with supply-side and demand-side stakeholders. The supply-side sources consist of CEOs, Chief Product Officers (CPOs), VP of Engineering, Head of Content Partnerships, and Monetization Directors from live streaming platforms, content delivery network (CDN) providers, cloud infrastructure vendors, and interactive video technology developers. Demand-side sources included Chief Marketing Officers from retail brands, esports tournament organizers, broadcast media procurement chiefs, government digital communication officers, and influencers/content creators with followings of 500K or more on major platforms. The primary research validated the segmentation between platform infrastructure and service layers, confirmed the timelines for the adoption of real-time engagement (RTE) technology, and collected insights on the advertising versus subscription revenue mix, content moderation compliance costs, and latency optimization investments.

Primary Respondent Breakdown:

By Designation: C-Suite/Executive Leadership (40%), VP/Director Level (32%), Product/Technical Managers (28%)

By Region: North America (40%), Europe (30%), Asia-Pacific (25%), Middle East & Africa (3%), South America (2%)

Note:Tier1=>USD50Bmarketcap;Tier2=USD5Bโˆ’50B;Tier3=

ย 

Market Size Estimation

Global market valuation was derived through revenue mapping and user engagement analysis across content delivery infrastructure. The methodology included:

Identification of 50+ key platform providers andCDN operators across North America, Europe, Asia-Pacific, and Latin America

Product mapping across live streaming platforms (Twitch, YouTube Live, Bilibili), white-label streaming services, and post-production/live editing tools

Analysis of advertising-supported (AVOD), subscription-based (SVOD), and transaction-based (TVOD) revenue streams specific to live content portfolios

Coverage of platforms representing 75-80% of global market share in 2024

Extrapolation using bottom-up (monthly active users ร— average revenue per user by content vertical) and top-down (platform reported revenue validation) approaches to derive segment-specific valuations for gaming, entertainment, retail commerce, and government broadcasting applications

Download Free Sample

Kindly complete the form below to receive a free sample of this Report

Download PDF ×

We do not share your information with anyone. However, we may send you emails based on your report interest from time to time. You may contact us at any time to opt-out.

















