Machine Condition Monitoring Market (2026 - 2035)

ID: MRFR/SEM/2059-CR
108 Pages
Nirmit Biswas
Last Updated: July 20, 2026
Machine Condition Monitoring Market Size, Share and Research Report: By End Use (Oil & Gas Industry, Chemical & Petrochemical Industry, Pulp & Paper Industry, Steel & Metal Industry), By Monitoring Type (Vibration Monitoring, Thermography, Oil Analysis, Corrosion Monitoring), By Monitoring Process Type (Online, Portable), and By Regional (North America, Europe, South America, Asia Pacific, Middle East and Africa) - Industry Forecast Till 2035
Machine Condition Monitoring Market
Market Size
Forecast Period2026-2035
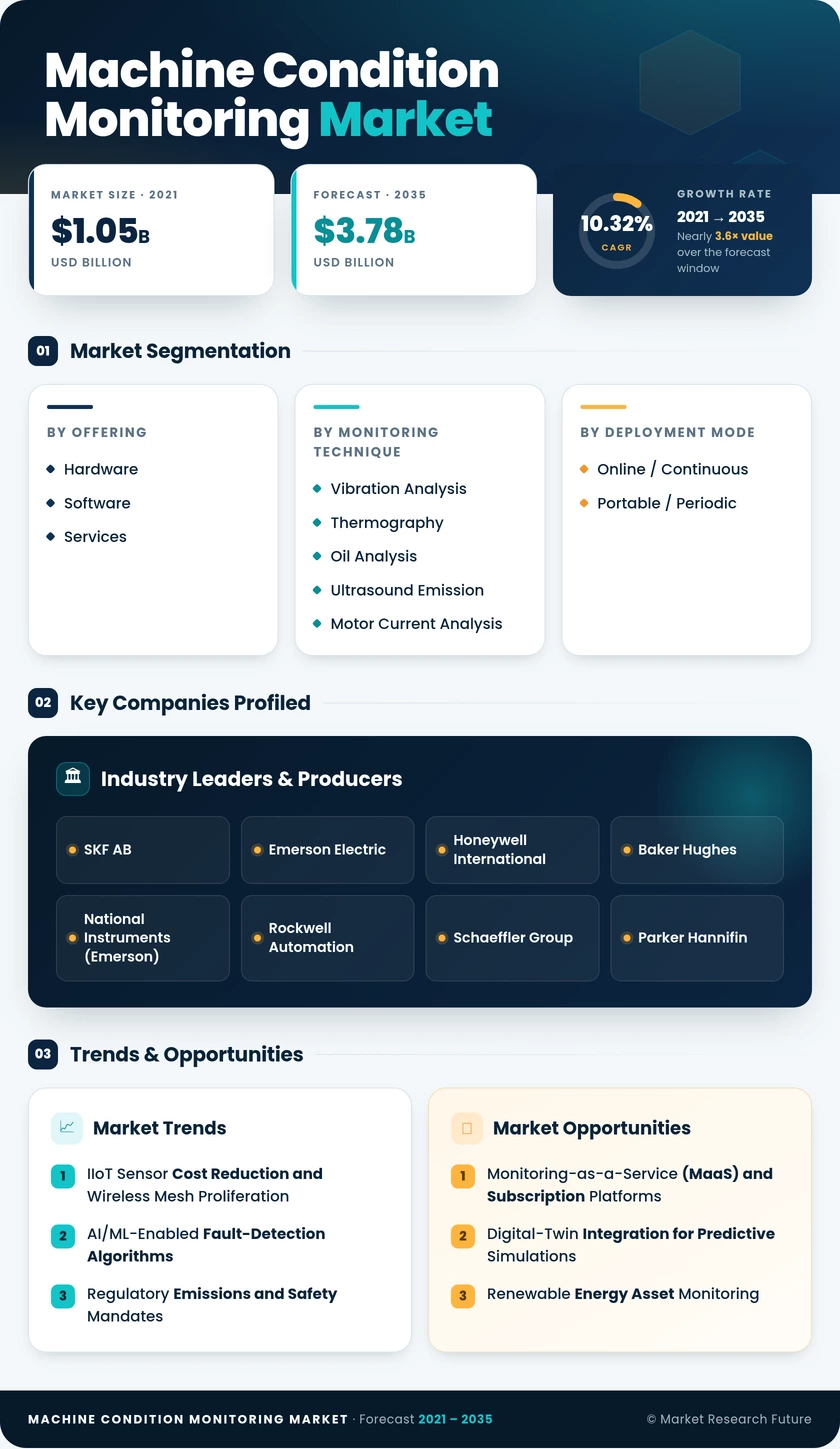
CAGR (2026-2035)10.32%
2025 Market SizeUSD 1.49 Billion
2035 Market SizeUSD 3.78 Billion
Key Players
SKF AB
Emerson Electric
Honeywell International
Baker Hughes
National Instruments
Rockwell Automation
Opportunities
  • Monitoring-as-a-Service (MaaS) and Subscription Platforms
  • Digital-Twin Integration for Predictive Simulations
  • Renewable Energy Asset Monitoring
  1. 1 Market Overview |
    1. 1.1 Study Assumptions & Market Definition |
    2. 1.2 Scope of the Study |
    3. 1.3 Research Methodology
  2. 2 Market Summary & Key Takeaways
  3. 3 Market Dynamics |
    1. 3.1 Market Drivers Analysis | |
      1. 3.1.1 IIoT Sensor Cost Reduction & Wireless Mesh Proliferation | |
      2. 3.1.2 AI/ML-Enabled Fault-Detection Algorithms | |
      3. 3.1.3 Regulatory Emissions & Safety Mandates | |
      4. 3.1.4 Workforce Shortages in Skilled Maintenance Roles | |
      5. 3.1.5 Energy Transition & Renewable Asset Monitoring | |
      6. 3.1.6 5G/Private-Network Industrial Connectivity | |
      7. 3.1.7 Sustainability Reporting & ESG Disclosure Rules |
    2. 3.2 Market Restraints Analysis | |
      1. 3.2.1 High Upfront Integration Costs for Brownfield Plants | |
      2. 3.2.2 Data Security & OT/IT Convergence Risks | |
      3. 3.2.3 Lack of Standardized Communication Protocols | |
      4. 3.2.4 Shortage of Data-Science Talent for Analytics Deployment | |
      5. 3.2.5 Cybersecurity Vulnerabilities in Wireless Sensor Networks |
    3. 3.3 Market Opportunity Analysis | |
      1. 3.3.1 Monitoring-as-a-Service (MaaS) & Subscription Platforms | |
      2. 3.3.2 Digital-Twin Integration for Predictive Simulations | |
      3. 3.3.3 Renewable Energy Asset Monitoring | |
      4. 3.3.4 Emerging-Market Industrialization in Southeast Asia & Africa | |
      5. 3.3.5 Data Monetization & Benchmarking Services |
    4. 3.4 Industry Value Chain Analysis |
    5. 3.5 Porter's Five Forces Analysis
  4. 4 Global Machine Condition Monitoring Market Size & Forecast (2021–2035) |
    1. 4.1 Historical Market Size (2021–2025) |
    2. 4.2 Current & Forecast Market Size (2026–2035) |
    3. 4.3 Market Size by Revenue (USD Billion) |
    4. 4.4 Year-over-Year Growth Analysis
  5. 5 Segmentation Analysis |
    1. 5.1 By Offering | |
      1. 5.1.1 Hardware (Vibration Monitoring Equipment, Thermography Equipment, Others) | |
      2. 5.1.2 Software | |
      3. 5.1.3 Services |
    2. 5.2 By Monitoring Technique | |
      1. 5.2.1 Vibration Analysis | |
      2. 5.2.2 Thermography | |
      3. 5.2.3 Oil Analysis | |
      4. 5.2.4 Ultrasound Emission | |
      5. 5.2.5 Motor Current Analysis |
    3. 5.3 By Deployment Mode | |
      1. 5.3.1 Online / Continuous Systems | |
      2. 5.3.2 Portable / Periodic Systems |
    4. 5.4 By End-User Industry | |
      1. 5.4.1 Oil and Gas | |
      2. 5.4.2 Power Generation | |
      3. 5.4.3 Automotive | |
      4. 5.4.4 Food and Beverage | |
      5. 5.4.5 Metals and Mining | |
      6. 5.4.6 Aerospace and Defense
  6. 6 Regional Analysis |
    1. 6.1 North America | |
      1. 6.1.1 United States | |
      2. 6.1.2 Canada | |
      3. 6.1.3 Mexico |
    2. 6.2 Europe | |
      1. 6.2.1 Germany | |
      2. 6.2.2 United Kingdom | |
      3. 6.2.3 France | |
      4. 6.2.4 Italy | |
      5. 6.2.5 Spain | |
      6. 6.2.6 Nordic Countries | |
      7. 6.2.7 Russia | |
      8. 6.2.8 Rest of Europe |
    3. 6.3 Asia-Pacific | |
      1. 6.3.1 China | |
      2. 6.3.2 India | |
      3. 6.3.3 Japan | |
      4. 6.3.4 South Korea | |
      5. 6.3.5 ASEAN | |
      6. 6.3.6 Rest of Asia-Pacific |
    4. 6.4 South America | |
      1. 6.4.1 Brazil | |
      2. 6.4.2 Argentina | |
      3. 6.4.3 Rest of South America |
    5. 6.5 Middle East & Africa | |
      1. 6.5.1 Saudi Arabia | |
      2. 6.5.2 UAE | |
      3. 6.5.3 South Africa | |
      4. 6.5.4 Egypt | |
      5. 6.5.5 Rest of MEA
  7. 7 Competitive Landscape |
    1. 7.1 Market Share Analysis (2025) |
    2. 7.2 Competitive Benchmarking Matrix |
    3. 7.3 Company Profiles | |
      1. 7.3.1 SKF AB | |
      2. 7.3.2 Emerson Electric | |
      3. 7.3.3 Honeywell International | |
      4. 7.3.4 Baker Hughes | |
      5. 7.3.5 National Instruments (Emerson) | |
      6. 7.3.6 Rockwell Automation | |
      7. 7.3.7 Schaeffler Group | |
      8. 7.3.8 Parker Hannifin | |
      9. 7.3.9 Fluke Corporation (Fortive) | |
      10. 7.3.10 Brüel & Kjær (HBK)
  8. 8 Future Outlook & Strategic Recommendations (2026–2035) |
    1. 8.1 AI-Driven Autonomous Maintenance Loops |
    2. 8.2 Platform Economics & Ecosystem Consolidation |
    3. 8.3 Electrification Supercycle & New Asset Classes |
    4. 8.4 ESG Reporting & Energy-Performance Assurance
  9. 9 Recent Developments & News
  10. 10 Frequently Asked Questions (FAQs)
  11. 11 Report Scope & Methodology |
    1. 11.1 Study Period & Base Year |
    2. 11.2 Data Sources & Citations |
    3. 11.3 Abbreviations
  12. 12 LIST OF TABLES |
  13. TABLE 1 Global Machine Condition Monitoring Market Size & Forecast, by Revenue (USD Billion), 2021–2035 |
  14. TABLE 2 Global Machine Condition Monitoring Market — Year-over-Year Growth Analysis, 2021–2035 |
  15. TABLE 3 Driver Impact Analysis — Machine Condition Monitoring Market |
  16. TABLE 4 Restraints Impact Analysis — Machine Condition Monitoring Market |
  17. TABLE 5 Regional Market Share Summary, 2025 |
  18. TABLE 6 North America Machine Condition Monitoring Market Size, by Country, 2021–2035 (USD Billion) |
  19. TABLE 7 Europe Machine Condition Monitoring Market Size, by Country, 2021–2035 (USD Billion) |
  20. TABLE 8 Asia-Pacific Machine Condition Monitoring Market Size, by Country, 2021–2035 (USD Billion) |
  21. TABLE 9 South America Machine Condition Monitoring Market Size, by Country, 2021–2035 (USD Billion) |
  22. TABLE 10 Middle East & Africa Machine Condition Monitoring Market Size, by Country, 2021–2035 (USD Billion) |
  23. TABLE 11 Global Machine Condition Monitoring Market Size, by Offering, 2021–2035 (USD Billion) |
  24. TABLE 12 Global Machine Condition Monitoring Market Size, by Monitoring Technique, 2021–2035 (USD Billion) |
  25. TABLE 13 Global Machine Condition Monitoring Market Size, by Deployment Mode, 2021–2035 (USD Billion) |
  26. TABLE 14 Global Machine Condition Monitoring Market Size, by End-User Industry, 2021–2035 (USD Billion) |
  27. TABLE 15 Competitive Benchmarking Matrix — Machine Condition Monitoring Market, 2025 |
  28. TABLE 16 Company Profiles — Key Players, Machine Condition Monitoring Market |
  29. TABLE 17 Recent Developments & Strategic Announcements, 2023–2025 |
  30. TABLE 18 Report Scope & Methodology Summary |
  31. TABLE 19 Detailed Sources and Citations |
  32. TABLE 20 North America Machine Condition Monitoring Market Size, by Offering, 2021–2035 (USD Billion) |
  33. TABLE 21 North America Machine Condition Monitoring Market Size, by Monitoring Technique, 2021–2035 (USD Billion) |
  34. TABLE 22 North America Machine Condition Monitoring Market Size, by Deployment Mode, 2021–2035 (USD Billion) |
  35. TABLE 23 North America Machine Condition Monitoring Market Size, by End-User Industry, 2021–2035 (USD Billion) |
  36. TABLE 24 Europe Machine Condition Monitoring Market Size, by Offering, 2021–2035 (USD Billion) |
  37. TABLE 25 Europe Machine Condition Monitoring Market Size, by Monitoring Technique, 2021–2035 (USD Billion) |
  38. TABLE 26 Europe Machine Condition Monitoring Market Size, by Deployment Mode, 2021–2035 (USD Billion) |
  39. TABLE 27 Europe Machine Condition Monitoring Market Size, by End-User Industry, 2021–2035 (USD Billion) |
  40. TABLE 28 Asia-Pacific Machine Condition Monitoring Market Size, by Offering, 2021–2035 (USD Billion) |
  41. TABLE 29 Asia-Pacific Machine Condition Monitoring Market Size, by Monitoring Technique, 2021–2035 (USD Billion) |
  42. TABLE 30 Asia-Pacific Machine Condition Monitoring Market Size, by Deployment Mode, 2021–2035 (USD Billion) |
  43. TABLE 31 Asia-Pacific Machine Condition Monitoring Market Size, by End-User Industry, 2021–2035 (USD Billion) |
  44. TABLE 32 South America Machine Condition Monitoring Market Size, by Offering, 2021–2035 (USD Billion) |
  45. TABLE 33 South America Machine Condition Monitoring Market Size, by Monitoring Technique, 2021–2035 (USD Billion) |
  46. TABLE 34 South America Machine Condition Monitoring Market Size, by Deployment Mode, 2021–2035 (USD Billion) |
  47. TABLE 35 South America Machine Condition Monitoring Market Size, by End-User Industry, 2021–2035 (USD Billion) |
  48. TABLE 36 Middle East & Africa Machine Condition Monitoring Market Size, by Offering, 2021–2035 (USD Billion) |
  49. TABLE 37 Middle East & Africa Machine Condition Monitoring Market Size, by Monitoring Technique, 2021–2035 (USD Billion) |
  50. TABLE 38 Middle East & Africa Machine Condition Monitoring Market Size, by Deployment Mode, 2021–2035 (USD Billion) |
  51. TABLE 39 Middle East & Africa Machine Condition Monitoring Market Size, by End-User Industry, 2021–2035 (USD Billion)
  52. 13 LIST OF FIGURES |
  53. FIGURE 1 Machine Condition Monitoring Market Dynamics — Drivers, Restraints, and Opportunities |
  54. FIGURE 2 Industry Value Chain Analysis — Machine Condition Monitoring Market |
  55. FIGURE 3 Porter's Five Forces Analysis — Machine Condition Monitoring Market |
  56. FIGURE 4 Global Machine Condition Monitoring Market Size Trend (USD Billion), 2021–2035 |
  57. FIGURE 5 Machine Condition Monitoring Market Share, by Offering, 2025 |
  58. FIGURE 6 Machine Condition Monitoring Market Share, by Monitoring Technique, 2025 |
  59. FIGURE 7 Machine Condition Monitoring Market Share, by Deployment Mode, 2025 |
  60. FIGURE 8 Machine Condition Monitoring Market Share, by End-User Industry, 2025 |
  61. FIGURE 9 Machine Condition Monitoring Market Share, by Region, 2025 |
  62. FIGURE 10 North America Machine Condition Monitoring Market Share, by Country, 2025 |
  63. FIGURE 11 Europe Machine Condition Monitoring Market Share, by Country, 2025 |
  64. FIGURE 12 Asia-Pacific Machine Condition Monitoring Market Share, by Country, 2025 |
  65. FIGURE 13 South America Machine Condition Monitoring Market Share, by Country, 2025 |
  66. FIGURE 14 Middle East & Africa Machine Condition Monitoring Market Share, by Country, 2025 |
  67. FIGURE 15 Competitive Landscape — Market Share Distribution, 2025 |
  68. FIGURE 16 Competitive Benchmarking Radar Chart — Top 10 Players

SEGMENTATION QUICK REFERENCE

DimensionSub-SegmentsDominant SegmentFastest Growing Segment
By OfferingHardware, Software, ServicesHardware (47.2% share, 2025)Software (11.8% CAGR)
By Monitoring TechniqueVibration Analysis, Thermography, Oil Analysis, Ultrasound Emission, Motor Current AnalysisVibration Analysis (36.1% share, 2025)Ultrasound Emission (12.7% CAGR)
By Deployment ModeOnline / Continuous, Portable / PeriodicOnline / Continuous (50.8% share, 2025)Portable / Periodic (8.9% CAGR)
By End-User IndustryOil and Gas, Power Generation, Automotive, Food and Beverage, Metals and Mining, Aerospace and DefenseOil and Gas (29.0% share, 2025)Food and Beverage (11.3% CAGR)
By RegionNorth America, Europe, Asia-Pacific, South America, Middle East & AfricaNorth America (34.7% share, 2025)Asia-Pacific (10.68% CAGR)


MARKET SEGMENTATION OVERVIEW

By Offering

Sub-SegmentKey Trend
Hardware (Vibration Monitoring Equipment, Thermography Equipment, Others)Wireless MEMS accelerometers displacing legacy wired sensors; unit costs declining 8–10% annually
SoftwareCloud-native AI analytics platforms shifting to SaaS subscription models; digital-twin integration accelerating
ServicesRemote monitoring-as-a-service contracts growing; calibration and commissioning bundled into multi-year agreements


The offering mix is shifting toward software and services as sensor commoditization compresses hardware margins. Vendors that build analytics platforms on top of open hardware architectures capture higher lifetime customer value and reduce churn through data network effects.

By Monitoring Technique

Sub-SegmentKey Trend
Vibration AnalysisMulti-axis wireless accelerometers enabling triaxial measurement on compact form factors
ThermographyInfrared camera miniaturization bringing thermal monitoring to portable handheld devices
Oil AnalysisInline oil-quality sensors replacing lab-based sampling with continuous readings
Ultrasound EmissionAirborne and structure-borne ultrasound combining for comprehensive leak and bearing assessment
Motor Current AnalysisNon-invasive current-signature analysis growing as electric-motor populations expand


Vibration analysis remains the default first deployment for most facilities, while ultrasound emission gains ground in compressed-air and steam-system applications where non-contact detection adds safety and efficiency value.

By Deployment Mode

Sub-SegmentKey Trend
Online / Continuous SystemsEdge-computing gateways enabling on-premise analytics with cloud synchronization
Portable / Periodic SystemsBluetooth-enabled handheld collectors integrating with mobile CMMS workflows


Online continuous systems dominate safety-critical and high-value asset populations, while portable systems serve as a cost-effective entry point for facilities beginning their condition-monitoring journey.

By End-User Industry

Sub-SegmentKey Trend
Oil and GasWireless sensor mesh deployments covering wellsite, midstream, and downstream assets
Power GenerationTurbine health monitoring mandated by grid-reliability regulations
AutomotiveEV battery-line and stamping-press monitoring driving new sensor demand
Food and BeverageHygienic IP69K-rated sensors enabling washdown-compatible continuous monitoring
Metals and MiningHarsh-environment ruggedized sensors protecting crushers, mills, and conveyors
Aerospace and DefenseMRO digitization programs integrating condition data into fleet-management systems


Oil and gas remains the largest end-user vertical, but food-and-beverage and automotive are the fastest-growing sectors as manufacturing-line uptime becomes a competitive differentiator in consumer-facing supply chains.


Download PDF ×

We do not share your information with anyone. However, we may send you emails based on your report interest from time to time. You may contact us at any time to opt-out.