Metaverse Market (2025 - 2035)

Metaverse Market Size, Share and Research Report By Component (Hardware (HMDs, Sensors), Software Platforms, Services & Consulting), By Platform Type (Centralized Closed Platforms, Open Decentralized Platforms (Web3), Industrial/Digital-Twin Platforms), By Revenue Model (Advertising, Direct Consumer Spend, Virtual Goods & NFTs, Subscriptions, Industrial Services), By End-User Industry (Gaming & Esports, Media & Live Entertainment, Corporate/Industrial, Education & Training, Healthcare, Retail & E-Commerce) and By Regional (North America, Europe, South America, Asia Pacific, Middle East and Africa) - Industry Forecast to 2035.
ID: MRFR/ICT/9260-CR
153 Pages
Aarti Dhapte
Last Updated: August 04, 2026
Metaverse Market
Market Size
Forecast Period2025-2035
CAGR (2025-2035)38.0%
2025 Market SizeUSD 179.47 Billion
2035 Market SizeUSD 4,495.56 Billion
Key Players
Meta Platforms
Microsoft
Apple
NVIDIA
Epic Games
Roblox Corporation
Opportunities
  • Immersive Commerce and Virtual Retail
  • Healthcare Training and Surgical Simulation
  • Emerging-Market Leapfrog via Mobile AR

Metaverse Market Summary

The Metaverse Market reached an estimated USD 179.47 billion in 2025 and is projected to climb to USD 4,495.56 billion by 2035, advancing at a 38.0% CAGR during 2026–2035. Enterprise appetite for persistent virtual environments is no longer speculative — Big Tech capital expenditure topping USD 85 billion annually on compute and mixed-reality hardware is translating directly into developer tooling, content pipelines, and vertical-specific platforms that shorten time-to-deployment for mid-market adopters [1]. Government digital-infrastructure programs in the EU, South Korea, and the UAE are further accelerating public-sector adoption.

Legacy 2D web experiences and walled collaboration tools are being replaced by spatially rendered workspaces, industrial simulations and consumer social worlds on cloud-edge architectures. The deployment of 5G standalone processors and low-latency network slicing has reduced motion-to-photon latency below 20 ms at scale, making co-presence in real-time possible for training, design review, and live commerce [2]. Apple's spatial computing stack and Meta's open-horizon OS herald a platform battle with R&D spend alone exceeding USD 28 billion in 2024 [3].


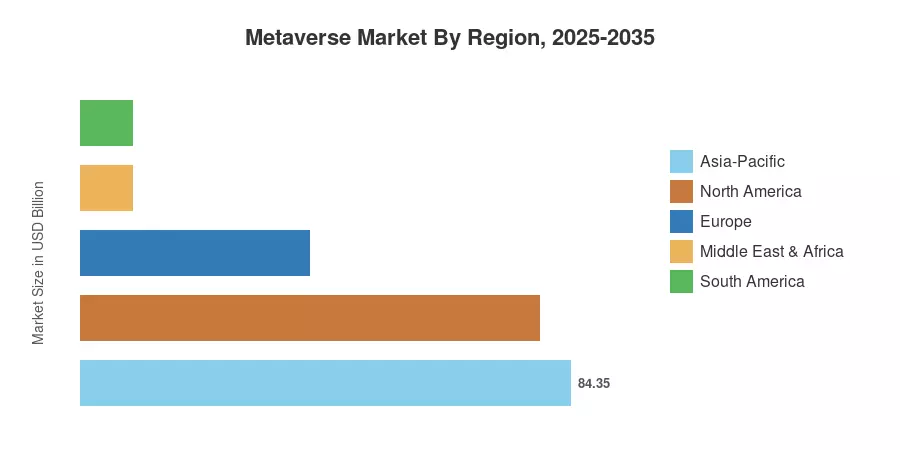
Hyperscaler infrastructure and a large pool of XR-native developers, North America holds a dominant share of around 44% of the global Metaverse Market revenue. The Asia-Pacific region is the fastest-growing region with an expected CAGR of 47% through 2035, driven by China’s state-backed metaverse industrial parks and South Korea’s Metaverse Ethics Charter [4]. Europe has the second-highest share of roughly 22%, with the EU’s Digital Markets Act setting norms for platform interoperability that will impact global adoption trajectories over the coming decade.


Key Report Takeaways

• By Component

  • Hardware (HMDs, sensors, haptics) captured the largest component share of the Metaverse Market in 2024, reflecting aggressive refresh cycles in mixed-reality headsets.
  • Services & consulting are advancing at a 44% CAGR through 2035 as enterprises outsource avatar-based customer engagement and spatial analytics implementations.

• By End-User Industry

  • Gaming & esports accounted for 46% of the Metaverse Market revenue in 2024, underpinned by persistent virtual worlds exceeding 400 million monthly active users globally.
  • Corporate and industrial end users are growing at the fastest pace, targeting training simulations, remote inspections, and virtual prototyping.

• By Geography

  • North America retained a 44% Metaverse Market share in 2024, anchored by hyperscaler investments and a mature creator economy.
  • Asia-Pacific is projected to register the highest regional CAGR, led by policy-driven metaverse adoption in South Korea, China, and Japan.


Metaverse Market Size and Forecast (2021–2035)

Market Research Future (MRFR) forecasts are based on audited corporate filings, primary interviews with platform operators and triangulated third-party data. Forecasts are based on a compound annual growth rate of 38.0% (2026-2035) and are stress-tested against quarterly earnings cadences and declared capital commitments among the top twenty ecosystem members.

Metaverse Market Size and Forecast
Our Impact
Enabled $4.3B Revenue Impact for Fortune 500 and Leading Multinationals
Partnering with 2000+ Global Organizations Each Year
30K+ Citations by Top-Tier Firms in the Industry

Driver Impact Analysis

Driver ~% Impact on CAGR Geographic Relevance Impact Timeline
Big Tech capex on XR compute +5.5% Global Short-term (≤2 yr)
5G SA & network slicing deployment +4.8% North America, Asia-Pacific Short-term
Generative-AI content pipelines +5.0% Global Medium-term (2–4 yr)
Enterprise digital-twin adoption +4.2% Europe, North America Medium-term
Government metaverse strategies +3.5% Asia-Pacific, MEA Long-term (≥4 yr)
Interoperability & open standards +3.0% Global Long-term
Consumer AR glasses cost reduction +2.8% Global Long-term


Big Tech Capital Expenditure on XR Compute

Meta, Microsoft, Apple, and Alphabet collectively committed over USD 85 billion in 2024 to cloud-GPU clusters, custom silicon for mixed-reality headsets, and on-device AI accelerators [1]. These investments lower the barrier for independent studios and enterprise solution providers to build high-fidelity persistent worlds without owning server farms — a dynamic that compresses time-to-market for vertical platforms in healthcare, retail, and education.

5G Standalone and Network Slicing

Operators in the US, South Korea, and Germany have activated 5G SA cores capable of guaranteed sub-10 ms uplink slices specifically for XR traffic [2]. The practical result is that multi-user co-presence sessions — remote surgery rehearsals, collaborative design reviews, live virtual concerts — can now sustain 90 fps rendering at the edge without frame drops, removing the performance objection that stalled enterprise procurement cycles during 2021–2023.

Generative-AI Content Pipelines

Text-to-3D and AI texture-generation tools cut environment-creation costs by an estimated 60–70%, according to a 2024 analysis [8]. Studios that previously budgeted USD 2–5 million for a branded virtual world can now achieve comparable fidelity for under USD 800,000, democratizing the Metaverse Market for mid-tier consumer brands and educational institutions.

Enterprise Digital-Twin Adoption

Siemens, BMW, and Boeing have operationalized factory-scale digital twins running inside persistent virtual environments, reporting 12–18% reductions in unplanned downtime [9]. The European Commission's Destination Earth initiative allocated EUR 315 million through 2027 for climate and industrial digital twins, broadening the addressable Metaverse Market within public-sector use cases.


Restraints Impact Analysis

Restraint estimates below reflect modelled drag on adoption velocity. Individual restraint percentages are directional and may overlap; they do not sum to a net deduction from the CAGR.

Restraint ~% Impact on CAGR Geographic Relevance Impact Timeline
Privacy & data-sovereignty regulation –3.8% EU, North America Short-term
Hardware ergonomics & motion sickness –2.5% Global Medium-term
High device & infrastructure cost –2.2% Emerging markets Long-term
Content moderation complexity –1.8% Global Medium-term
Interoperability fragmentation –1.5% Global Long-term


Privacy and Data-Sovereignty Regulation

The EU's AI Act and GDPR extensions to biometric data collected by VR headsets impose consent and data-localization requirements that add an estimated 8–12% to compliance costs for cross-border Metaverse Market operators [11]. Smaller developers face a disproportionate burden, slowing ecosystem expansion in regulated verticals such as healthcare and financial services.

Hardware Ergonomics

Despite improvements in pancake optics and weight distribution, sustained sessions exceeding 45 minutes still trigger simulator sickness in roughly 15–25% of users, according to a 2024 IEEE meta-study [12]. Until foveated rendering and varifocal displays reach mass-market price points, consumer adoption will plateau below the install-base levels required for advertising-funded business models to break even.

High Device and Infrastructure Cost

Average XR headset retail prices remain above USD 400 in most markets, and enterprise-grade spatial computing kits exceed USD 3,000 [13]. In South America, Southeast Asia, and Sub-Saharan Africa, limited fibre-to-the-home penetration and GPU-cloud availability compound the affordability barrier, restricting the Metaverse Market to affluent urban demographics.


Metaverse Market Opportunities

Immersive Commerce and Virtual Retail

Brands that deploy shoppable virtual storefronts report 25–35% higher average order values than conventional e-commerce, per a 2024 Shopify analysis [15]. The convergence of payment-rail tokenization and avatar-based try-on experiences positions the Metaverse Market to capture a growing slice of the USD 6.3 trillion global e-commerce economy.

Healthcare Training and Surgical Simulation

VR-based surgical training reduced procedural errors by 30% in a Johns Hopkins controlled trial [16]. With physician shortages projected across OECD nations through 2035, hospital systems are earmarking budgets for persistent simulation labs that run on metaverse infrastructure, creating a recurring revenue stream independent of consumer sentiment.

Emerging-Market Leapfrog via Mobile AR

Low-cost smartphones with ARCore and ARKit support already exceed 3.5 billion units globally [17]. Developing economies in South-East Asia and Sub-Saharan Africa can bypass tethered-headset adoption entirely, accessing lightweight metaverse experiences through mobile AR. This path mirrors how mobile payments leapfrogged desktop banking.

Data Monetization and Spatial Analytics

Operators of persistent virtual environments generate granular behavioural telemetry — gaze duration, locomotion patterns, social-graph proximity — that enterprise clients will pay to license for product design, urban planning, and sentiment analysis [18]. This data-monetization layer adds high-margin revenue without requiring user-facing content investment.

Education and Workforce Upskilling

estimates that VR-trained employees complete learning modules four times faster than classroom peers [19]. Government workforce agencies in Germany, Singapore, and Canada are piloting metaverse-based upskilling centres, providing institutional demand that stabilizes the Metaverse Market against consumer-cycle volatility.


Metaverse Market Future Outlook

AI-Native Virtual Worlds

Generative AI will shift metaverse development from hand-crafted asset pipelines to procedurally generated persistent environments. By 2030, an estimated 60% of new virtual-world content will be AI-authored, slashing production budgets and enabling real-time personalisation of user experiences [8]. This paradigm positions the Metaverse Market to absorb creator-economy talent currently distributed across 2D social platforms.

Platform Economics and Interoperability

The winner-take-most dynamics of early metaverse platforms are giving way to interoperability mandates, with the Metaverse Standards Forum and the EU DMA requiring portable identities and transferable assets [10]. Platform operators that embrace open standards will capture ecosystem network effects, while walled-garden holdouts risk regulatory friction and developer attrition.

Spatial Commerce Supercycle

As AR glasses approach sub-USD-200 price points by the early 2030s, commerce will shift from screen-based browsing to spatially anchored product discovery. projects that 30% of large enterprises will operate virtual storefronts by 2028 [22]. Advertising, subscription, and transaction-fee revenue models will converge within persistent shopping environments, redefining the Metaverse Market revenue mix.

Sustainability and Digital Responsibility

Compute-intensive virtual worlds carry a growing carbon footprint; hyperscalers consumed an estimated 20 TWh for XR workloads in 2024 [23]. Pressure from ESG-reporting frameworks (CSRD, SEC climate rules) will push operators toward renewable-powered edge nodes and carbon-offset programmes, adding compliance cost but also creating differentiation for green-certified metaverse platforms.


Metaverse Market Segmentation

By Component

Segment Metric Primary Demand Driver
Hardware (HMDs, Sensors) 38% share (2024) Consumer headset upgrade cycles
Software Platforms USD 54.58 Billion (2025) Enterprise licensing growth
Services & Consulting 44% CAGR (2026–2035) Implementation complexity


Hardware remains the entry point for Metaverse Market adoption, with mixed-reality headsets from Meta, Apple, and Sony driving a 2024 install base exceeding 45 million units. Falling BOM costs for pancake lenses and micro-OLED displays are pushing average selling prices down 10–12% annually, broadening the consumer addressable market.

Services and consulting represent the fastest-growing component as enterprises require integration partners to connect spatial-computing platforms with existing ERP, PLM, and CRM stacks. System integrators like Accenture and Capgemini have established dedicated metaverse practices, reflecting the complexity of enterprise deployments.

By Platform Type

Segment Metric Primary Demand Driver
Centralized Closed Platforms 42% share (2024) Content control, brand safety
Open Decentralized Platforms (Web3) USD 28.71 Billion (2025) Community-owned economies
Industrial/Digital-Twin Platforms 41% CAGR (2026–2035) Manufacturing & logistics ROI


Centralized platforms such as Roblox, Fortnite, and Horizon Worlds dominate the Metaverse Market by user count, offering content-moderation tools and brand-safety guarantees that attract advertisers. Industrial and digital-twin platforms are the fastest-growing segment, driven by measurable ROI in predictive maintenance, virtual commissioning, and supply-chain simulation.

By Revenue Model

Segment Metric Primary Demand Driver
Advertising 35% share (2024) Brand placement in virtual worlds
Direct Consumer Spend USD 33.50 Billion (2025) Premium avatar and content purchases
Virtual Goods & NFTs 43% CAGR (2026–2035) Creator-economy monetisation
Subscriptions USD 19.74 Billion (2025) Recurring access to premium features
Industrial Services 40% CAGR (2026–2035) B2B simulation contracts


Advertising currently anchors the Metaverse Market revenue stack, but virtual goods and NFT-based creator economies are gaining share as platforms enable user-generated commerce. Industrial services — paid simulation hours, digital-twin SaaS, and spatial analytics subscriptions — offer higher margins and longer contract durations than consumer-facing models.

By End-User Industry

Segment Metric Primary Demand Driver
Gaming & Esports 46% share (2024) Persistent social worlds
Media & Live Entertainment USD 21.54 Billion (2025) Virtual concerts and events
Corporate/Industrial 40% CAGR (2026–2035) Training, prototyping, remote ops
Education & Training USD 12.55 Billion (2025) Skills-gap programmes
Healthcare 39% CAGR (2026–2035) Surgical simulation, therapy
Retail & E-Commerce USD 10.77 Billion (2025) Virtual try-on and showrooms


Gaming and esports remain the largest end-user segment in the Metaverse Market, with titles like Fortnite and Roblox exceeding 400 million monthly active users combined. Corporate and industrial users are the fastest-growing segment as ROI-driven procurement cycles replace experimental innovation-lab budgets with production-grade deployments.


Regional Market Share Analysis

Region Metric Primary Investment Themes
North America 44% share (2024) Hyperscaler compute, creator economy
Europe 22% share (2024) Interoperability regulation, industrial twins
Asia-Pacific 47% CAGR (2026–2035) State-backed metaverse parks, mobile AR
South America USD 8.97 Billion (2025) Fintech-metaverse convergence
Middle East & Africa USD 8.97 Billion (2025) Smart-city digital twins
Total USD 179.47 Billion (2025)

The Metaverse Market exhibits pronounced regional variation, with mature cloud infrastructure and XR hardware penetration in North America contrasting with rapid policy-driven adoption across Asia-Pacific. South America and the Middle East & Africa represent nascent but fast-evolving opportunity pockets.


North America

Country Metric Key Driver
US 78% of regional share Hyperscaler capex, XR developer base
Canada 13% of regional share AI-research corridors, government pilots
Mexico 9% of regional share Nearshoring-driven enterprise VR labs


The United States anchors the North American Metaverse Market through an unmatched concentration of GPU-cloud capacity and a venture ecosystem that funnelled over USD 9.2 billion into spatial-computing start-ups in 2024 [20]. Canada's Montréal-Waterloo AI corridor and Mexico's manufacturing-sector interest in virtual prototyping add secondary growth vectors.

Europe

Country Metric Key Driver
Germany 24% of regional share Industry 4.0 digital twins
UK 20% of regional share Creative-industries XR hubs
France 15% of regional share Cultural-heritage virtualisation
Italy 9% of regional share Luxury-brand virtual retail
Spain 7% of regional share Tourism metaverse pilots
Nordic Countries 10% of regional share 5G-first network policy
Russia 6% of regional share Domestic platform development
Rest of Europe 9% of regional share EU cohesion-fund XR grants


The EU Digital Markets Act mandates platform interoperability that will shape how Metaverse Market operators handle identity, avatar portability, and content moderation across borders [11]. Germany's Plattform Industrie 4.0 and the UK's Immersive Economy Strategy provide targeted public funding that de-risks early-stage enterprise adoption.

Asia-Pacific

Country Metric Key Driver
China 39% of regional share State metaverse industrial zones
India 42% CAGR (2026–2035) Mobile-first AR population
Japan 18% of regional share Content IP and gaming ecosystem
South Korea 15% of regional share National Metaverse Ethics Charter
ASEAN 40% CAGR (2026–2035) Young demographics, mobile penetration
Rest of Asia-Pacific 5% of regional share Emerging broadband buildout


South Korea's government allocated KRW 223.7 billion for metaverse ecosystem development through 2026 [4], while China's Ministry of Industry and Information Technology designated over a dozen metaverse-industry pilot zones across Shanghai, Beijing, and Chengdu. India's cost-competitive developer workforce and 700-million-plus smartphone user base make it the highest-growth country within the Metaverse Market in this region.

South America

Country Metric Key Driver
Brazil 58% of regional share Fintech-metaverse convergence
Argentina 18% of regional share Gaming talent pool
Rest of South America 24% of regional share Connectivity investments


Brazil's large gaming population and Pix payment-rail integration create a natural bridge between fintech and virtual-commerce use cases. Argentina's indie-game developer ecosystem is increasingly building for persistent virtual worlds, supported by tax incentives under the Knowledge Economy Law.

Middle East & Africa

Country Metric Key Driver
Saudi Arabia 32% of regional share NEOM & Vision 2030 digital twins
UAE 28% of regional share Dubai Metaverse Strategy
South Africa 15% of regional share EdTech and mobile AR
Egypt 10% of regional share Youth demographic dividend
Rest of MEA 15% of regional share Smart-city infrastructure pilots


Dubai's Metaverse Strategy targets 40,000 virtual jobs and USD 4 billion in GDP contribution by 2030 [21]. Saudi Arabia's NEOM project integrates city-scale digital twins that position the Kingdom as a proving ground for the Metaverse Market in urban planning and tourism.


Metaverse Market By Region, 2025-2035

Competitive Benchmarking

The Metaverse Market is moderately consolidated, with the top five firms controlling around 48-55% revenue share. The Herfindahl-Hirschman Index ranges from 900 to 1,200, indicating a competitive but not fragmented landscape, with platform incumbents having deep capital reserves. Niche value is being found in industrial simulation, healthcare and education by smaller vertical-focused players.

Company Est. Revenue Share Range Key Offerings Strategic Positioning
Meta Platforms 14–18% Horizon Worlds, Quest headsets, Presence Platform Consumer social & hardware-first ecosystem
Microsoft 8–12% Mesh, Azure Digital Twins, HoloLens Enterprise productivity & industrial twins
Apple 6–9% Vision Pro, visionOS, RealityKit Premium spatial computing, developer tools
NVIDIA 5–8% Omniverse, GPU cloud, digital-twin SDKs Infrastructure layer & simulation engine
Epic Games 5–7% Unreal Engine, Fortnite, MetaHuman Real-time 3D content & creator platform
Roblox Corporation 4–6% Roblox Platform, developer marketplace UGC-driven social gaming metaverse
Tencent Holdings 4–6% WeChat XR, cloud gaming, strategic stakes Asia-centric super-app integration
Unity Technologies 3–5% Unity Engine, Polyspatial, AR Foundation Cross-platform dev tools for XR content
ByteDance 3–5% Pico headsets, Douyin XR features Hardware + short-form content convergence
Decentraland Foundation 1–2% Decentraland, MANA token, virtual land Web3 decentralized governance model


Recent News & Developments


  • NVIDIA (March 2025): Expanded Omniverse Cloud to support real-time multi-user industrial digital twins at factory scale, partnering with Siemens and BMW [9].


  • South Korea MSIT (November 2024): Released the National Metaverse Ethics Charter and allocated KRW 223.7 billion for ecosystem development grants through 2026 [4].
  • Roblox Corporation (February 2024): Introduced real-time AI translation for 16 languages, enabling cross-border social interaction and expanding the addressable Metaverse Market user base [24].


Metaverse Market Report Scope

Parameter Detail
Market Scope Global Metaverse Market — hardware, software, services, platforms
Study Period 2021–2035
CAGR (2026–2035) 38.0%
Market Size (2025) USD 179.47 Billion
Market Size (2035) USD 4,495.56 Billion
Fastest Growing Segment Services & Consulting (by component); Industrial/Digital-Twin Platforms (by platform type)
Companies Profiled 10 (Meta Platforms, Microsoft, Apple, NVIDIA, Epic Games, Roblox, Tencent, Unity Technologies, ByteDance, Decentraland Foundation)
Valuation Currency USD Billion
CAGR Driver Disclaimer Impact percentages are directional scenario estimates; they do not sum to the headline CAGR.


FAQs

How should investors evaluate the Metaverse Market platform risk before allocating capital?
Assess platform lock-in by examining developer-ecosystem breadth, interoperability commitments, and regulatory exposure under the EU DMA. Diversified platforms with open SDKs typically carry lower single-vendor risk [10].
What distinguishes enterprise Metaverse Market procurement from consumer adoption patterns?
Enterprise buyers prioritize measurable ROI — reduced downtime, training speed, prototyping cost — over user engagement metrics. Procurement cycles average 6–12 months and often require SOC 2 compliance [9].
How do latency requirements shape infrastructure decisions for Metaverse Market deployments?
Sub-20 ms motion-to-photon latency demands edge-compute nodes within 50 km of end users. Organizations typically pair 5G SA slicing with regional GPU-cloud instances to meet this threshold [2].
Which revenue model offers the highest margin potential in the Metaverse Market?
Industrial simulation SaaS contracts deliver 65–75% gross margins, outperforming advertising and virtual-goods models. Long contract terms and low churn reinforce margin stability [25].
What cybersecurity risks are unique to the Metaverse Market?
Biometric data from eye-tracking and motion sensors creates novel attack surfaces. Spoofed avatars and spatial-phishing schemes require identity-verification layers beyond standard two-factor authentication [14].
How does the Metaverse Market intersect with sustainability reporting obligations?
Persistent virtual worlds consume significant GPU power; operators under CSRD or SEC climate rules must disclose Scope 2 emissions from cloud rendering [23]. Green-certified platforms are emerging as a procurement differentiator.
What workforce skills are most critical for organizations entering the Metaverse Market?
3D environment design, spatial-UX research, and real-time rendering engineering are the scarcest roles. Upskilling existing product teams via VR-based training can halve onboarding timelines [19].    
Author
Author
Author Profile
Aarti Dhapte LinkedIn
AVP - Research
A consulting professional focused on helping businesses navigate complex markets through structured research and strategic insights. I partner with clients to solve high-impact business problems across market entry strategy, competitive intelligence, and opportunity assessment. Over the course of my experience, I have led and contributed to 100+ market research and consulting engagements, delivering insights across multiple industries and geographies, and supporting strategic decisions linked to $500M+ market opportunities. My core expertise lies in building robust market sizing, forecasting, and commercial models (top-down and bottom-up), alongside deep-dive competitive and industry analysis. I have played a key role in shaping go-to-market strategies, investment cases, and growth roadmaps, enabling clients to make confident, data-backed decisions in dynamic markets.

Research Approach


Secondary Research

The secondary research process involved comprehensive analysis of regulatory databases, peer-reviewed technology journals, industry whitepapers, and authoritative digital economy organizations. Key sources included the National Institute of Standards and Technology (NIST) for cybersecurity and digital identity frameworks, European Commission (Digital Europe Programme) for regulatory sandboxes and digital infrastructure standards, International Telecommunication Union (ITU) for connectivity and spectrum allocation standards, World Economic Forum (WEF) Global Technology Governance for metaverse policy frameworks, and Organisation for Economic Co-operation and Development (OECD) for digital economy indicators.

Additional authoritative sources comprised the UK Department for Culture, Media and Sport (DCMS) for immersive technology roadmaps, Japan Ministry of Internal Affairs and Communications (MIC) for XR technology adoption metrics, China Ministry of Industry and Information Technology (MIIT) for virtual reality industry standards, Singapore Infocomm Media Development Authority (IMDA) for digital innovation policies, and National Telecommunications and Information Administration (NTIA) for digital equity and broadband deployment data.

Industry and academic datasets were sourced from IEEE Xplore Digital Library and ACM Digital Library for peer-reviewed research on virtual environments, VR/AR Association for hardware shipment data, International Game Developers Association (IGDA) for content creation trends, China Academy of Information and Communications Technology (CAICT) for regional virtual reality market analysis, and European Virtual Reality Congress for adoption benchmarks. Investment and patent landscape analysis utilized Crunchbase, PitchBook, and WIPO Patent Database for metaverse-related IP filings and venture capital flows.


Primary Research

To gather both qualitative and quantitative insights, supply-side and demand-side stakeholders were interviewed during the primary research process. CEOs, CTOs, VPs of Immersive Technology, blockchain architects, and heads of virtual world development from firms that provide metaverse platforms, VR/AR hardware, and blockchain infrastructure were examples of supply-side sources. Chief digital officers, heads of innovation, metaverse strategists, and procurement leads from gaming studios, immersive experience firms, and enterprise adopters (retail, real estate, education, and healthcare) were examples of demand-side sources. In addition to verifying blockchain interoperability timescales and validating platform segmentation, primary research also collected data on enterprise deployment ROI measures, virtual real estate value models, and hardware adoption trends.

Primary Respondent Breakdown:

By Designation: C-level Primaries (30%), Director Level (35%), Others (35%)

By Region: North America (32%), Europe (30%), Asia-Pacific (28%), Rest of World (10%)


Market Size Estimation

Global market valuation was derived through revenue mapping, user base analysis, and virtual transaction volume assessment. The methodology included:

Identification of 60+ key ecosystem participants across North America, Europe, Asia-Pacific, and Latin America, spanning VR/AR hardware OEMs (headsets, haptics, sensors), metaverse platform operators (centralized and decentralized), blockchain infrastructure providers, and immersive software developers

Product mapping across hardware components (displays, optics, semiconductors, sensors), software engines (creation tools, virtual world platforms, spatial computing SDKs), and services (consulting, integration, virtual asset management)

Analysis of reported and modeled annual revenues specific to metaverse-related portfolios, including virtual goods transactions, NFT marketplace volumes, and enterprise immersive solution contracts

Coverage of ecosystem participants representing 75-80% of global market share in 2024

Extrapolation using bottom-up (active user base × ARPU by segment) and top-down (platform revenue validation with Web3 transaction data) approaches to derive segment-specific valuations across gaming, virtual real estate, social commerce, and enterprise training verticals

Download Free Sample

Kindly complete the form below to receive a free sample of this Report

Download PDF ×

We do not share your information with anyone. However, we may send you emails based on your report interest from time to time. You may contact us at any time to opt-out.

















