Segmentation Quick Reference
| Dimension | Sub-Segments | Dominant Segment | Fastest Growing Segment |
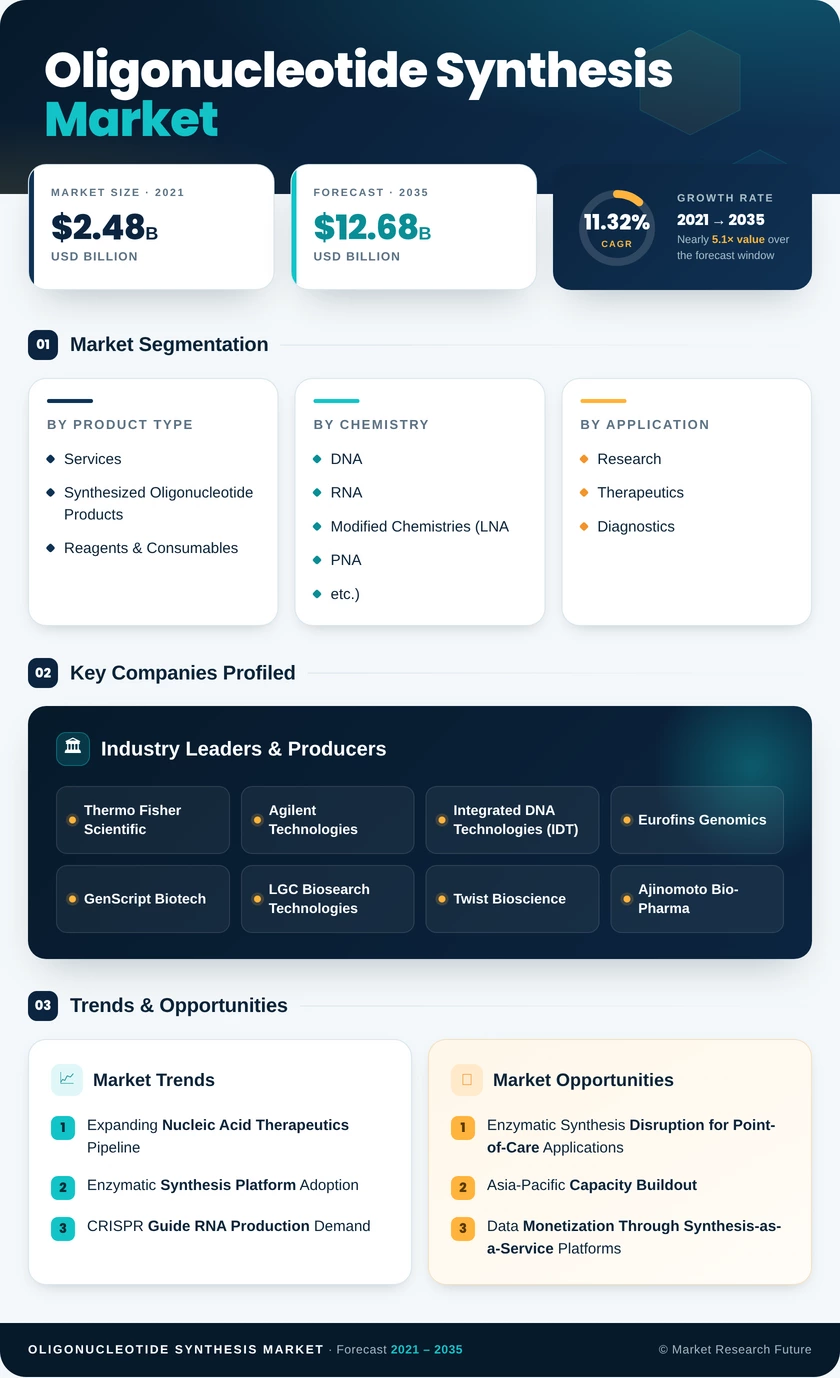
| By Product Type | Services; Synthesized Oligonucleotide Products; Reagents & Consumables | Services (~38% share, 2025) | Synthesized Oligonucleotide Products |
| By Chemistry | DNA; RNA; Modified Chemistries (LNA, PNA, etc.) | DNA (~40% share, 2025) | RNA |
| By Application | Research; Therapeutics; Diagnostics | Research (~49% share, 2025) | Therapeutics |
| By End-User | Academic Research Institutes; Oligonucleotide Synthesis Market & Biotechnology Companies; Diagnostic Companies | Academic Research Institutes (~68% volume, 2025) | Oligonucleotide Synthesis Market & Biotechnology Companies |
| By Geography | North America; Europe; Asia-Pacific; South America; Middle East & Africa | North America (~39% share, 2025) | Asia-Pacific |
Market Segmentation Overview
By Product Type
| Sub-Segment | Key Trend |
| Services | Pharma outsourcing to CDMOs drives sustained demand for GMP-certified contract synthesis |
| Synthesized Oligonucleotide Products | Therapeutic-grade, ready-to-use oligos replace in-house synthesis at smaller institutions |
| Reagents & Consumables | Phosphoramidite reagent demand stabilizes while enzymatic kits gain traction |
The product type segmentation reflects a market in transition — services remain the revenue anchor, but the shift toward direct purchase of synthesized products is accelerating as quality standards and catalog breadth improve across leading suppliers.
By Chemistry
| Sub-Segment | Key Trend |
| DNA | PCR primer and NGS adapter volumes sustain the largest share |
| RNA | mRNA therapeutics and CRISPR guide RNA applications drive the fastest growth |
| Modified Chemistries (LNA, PNA, etc.) | Demand tied to antisense and siRNA drug stability requirements |
Chemistry segmentation captures the evolving balance between legacy DNA-centric demand and the rapid rise of RNA-based applications driven by therapeutic and gene-editing pipelines.
By Application
| Sub-Segment | Key Trend |
| Research | High-volume, low-price academic orders dominate by unit count |
| Therapeutics | Premium pricing and GMP requirements drive disproportionate revenue growth |
| Diagnostics | Molecular testing expansion post-pandemic sustains steady demand for probes and primers |
Application segmentation highlights the growing revenue importance of therapeutics, which command 15–20× the per-base pricing of research-grade oligos despite lower unit volumes.
By End-User
| Sub-Segment | Key Trend |
| Academic Research Institutes | Largest customer base by order volume, funded primarily through government grants |
| Oligonucleotide Synthesis Market & Biotechnology Companies | Highest value per customer through multi-year CDMO contracts |
| Diagnostic Companies | Growing demand for kit-grade probes and primers in companion diagnostics |
End-user segmentation underscores the divergence between volume-driven academic demand and value-driven pharmaceutical procurement that increasingly defines competitive positioning in the market.