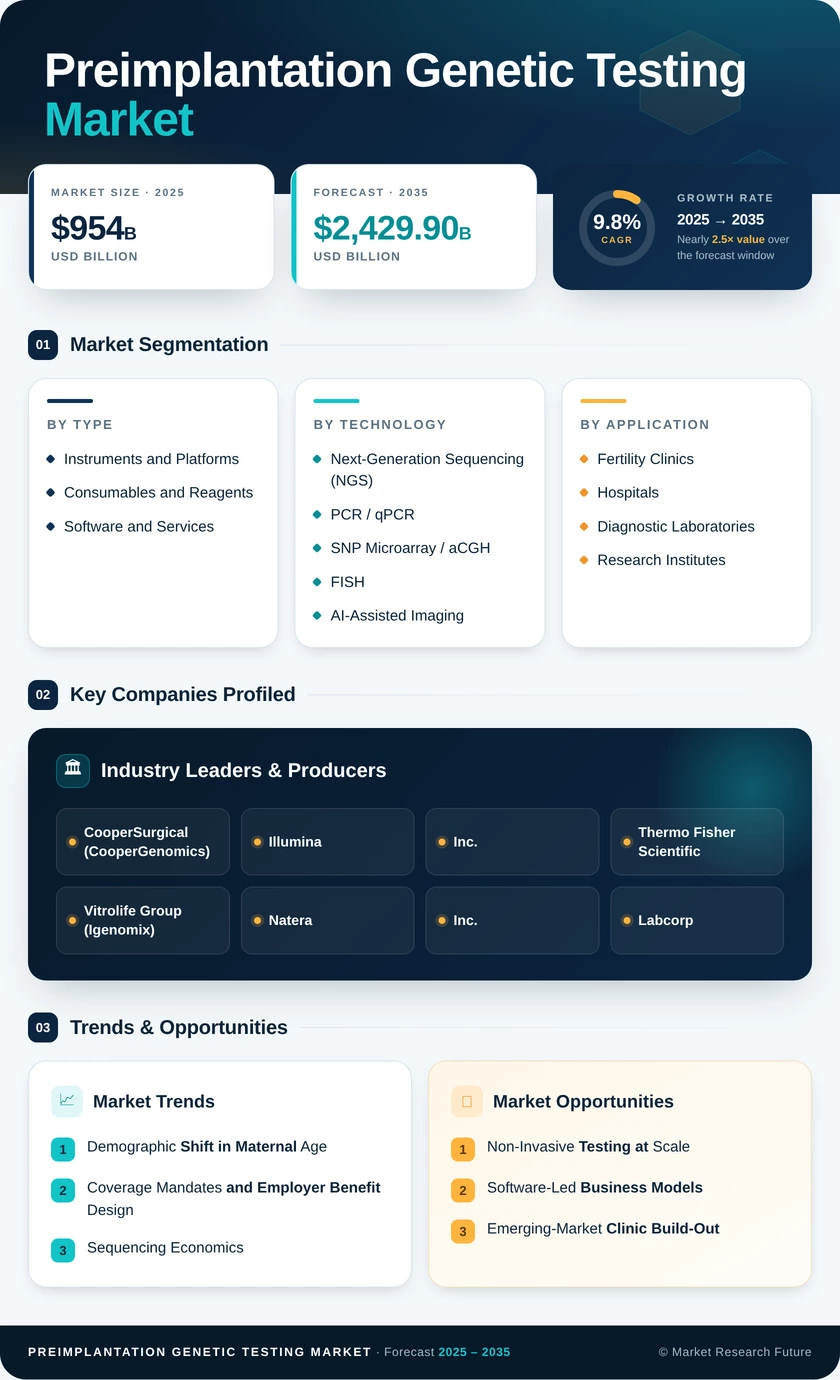
Preimplantation Genetic Testing Market (2026 - 2035)

Preimplantation Genetic Testing Market Research Report: Size, Share, Trend Analysis By Applications (Diagnostic Testing, Carrier Screening, Embryo Selection), By Technique (Polymerase Chain Reaction, Next Generation Sequencing, Fluorescence In Situ Hybridization, Single Nucleotide Polymorphism), By End Use (Fertility Clinics, Research Laboratories, Hospitals), By Client Type (Individuals, Healthcare Providers, Healthcare Institutions) and By Regional (North America, Europe, South America, Asia Pacific, Middle East and Africa) - Growth Outlook & Industry Forecast 2025 To 2035

Forecast Period
2026-2035
CAGR
9.8%
2025 Market Size
USD 954.0 Million
2035 Market Size
USD 2,429.9 Million
Healthcare ● Updated August 2026 Report ID: MRFR/HC/6649-HCR | Pages: 200 | Author: Nidhi Mandole, Rahul Gotadki
  1. 1 Market Summary |
    1. 1.1 Study Assumptions & Market Definition |
    2. 1.2 Scope of the Study |
    3. 1.3 Research Methodology
  2. 2 Key Report Takeaways |
    1. 2.1 By Technology |
    2. 2.2 By Sector |
    3. 2.3 By Geography
  3. 3 Market Size & Forecast (2021–2035) |
    1. 3.1 Historical Market Size (2021–2024) |
    2. 3.2 Base Year Estimate (2025) |
    3. 3.3 Forecast Market Size (2026–2035) |
    4. 3.4 Year-over-Year Growth Analysis
  4. 4 Driver Impact Analysis |
    1. 4.1 Demographic Shift in Maternal Age |
    2. 4.2 Coverage Mandates and Employer Benefit Design |
    3. 4.3 Sequencing Economics |
    4. 4.4 Machine Learning in Embryo Selection
  5. 5 Restraints Impact Analysis |
    1. 5.1 Cost Sensitivity Where Coverage Is Absent |
    2. 5.2 Contested Clinical Utility |
    3. 5.3 Mosaicism and Reporting Standards
  6. 6 Opportunities |
    1. 6.1 Non-Invasive Testing at Scale |
    2. 6.2 Software-Led Business Models |
    3. 6.3 Emerging-Market Clinic Build-Out |
    4. 6.4 Data Monetisation Through Outcome Registries |
    5. 6.5 Cross-Border Reimbursement Arbitrage
  7. 7 Regional Market Share & Country-Level Analysis |
    1. 7.1 North America | |
      1. 7.1.1 US | |
      2. 7.1.2 Canada | |
      3. 7.1.3 Mexico |
    2. 7.2 Europe | |
      1. 7.2.1 Germany | |
      2. 7.2.2 UK | |
      3. 7.2.3 France | |
      4. 7.2.4 Italy | |
      5. 7.2.5 Spain | |
      6. 7.2.6 Nordic Countries | |
      7. 7.2.7 Russia | |
      8. 7.2.8 Rest of Europe |
    3. 7.3 Asia-Pacific | |
      1. 7.3.1 China | |
      2. 7.3.2 India | |
      3. 7.3.3 Japan | |
      4. 7.3.4 South Korea | |
      5. 7.3.5 ASEAN | |
      6. 7.3.6 Rest of Asia-Pacific |
    4. 7.4 South America | |
      1. 7.4.1 Brazil | |
      2. 7.4.2 Argentina | |
      3. 7.4.3 Rest of South America |
    5. 7.5 Middle East & Africa | |
      1. 7.5.1 Saudi Arabia | |
      2. 7.5.2 UAE | |
      3. 7.5.3 South Africa | |
      4. 7.5.4 Egypt | |
      5. 7.5.5 Rest of Middle East & Africa
  8. 8 Future Outlook (2026–2035) |
    1. 8.1 Algorithmic Triage Becomes Standard of Care |
    2. 8.2 Non-Invasive Methods Reach Clinical Parity |
    3. 8.3 Payer Consolidation of Fertility Benefits |
    4. 8.4 Ethical Boundary-Setting on Expanded Screening
  9. 9 Market Segmentation Analysis |
    1. 9.1 By Test Type | |
      1. 9.1.1 Aneuploidy Screening (PGT-A) | |
      2. 9.1.2 Monogenic / Single-Gene Disorders (PGT-M) | |
      3. 9.1.3 Structural Rearrangements (PGT-SR) | |
      4. 9.1.4 Non-Invasive PGT | |
      5. 9.1.5 HLA Typing and Others |
    2. 9.2 By Technology | |
      1. 9.2.1 Next-Generation Sequencing (NGS) | |
      2. 9.2.2 PCR / qPCR | |
      3. 9.2.3 SNP Microarray / aCGH | |
      4. 9.2.4 FISH | |
      5. 9.2.5 AI-Assisted Imaging |
    3. 9.3 By Product and Service | |
      1. 9.3.1 Instruments and Platforms | |
      2. 9.3.2 Consumables and Reagents | |
      3. 9.3.3 Software and Services |
    4. 9.4 By Application | |
      1. 9.4.1 Aneuploidy and Maternal Age-Related Risk | |
      2. 9.4.2 Inherited Monogenic Disease | |
      3. 9.4.3 Chromosomal Translocation | |
      4. 9.4.4 HLA Typing | |
      5. 9.4.5 Other Applications |
    5. 9.5 By End User | |
      1. 9.5.1 Fertility Clinics | |
      2. 9.5.2 Hospitals | |
      3. 9.5.3 Diagnostic Laboratories | |
      4. 9.5.4 Academic & Research Institutes
  10. 10 Competitive Landscape |
    1. 10.1 Market Concentration Analysis |
    2. 10.2 Competitive Benchmarking Matrix |
    3. 10.3 Company Profiles | |
      1. 10.3.1 CooperSurgical (CooperGenomics) | |
      2. 10.3.2 Illumina, Inc. | |
      3. 10.3.3 Thermo Fisher Scientific | |
      4. 10.3.4 Vitrolife Group (Igenomix) | |
      5. 10.3.5 Natera, Inc. | |
      6. 10.3.6 Labcorp | |
      7. 10.3.7 Quest Diagnostics | |
      8. 10.3.8 Revvity | |
      9. 10.3.9 Yikon Genomics | |
      10. 10.3.10 Genea Biomedx | |
      11. 10.3.11 Fulgent Genetics | |
      12. 10.3.12 Agilent Technologies
  11. 11 Recent News & Developments
  12. 12 Report Scope & Methodology
  13. 13 Detailed Sources & Citations
  14. 14 Frequently Asked Questions
  15. 15 LIST OF TABLES |
  16. TABLE 1 Global Preimplantation Genetic Testing Market Size & Forecast (USD Million), 2021–2035 |
  17. TABLE 2 Global Preimplantation Genetic Testing Market — Year-over-Year Growth Analysis, 2021–2035 |
  18. TABLE 3 Driver Impact Analysis Matrix, 2026–2035 |
  19. TABLE 4 Restraint Impact Analysis Matrix, 2026–2035 |
  20. TABLE 5 Regional Market Summary (USD Million / Share / CAGR), 2025 |
  21. TABLE 6 North America Market Size, by Country, 2021–2035 (USD Million) |
  22. TABLE 7 Europe Market Size, by Country, 2021–2035 (USD Million) |
  23. TABLE 8 Asia-Pacific Market Size, by Country, 2021–2035 (USD Million) |
  24. TABLE 9 South America Market Size, by Country, 2021–2035 (USD Million) |
  25. TABLE 10 Middle East & Africa Market Size, by Country, 2021–2035 (USD Million) |
  26. TABLE 11 Market Size, by Test Type, 2021–2035 (USD Million) |
  27. TABLE 12 Market Size, by Technology, 2021–2035 (USD Million) |
  28. TABLE 13 Market Size, by Product and Service, 2021–2035 (USD Million) |
  29. TABLE 14 Market Size, by Application, 2021–2035 (USD Million) |
  30. TABLE 15 Market Size, by End User, 2021–2035 (USD Million) |
  31. TABLE 16 Competitive Benchmarking Matrix, 2026 |
  32. TABLE 17 Company Profiles — Key Players |
  33. TABLE 18 Recent Developments & Strategic Announcements, 2023–2025 |
  34. TABLE 19 Report Scope & Methodology Summary |
  35. TABLE 20 Detailed Sources & Citations Index
  36. 16 LIST OF FIGURES |
  37. FIGURE 1 Market Dynamics — Drivers, Restraints and Opportunities Overview |
  38. FIGURE 2 Industry Value Chain Analysis |
  39. FIGURE 3 Porter's Five Forces Analysis |
  40. FIGURE 4 Global Market Size Trend Line (USD Million), 2021–2035 |
  41. FIGURE 5 Year-over-Year Growth Curve, 2022–2035 |
  42. FIGURE 6 Share by Test Type, 2025 vs 2035 |
  43. FIGURE 7 Share by Technology, 2025 vs 2035 |
  44. FIGURE 8 Share by Product and Service, 2025 |
  45. FIGURE 9 Share by Application, 2025 |
  46. FIGURE 10 Share by End User, 2025 vs 2035 |
  47. FIGURE 11 Regional Share Distribution, 2025 |
  48. FIGURE 12 Regional CAGR Comparison, 2026–2035 |
  49. FIGURE 13 Country-Level Heat Map — Adoption Intensity |
  50. FIGURE 14 Competitive Landscape — Revenue Share Positioning, 2026 |
  51. FIGURE 15 Strategic Positioning Quadrant — Scale vs Innovation
Share::
Request Free Sample

Segmentation Quick Reference

DimensionSub-SegmentsDominant SegmentFastest Growing Segment
By Test TypeAneuploidy Screening (PGT-A); Monogenic / Single-Gene Disorders (PGT-M); Structural Rearrangements (PGT-SR); Non-Invasive PGT; HLA Typing and OthersAneuploidy Screening (PGT-A)Non-Invasive PGT
By TechnologyNext-Generation Sequencing (NGS); PCR / qPCR; SNP Microarray / aCGH; FISH; AI-Assisted ImagingNext-Generation Sequencing (NGS)AI-Assisted Imaging
By Product and ServiceInstruments and Platforms; Consumables and Reagents; Software and ServicesConsumables and ReagentsSoftware and Services
By ApplicationAneuploidy and Maternal Age-Related Risk; Inherited Monogenic Disease; Chromosomal Translocation; HLA Typing; Other ApplicationsAneuploidy and Maternal Age-Related RiskChromosomal Translocation
By End UserFertility Clinics; Hospitals; Diagnostic Laboratories; Research InstitutesFertility ClinicsDiagnostic Laboratories
By GeographyNorth America; Europe; Asia-Pacific; South America; Middle East & AfricaNorth AmericaAsia-Pacific


Market Segmentation Overview

By Test Type

Sub-SegmentKey Trend
Aneuploidy Screening (PGT-A)Attachment rates plateau in covered markets as payers demand utility evidence.
Monogenic / Single-Gene Disorders (PGT-M)Expanded carrier screening upstream is enlarging the referred population
Structural Rearrangements (PGT-SR)Recurrent-loss protocols standardising across accredited clinics
Non-Invasive PGTDay-six culture protocols lifting informativity toward clinical parity
HLA Typing and OthersNiche but high-value sibling donor matching demand persists.


Test-type mix is the clearest regional tell. Gulf and South Asian clinics run monogenic-heavy caseloads driven by consanguinity risk, while North American and Northern European practices skew toward age-related chromosomal work.

By Technology

Sub-SegmentKey Trend
Next-Generation Sequencing (NGS)Reagent cost per embryo continues falling as platforms scale
PCR / qPCRRetained for known familial mutations and rapid-result workflows
SNP Microarray / aCGHLegacy installed base servicing parental-origin questions
FISHConfined to low-resource settings and specific translocation checks
AI-Assisted ImagingMoving from research adjunct to pre-biopsy triage gatekeeper


Consolidation around sequencing has reduced platform choice to a practical duopoly at the high end, pushing differentiation into interpretation software and turnaround guarantees rather than chemistry.

By Product and Service

Sub-SegmentKey Trend
Instruments and PlatformsCapital purchases increasingly financed through reagent-rental structures
Consumables and ReagentsVolume-linked annuity revenue anchoring supplier economics
Software and ServicesPer-informative-result pricing models replacing perpetual licences


Revenue mix is migrating toward recurring streams, which raises supplier valuations and deepens switching costs for clinics locked into a single interpretation pipeline.

By Application

Sub-SegmentKey Trend
Aneuploidy and Maternal Age-Related RiskDemographic tailwind offsets utility-evidence headwinds
Inherited Monogenic DiseaseBespoke probe design sustains premium realised pricing.
Chromosomal TranslocationGrowing referral volume from recurrent pregnancy loss clinics
HLA TypingSmall volume, high clinical urgency, limited price sensitivity
Other ApplicationsMitochondrial and research indications expanding slowly.


Application mix determines margin more than volume. Clinics with heavy monogenic caseloads earn better economics per cycle despite handling fewer embryos.

By End User

Sub-SegmentKey Trend
Fertility ClinicsChain consolidation shifting procurement to national contracts
HospitalsAcademic ART units driving protocol development and validation.
Diagnostic LaboratoriesOutsourced reference volume rising among sub-scale clinics.
Research InstitutesMethod validation work funding non-invasive protocol advances


End-user concentration is rising sharply in North America and the UK, where chain groups now negotiate on behalf of dozens of sites — a structural change that compresses vendor pricing while raising contract stability.

By Region

Sub-SegmentKey Trend
North AmericaExcepted-benefit rulemaking could reset covered patient volumes
EuropeReimbursement code expansion and cross-border patient concentration
Asia-PacificPlanned clinic capacity outpacing domestic testing infrastructure.
South AmericaPrivate-pay demand concentrated in Brazilian and Argentine cities.
Middle East & AfricaSovereign health programmes funding monogenic-heavy caseloads


Geographic performance follows payer architecture rather than clinical need, which is why regional forecasts hinge on legislative calendars as much as on birth-rate curves.




Share::
Request Free Sample
Download PDF ×

We do not share your information with anyone. However, we may send you emails based on your report interest from time to time. You may contact us at any time to opt-out.