Shore Power Market (2026 - 2035)

Shore Power Market Size, Share & Growth Analysis Report By Type (Shoreside Installation, Ship-Side Installation), By Component (Frequency Converters, Transformers, Switchgear Devices, Others), By Power Output (Up to 5 MVA, 5 to 10 MVA, Above 10 MVA), By Application (Container Vessels, Cruise Ships, Commercial Ports, Naval Ports, Tankers) and By Regional (North America, Europe, South America, Asia Pacific, Middle East and Africa) – Industry Growth & Forecast to 2035
ID: MRFR/EnP/6881-CR
111 Pages
Anshula Mandaokar
Last Updated: June 29, 2026
Shore Power Market
Market Size
Forecast Period2026-2035
CAGR (2026-2035)11.1%
2025 Market SizeUSD 2.56 Billion
2035 Market SizeUSD 7.33 Billion
Key Players
Siemens Energy
ABB Ltd
Schneider Electric
Cavotec
Wärtsilä
Hitachi Energy
Opportunities
  • Battery Energy Storage Co-Location at Ports
  • Emerging Market Port Modernization
  • Shore Power as a Digital Service Platform

Shore Power Market Summary

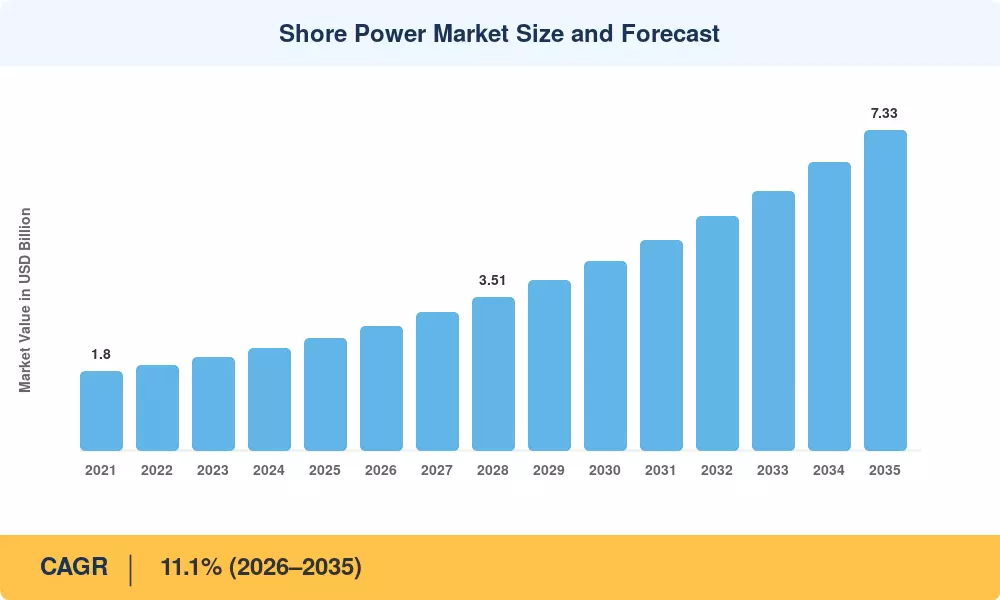
The Shore Power Market reached an estimated USD 2.56 Billion in 2025 and is projected to grow from USD 2.84 Billion in 2026 to USD 7.33 Billion by 2035, registering a CAGR of 11.1% during the forecast period (2026–2035). Tightening emission mandates from the International Maritime Organization (IMO) and regional bodies such as the European Union, which now require at-berth emission reductions of up to 90% for vessels calling at major ports, are the primary catalysts propelling the Shore Power Market forward [1]. National port-electrification funds—including the U.S. EPA's USD 3 billion Clean Ports Program and China's Green Port Action Plan—are accelerating capital deployment at an unprecedented pace [2].

A structural shift is underway as ports retire diesel-powered auxiliary engine operations in favor of grid-connected electrical supply systems. Frequency converters, high-voltage switchgear, and automated cable-management systems now form the backbone of modern berth electrification projects, replacing ad-hoc generator setups that dominated the previous decade. The European Commission's FuelEU Maritime regulation, effective 2025, obligates container and cruise terminals across TEN-T core ports to install power supply infrastructure, unlocking an estimated EUR 1.5 billion in planned capital expenditure through 2030 [3].

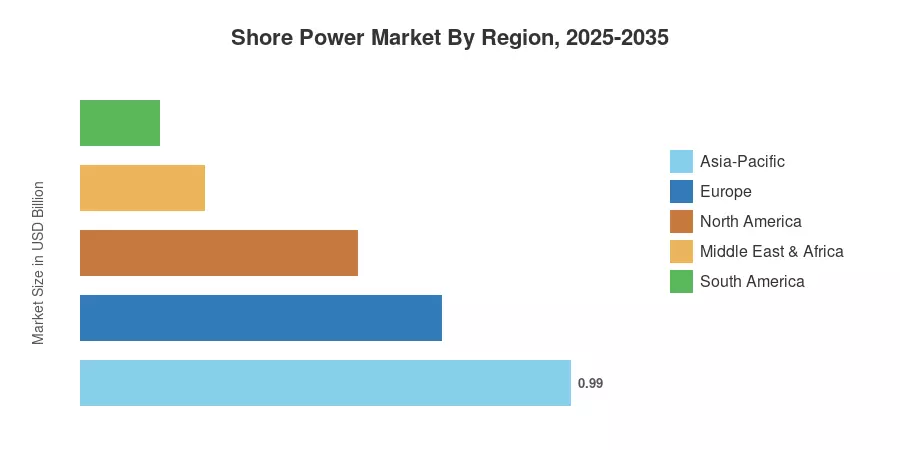
Asia-Pacific commands the largest share of the Shore Power Market at roughly 38.8% of global revenue in 2025, driven by China's aggressive port modernization program and South Korea's green shipping corridor investments. The region also records the fastest growth trajectory at approximately 11.9% CAGR through 2035. Europe holds the second-largest position with around 28.5% share, supported by mandatory cold ironing regulations across Scandinavian and Mediterranean ports. North America follows at 21.7%, with momentum building as federal incentive programs reach the disbursement phase. The Shore Power Market is poised for a decade of sustained double-digit expansion as regulatory tailwinds, renewable energy integration, and rising vessel electrification converge.


Key Report Takeaways

• By Type

  • Shoreside installations dominated the Shore Power Market with approximately 72.0% revenue share in 2024, reflecting heavy port-side infrastructure investment globally.
  • Ship-side installations are projected to expand at a 15.4% CAGR through 2035 as retrofit mandates compel vessel operators to equip onboard connection systems.

• By Component

  • Frequency converters accounted for roughly 38.2% of the Shore Power Market in 2024, critical for bridging 50 Hz/60 Hz grid-to-ship frequency mismatches.
  • Transformers are advancing at a 13.5% CAGR, driven by rising voltage requirements of mega-container vessels and cruise ships.

• By Application

  • Container vessels captured approximately 38.5% of the Shore Power Market revenue in 2024, reflecting the high volume of container port calls globally.
  • Cruise ships represent the fastest-growing application segment at a 14.6% CAGR, propelled by passenger-line sustainability commitments.

• By Region

  • Asia-Pacific led the Shore Power Market with 38.8% share in 2025, anchored by port electrification mandates in China, Japan, and South Korea.
  • Europe maintains steady momentum with 28.5% share, backed by binding EU at-berth emission rules across TEN-T ports.


Market Size and Forecast (2021–2035)

Market Research Future's sizing model integrates bottom-up port-level installation data, vessel call frequency analysis, government procurement disclosures, and top-down macro energy transition benchmarks. Historical figures (2021–2024) are triangulated against customs data, utility connection permits, and OEM revenue disclosures. Forecast estimates (2026–2035) apply a calibrated compound growth model reflecting policy timelines, vessel fleet renewal cycles, and grid-readiness assessments.
Shore Power Market Size and Forecast
Our Impact
Enabled $4.3B Revenue Impact for Fortune 500 and Leading Multinationals
Partnering with 2000+ Global Organizations Each Year
30K+ Citations by Top-Tier Firms in the Industry

Driver Impact Analysis

Driver ~% Impact on CAGR Geographic Relevance Impact Timeline
IMO and regional at-berth emission mandates ~20% Global Short-term (≤2 yr)
Government port-electrification subsidies ~18% Europe, North America Medium-term (2–4 yr)
Declining renewable electricity tariffs ~15% Global Medium-term (2–4 yr)
Cruise and mega-vessel fleet expansion ~12% Europe, Asia-Pacific Long-term (≥4 yr)
ESG reporting and green port certification ~10% Europe, Asia-Pacific Medium-term (2–4 yr)
Urban air-quality regulations near port zones ~8% Asia-Pacific, North America Short-term (≤2 yr)
Longer vessel dwell times raising utilization ~7% Global Long-term (≥4 yr)


IMO and Regional At-Berth Emission Mandates

The IMO's revised greenhouse gas strategy targets a 20% reduction in international shipping emissions by 2030 relative to 2008 levels, while the EU's FuelEU Maritime regulation mandates zero-emission technologies at berth for container and passenger vessels in TEN-T core ports from 2030 [1][3]. California's At-Berth Regulation, already enforced since 2023, requires container, cruise, and refrigerated cargo vessels to cut auxiliary-engine emissions by 90%, creating a compliance model other jurisdictions are replicating. These layered mandates translate directly into procurement orders for the Shore Power Market, as port authorities face statutory deadlines with financial penalties for non-compliance.

Government Port-Electrification Subsidies

The U.S. EPA Clean Ports Program has made USD 3 billion in grants and refunds available for zero-emission port equipment and infrastructure, with shore power systems being a major eligible category [2]. In Europe, the Connecting Europe Facility has designated EUR 700 million for alternative fuels infrastructure at marine nodes, including direct subsidies for the installation of transformers and frequency converters. South Korea’s Ministry of Oceans and Fisheries intends to invest 480 billion won in electrifying 30 major docks by 2028. These public financing sources de-risk private investment and reduce payback timeframes for the Shore Power Market from seven years to under four in subsidized corridors.


Declining Renewable Electricity Tariffs

In its 2024 Renewable Power Generation Costs study, IRENA found a global weighted-average levelized cost of energy for onshore wind of USD 0.033/kWh – a 70% reduction over the past decade [10]. Ports in renewable-surplus regions such as Scandinavia, Iberia, and coastal China can supply grid electricity to vessels at rates far below low-sulfur marine fuel substitutes. This economic advantage shifts the Shore Power Market value proposition from a compliance cost to an operational savings opportunity, especially for boats with dwell durations longer than eight hours.


Cruise and Mega-Vessel Fleet Expansion

The cruise fleet is predicted to grow by 58 ships between 2025 and 2030, with a global average passenger capacity of over 5,000 per ship [9]. Larger vessels require more auxiliary power (typically in excess of 10 MVA) so that shore-side power connections are economically appealing compared with the operation of several diesel generators at berth. This industry is a strong beneficiary of the Shore Power Market as cruise ports are usually located near urban areas where regulations on emissions are the tightest and the pressure for clean operations is greatest.


Restraints Impact Analysis

Restraint percentages reflect estimated headwinds against baseline growth potential. They are directional and do not mechanically reduce the CAGR figure.

Restraint ~% Impact on CAGR Geographic Relevance Impact Timeline
High upfront infrastructure capital costs ~-15% Global Short-term (≤2 yr)
Grid capacity constraints at port locations ~-12% Emerging markets Medium-term (2–4 yr)
Lack of global connection standardization ~-10% Global Long-term (≥4 yr)
Low vessel retrofit adoption rates ~-8% Global Medium-term (2–4 yr)
Competition from LNG bunkering and scrubbers ~-7% Global Long-term (≥4 yr)


High Upfront Infrastructure Capital Costs

Depending on grid distance, transformer capacity, and civil works requirements, a single high-voltage shore connection berth capable of feeding mega-container vessels costs between USD 5 million and USD 15 million [14]. Without subsidy support, the payback period exceeds eight years for mid-sized ports with less than 500 vessel calls per year, deterring investment. This capital intensity disproportionately affects the Shore Power Market in developing economies, where port authorities have tight budgets and conflicting development priorities.


Grid Capacity Constraints at Port Locations

Many ports, especially in Southeast Asia, Sub-Saharan Africa, and parts of South America, lack the grid headroom to provide 10–20 MVA of continuous power per berth without major upstream network strengthening [15]. Distribution grid upgrades can add 30-50% to project costs and 18-24 months to commissioning schedules. Grid limitations will impede Shore Power Market growth trajectory in otherwise high-potential emerging corridors until utility co-investment arrangements and dedicated port substations become the norm.


Lack of Global Connection Standardization

While the IEC/IEEE 80005-1 standard covers high-voltage shore connections for large vessels, compliance remains voluntary in most jurisdictions, and plug/socket configurations vary across manufacturers and port authorities [16]. Vessel operators calling at multiple ports face the risk of incompatible connections, undermining confidence in ship-side retrofit investments. Harmonization efforts through IMO and ISO are progressing, but are unlikely to reach binding global adoption before 2030, leaving the Shore Power Market exposed to fragmentation risk in the interim.


Shore Power Market Opportunities

Battery Energy Storage Co-Location at Ports

Integrating battery storage systems alongside shore power installations enables ports to manage peak demand charges, provide grid-balancing services, and supply vessels during grid outages. Ports in California and Norway have piloted 5–20 MWh storage systems that reduce utility demand charges by up to 40%, creating an ancillary revenue stream that accelerates Shore Power Market infrastructure payback.

Emerging Market Port Modernization

Ports across India, Vietnam, Brazil, and the UAE are undertaking multi-billion-dollar expansion programs that provide greenfield opportunities for integrated shore power design. India's Sagarmala initiative alone targets an overall grand portfolio of over USD 70 billion in port modernization spending through 2035, with electrification now embedded as a baseline requirement for new berth construction. The Shore Power Market stands to benefit from these build-once-build-right capital programs.

Shore Power as a Digital Service Platform

Port operators are beginning to monetize shore power connections through data-driven services—real-time emission certificates, carbon-credit generation, dynamic pricing algorithms, and predictive maintenance dashboards. This platform approach transforms the Shore Power Market from a hardware sale into a recurring-revenue model, improving margins for infrastructure providers and creating new competitive advantages tied to software integration.

Autonomous and Robotic Cable Management Systems

Automated plug-in systems using robotic arms and magnetic coupling reduce connection times from 45 minutes to under five, improving utilization rates and reducing labor costs. Cavotec's MoorMaster and similar platforms are demonstrating that automation can raise annual connection rates by 30–40%, directly expanding the addressable Shore Power Market by making short-dwell-time calls economically viable.

Green Shipping Corridor Anchor Infrastructure

The Clydebank Declaration's target of establishing at least six green shipping corridors by 2025 positions shore power as foundational infrastructure for zero-emission trade routes. Each corridor requires electrified berths at both origin and destination ports, effectively doubling installation demand per route and creating a multiplier effect for the Shore Power Market.


Shore Power Market Future Outlook

Autonomous Port Electrification and AI-Driven Load Management

Artificial intelligence is poised to transform Shore Power Market operations through predictive vessel-arrival scheduling, dynamic load balancing, and automated connection management. Ports deploying AI-based energy management systems report 15–20% improvement in grid utilization efficiency, reducing idle capacity costs and enabling higher throughput per installed MVA [21]. By 2030, autonomous connection robots paired with machine-learning algorithms will likely handle over 40% of new shore power connections at major terminals.

Electrification Supercycle and Grid Integration

The broader energy transition is creating an electrification supercycle that positions ports as critical nodes in national grid architecture. The IEA projects global electricity demand to grow 25% to 30% by 2050, with transportation electrification—including maritime shore connections—representing a significant demand source [22]. Shore Power Market infrastructure will increasingly serve dual purposes: vessel supply during berth hours and grid-stabilization assets during off-peak periods through vehicle-to-grid analogues.

ESG Compliance and Carbon Market Integration

As mandatory Scope 3 emission reporting expands under ISSB and EU CSRD frameworks, shipping companies face growing pressure to document at-berth emission reductions. The Shore Power Market directly supports these disclosure requirements by providing verifiable, metered electricity consumption records that translate into quantifiable emission offsets. Carbon credit registries such as Verra and Gold Standard are developing maritime-specific methodologies that could assign tradeable credits to shore power utilization, adding a financial incentive layer [11].

Modular and Floating Shore Power Solutions

Emerging designs for barge-mounted and modular containerized shore power units offer deployment flexibility for ports unable to justify permanent fixed installations. These solutions, already piloted in Amsterdam and Hamburg, reduce capital expenditure by 40–50% compared with conventional fixed systems and can be relocated between berths or ports as demand shifts [23]. This modular approach will open the Shore Power Market to hundreds of smaller ports currently excluded by high fixed-infrastructure costs.


Shore Power Market Segmentation

By Type

Segment Key Metric Primary Demand Driver
Shoreside Installation 72.0% share (2024) Port authority mandates and subsidy programs
Ship-Side Installation 15.4% CAGR (2026–2035) Vessel retrofit regulations and newbuild specs


Shoreside installations continue to dominate the Shore Power Market because port authorities bear primary regulatory responsibility for at-berth emission compliance. These systems encompass substations, frequency converters, cable-management infrastructure, and grid connection points. Capital costs range from USD 2 million for a basic low-voltage berth to USD 15 million for a high-voltage multi-berth system capable of serving cruise and mega-container vessels simultaneously.

Ship-side installations represent the faster-growing segment as classification societies and flag states begin mandating onboard connection readiness. IMO guidelines and EU regulations increasingly require new vessels above 5,000 GT to be shore-power-ready at delivery, shifting investment toward onboard transformers, switchgear, and connection panels. The Shore Power Market for ship-side equipment benefits from the 30,000+ vessel global fleet that will require retrofitting or replacement over the next decade.

By Component

Segment Key Metric Primary Demand Driver
Frequency Converters 38.2% share (2024) 50/60 Hz grid-ship frequency mismatch
Transformers 13.5% CAGR (2026–2035) Rising voltage demands from larger vessels
Switchgear Devices USD 0.38 Billion (2025) Safety and protection requirements
Others 8.9% CAGR (2026–2035) Cable reels, connectors, automation systems


Frequency converters hold the largest component share in the Shore Power Market because international trade routes connect ports operating on different grid frequencies. A vessel built for 60 Hz operation calling at a 50 Hz port requires frequency conversion to safely draw grid power, making these units indispensable at virtually every internationally oriented terminal. Transformers are growing fastest as vessel power demands escalate—modern cruise ships can draw 16–20 MVA at berth, requiring dedicated step-down units from medium-voltage port distribution networks.

By Power Output

Segment Key Metric Primary Demand Driver
Up to 5 MVA USD 0.42 Billion (2025) Smaller commercial and naval vessels
5 to 10 MVA 44.8% share (2024) Standard container and tanker berths
Above 10 MVA 14.2% CAGR (2026–2035) Cruise ships and mega-container vessels


The 5–10 MVA segment dominates the Shore Power Market because it aligns with the power requirements of standard container berths and mid-sized commercial vessels. Systems above 10 MVA are the fastest-growing category, driven by the proliferation of ultra-large container ships (ULCS) and next-generation cruise vessels that draw significantly more auxiliary power at berth.

By Application

Segment Key Metric Primary Demand Driver
Container Vessels 38.5% share (2024) High call frequency and regulatory pressure
Cruise Ships 14.6% CAGR (2026–2035) Passenger-line ESG commitments
Commercial Ports USD 0.36 Billion (2025) Multi-purpose terminal electrification
Naval Ports 9.8% CAGR (2026–2035) Military sustainability directives
Tankers USD 0.18 Billion (2025) Refinery-adjacent emission zones


Container vessels lead the Shore Power Market application revenue because container ports handle the highest annual call volumes globally—the top 20 container ports collectively process over 350 million TEU annually, translating into tens of thousands of potential shore power connections per year. Cruise ships represent the fastest-growing application as major cruise lines, including Royal Caribbean, MSC, and Carnival, have committed to 100% shore power readiness for newbuilds delivered after 2025 [9].


Regional Market Share Analysis

Region Key Metric Primary Investment Themes
Asia-Pacific 38.8% share (2025) China green port mandates, South Korea green corridors
Europe 28.5% share (2025) FuelEU Maritime compliance, Scandinavian leadership
North America 21.7% share (2025) EPA Clean Ports Program, California regulation
South America USD 0.16 Billion (2025) Brazilian port modernization, Sagarmala-style programs
Middle East & Africa 9.6% CAGR (2026–2035) UAE hub port strategy, South African port upgrades
Total USD 2.56 Billion (2025)

The Shore Power Market exhibits significant regional variation driven by regulatory maturity, grid infrastructure quality, and vessel traffic density. Asia-Pacific and Europe together account for over two-thirds of global revenue, though emerging markets in South America and the Middle East are beginning to attract meaningful investment.


North America

Country Key Metric Key Driver
US 74.2% of regional share EPA Clean Ports Program, California At-Berth Regulation
Canada 15.8% of regional share Vancouver and Montreal port green programs
Mexico 10.0% of regional share Manzanillo and Lázaro Cárdenas expansion projects


The Shore Power Market in North America is anchored by the United States, where California's At-Berth Regulation has served as a regulatory blueprint for other coastal states. The EPA's Clean Ports Program is disbursing grants across 55 port projects, with shore power installations accounting for roughly 35% of awarded funding [2]. Canada's Vancouver Fraser Port Authority has committed to 100% shore power availability at cruise berths by 2028, while Mexico's Pacific coast container terminals are incorporating electrification into their latest expansion plans under the national port master plan.

Europe

Country Key Metric Key Driver
Germany 11.5% CAGR Hamburg and Bremerhaven mandatory berth electrification
UK USD 0.11 Billion (2025) Clean Maritime Plan, Southampton port investment
France 10.8% CAGR Le Havre and Marseille TEN-T compliance
Italy USD 0.08 Billion (2025) Genoa and Civitavecchia cruise terminal upgrades
Spain 9.7% CAGR Barcelona and Valencia green port strategies
Nordic Countries USD 0.14 Billion (2025) Early-mover advantage, renewable surplus grids
Russia 7.5% CAGR Arctic port modernization programs
Rest of Europe USD 0.09 Billion (2025) Port of Piraeus, Antwerp-Bruges expansions


Europe's Shore Power Market benefits from the most prescriptive regulatory environment globally. The EU Alternative Fuels Infrastructure Regulation requires TEN-T core maritime ports to provide shore power by 2030, covering over 80 ports across the continent [3]. Nordic countries—particularly Norway and Sweden—maintain a first-mover position with shore power penetration rates exceeding 60% at major cruise terminals, leveraging abundant hydroelectric supply to offer grid electricity at rates below EUR 0.05/kWh.

Asia-Pacific

Country Key Metric Key Driver
China 44.6% of regional share Green Port Action Plan, coastal emission control areas
India 13.8% CAGR Sagarmala initiative, new port construction
Japan USD 0.09 Billion (2025) GX Green Transformation funding
South Korea 12.1% CAGR Green shipping corridor investments
ASEAN USD 0.06 Billion (2025) Singapore and Malaysia hub port upgrades
Rest of Asia-Pacific 10.4% CAGR Australia, Taiwan port electrification pilots


China dominates the Asia-Pacific Shore Power Market through aggressive policy implementation. The Ministry of Transport mandated shore power installations at all berths handling vessels above 3,000 GT in designated emission control areas by 2025, covering 570+ berths across 11 coastal provinces [6]. India represents the highest-growth opportunity as the Sagarmala initiative channels investment into 12 new mega-port projects with built-in electrification specifications.

South America

Country Key Metric Key Driver
Brazil 62.5% of regional share Santos and Paranaguá port expansion
Argentina 10.6% CAGR Buenos Aires port modernization
Rest of South America USD 0.03 Billion (2025) Chile, Colombia, early-stage port investments


The Shore Power Market in South America remains nascent but is gaining traction as Brazilian ports integrate electrification into expansion master plans. The Port of Santos—Latin America's busiest—approved a USD 280 million modernization program that includes shore power at six container berths, signaling a regional shift toward compliance-ready infrastructure [19].

Middle East & Africa

Country Key Metric Key Driver
Saudi Arabia 10.2% CAGR NEOM port development, Vision 2030
UAE 38.8% of regional share Jebel Ali and Khalifa Port hub strategy
South Africa USD 0.02 Billion (2025) Durban and Cape Town port upgrades
Egypt 9.1% CAGR Suez Canal Economic Zone development
Rest of MEA USD 0.02 Billion (2025) Morocco, Kenya port projects


The Shore Power Market in the Middle East is driven by hub-port competition. The UAE's Jebel Ali and Khalifa Port are investing in berth electrification to maintain competitive positioning against rival transshipment hubs, while Saudi Arabia's NEOM megaproject includes fully electrified port infrastructure as part of its zero-carbon city design [20].


Shore Power Market By Region, 2025-2035

Competitive Benchmarking

The Shore Power Market exhibits moderate concentration, with the top five players accounting for an estimated 38–42% of global revenue. The Herfindahl-Hirschman Index sits in the 800–1,200 range, indicating a moderately fragmented competitive field where electrical infrastructure conglomerates compete alongside specialized marine-electrical firms. Competition centers on integrated system delivery—bundling frequency converters, transformers, switchgear, and digital management platforms into turnkey port electrification solutions.

Company Est. Revenue Share Range Key Offerings for Shore Power Market Strategic Positioning
Siemens Energy ~9–12% SIPLINK frequency converters, SIHARBOR systems Integrated energy solutions, European leadership
ABB Ltd ~8–11% Shore-to-ship power systems, HVSC modules Global project delivery, marine segment strength
Schneider Electric ~7–10% Medium-voltage switchgear, grid integration Smart-grid convergence, sustainability branding
Cavotec ~5–7% MoorMaster automated mooring, AMP systems Automation and robotic connection specialist
Wärtsilä ~4–6% Shore connection systems, power conversion Marine OEM integration, lifecycle services
Hitachi Energy ~3–5% Transformers, HVDC shore power systems Grid infrastructure expertise, Asian markets
Cochran Marine ~2–4% Bespoke shore power engineering, naval systems Naval and defense port specialization
ZPMC ~2–4% Port equipment integration, containerized power Chinese port ecosystem, cost leadership
Danfoss (Vacon) ~2–3% Variable frequency drives, power electronics Component-level specialization, Nordic presence
Stemmann-Technik ~1–3% Cable reels, plug systems, and connector hardware Connection hardware niche, German engineering


Recent News & Developments


  • ABB (January 2026): Finalized a milestone commercial contracting agreement with Rotterdam Shore Power (RSP) to engineer and deliver multi-megawatt shoreside electricity substations, creating the world’s largest unified container shore power grid.
  • European Commission (July 2024): Published final technical standards under the Alternative Fuels Infrastructure Regulation, establishing uniform shore power connection specifications for all TEN-T core ports by 2030 [3].


  • China Ministry of Transport (January 2024): Announced mandatory shore power utilization rates of 80% at all tier-one ports by 2026, expanding the scope of the Green Port Action Plan [6].
  • Royal Caribbean Group (September 2023): Committed to equipping 100% of its fleet with shore power connectivity by 2027, representing 65 vessels across five brands [9].


Shore Power Market Report Scope

Parameter Detail
Market Scope Global Shore Power Market covering shoreside and ship-side installations, components, power output classes, and applications
Study Period 2021–2035
CAGR (Forecast Period) 11.1% (2026–2035)
Base Year Market Size USD 2.56 Billion (2025)
Forecast Endpoint USD 7.33 Billion (2035)
Fastest Growing Segment Ship-Side Installation (by type); Above 10 MVA (by power output)
Companies Profiled 10 (Siemens Energy, ABB, Schneider Electric, Cavotec, Wärtsilä, Hitachi Energy, Cochran Marine, ZPMC, Danfoss, Stemmann-Technik)
Valuation Currency USD Billion


FAQs

What is the typical payback period for a shore power installation at a mid-sized port?
Payback ranges from four to eight years, depending on berth utilization rates, local electricity tariffs, and available subsidies. Ports with over 600 annual vessel calls and subsidy coverage typically recover capital within five years [14].
How do vessel operators select between shore power retrofits and alternative compliance methods like scrubbers?
Shore power eliminates at-berth emissions entirely, while scrubbers reduce only SOx. Jurisdictions mandating NOx and particulate reductions increasingly make shore power the sole compliant option [18].
What grid upgrades are typically required before a port can install shore power?
Most installations need a dedicated medium-voltage feeder, a port substation, and frequency conversion equipment. Grid reinforcement costs generally add 25–40% to total project budgets [15].
How does the Shore Power Market address frequency incompatibility between global grids?
Frequency converters bridge the 50/60 Hz divide, enabling vessels built for either standard to connect at any equipped port. These units represent the single largest component cost in most installations [16].
What role do classification societies play in shore power adoption?
Societies like DNV and Lloyd's Register set vessel-side technical standards and certify onboard connection systems. Their notation requirements increasingly mandate shore power readiness for new vessel classes [17].
Can shore power systems generate revenue for port authorities beyond emission compliance?
Ports earn revenue through connection tariffs, carbon-credit issuance, and demand-response grid services. Some European ports report net-positive returns within three years of commissioning [23].
How does the Shore Power Market differ between cruise and container terminal applications?
Cruise terminals require higher power capacity (10–20 MVA per berth) but serve fewer annual calls, while container berths need lower capacity (3–11 MVA) with far higher connection frequency [9].    
Author
Author
Author Profile
Anshula Mandaokar LinkedIn
Team Lead - Research
Anshula Mandaokar holds an academic degree in Chemical Engineering and has been contributing to the field for more than 5 years. She has expertise in Market Research and Business Consulting and serves as a Team Lead for a reputed Market Research firm under the Chemicals and Materials domain spectrum. She has worked on multiple projects, generating explicit results in a quick turnaround time. Her understanding of data interpretation justifies her role as a leader.
Download Free Sample

Kindly complete the form below to receive a free sample of this Report

Download PDF ×

We do not share your information with anyone. However, we may send you emails based on your report interest from time to time. You may contact us at any time to opt-out.
















