Smart TV Market (2026 - 2035)

Smart TV Market Size, Share and Research Report By Resolution (HD / Full HD, 4K UHD, 8K UHD), By Screen Size (Up to 32 Inch, 33–45 Inch, 46–55 Inch, Above 55 Inch), By Panel / Display Technology (LED / LCD, OLED, QLED, Mini-LED, Other (MicroLED, Laser TV)), By Screen Shape (Flat, Curved), By Operating System (Android TV (Google TV), Other / OEM Proprietary (Tizen, webOS, Roku OS, Fire OS)), By Distribution Channel (Offline Retail, Online) and By Regional (North America, Europe, South America, Asia Pacific, Middle East and Africa) - Industry Forecast to 2035.
ID: MRFR/SEM/6916-HCR
100 Pages
Kiran Jinkalwad, Aarti Dhapte
Last Updated: August 04, 2026
Smart TV Market
Market Size
Forecast Period2026-2035
CAGR (2026-2035)2.84%
2025 Market SizeUSD 247.52 Billion
2035 Market SizeUSD 327.48 Billion
Key Players
Samsung Electronics
LG Electronics
Sony Corporation
TCL Technology
Hisense Group
Xiaomi
Opportunities
  • Premium Large-Format Panel Upcycle
  • Emerging-Market Volume Expansion
  • Data Monetisation and Advertising Operating Systems

Smart TV Market Summary

The global Smart TV Market reached an estimated USD 247.52 Billion in 2025 and is forecast to grow from USD 254.55 Billion in 2026 to USD 327.48 Billion by 2035, registering a compound annual growth rate of 2.84% during 2026–2035. Two catalysts underpin this trajectory: widespread fiber-to-the-home (FTTH) deployments that have pushed fixed-broadband penetration above 65% in major economies [1], and national production-linked incentive (PLI) schemes—most prominently India's USD 2.4 billion electronics manufacturing subsidy program—that are pulling assembly capacity closer to demand centers [2]. Falling panel prices for 55- to 65-inch 4K sets continue to shift the volume mix upward even as average selling prices compress.

There is an ongoing cycle of technological replacement. While cloud-gaming collaborations with Xbox and NVIDIA GeForce NOW have made 120 Hz panels a mid-tier expectation rather than a premium feature, legacy edge-lit LCD panels are making way to Mini-LED backlighting architectures that reduce the contrast gap with OLED at a fraction of the cost [3]. By 2028, the ITU projects that over 1.8 billion households globally will have a connected television, solidifying the Smart TV Market's position as the main interface for both subscription streaming and ad-supported FAST channels [4].

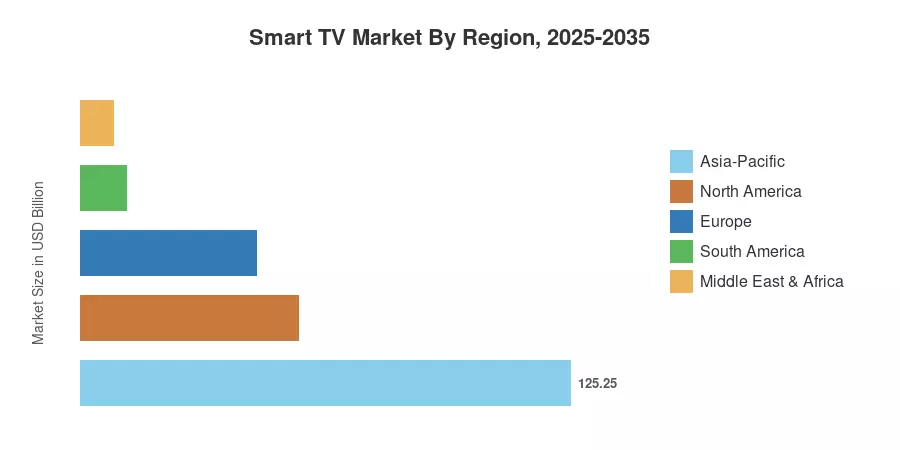
With China's vertically integrated panel production chain and South Korea's dominance in the OLED and QLED categories, Asia-Pacific accounts for about 50.6% of the world's smart TV market revenue. With a predicted 3.37% CAGR, the Middle East and Africa is the fastest-growing market due to mobile money-financed installment plans that are opening doors for first-time purchasers throughout sub-Saharan Africa [5]. Despite lengthier replacement cycles in Western markets, Europe maintains the second-largest share at roughly 18.2%, driven by demand for premium panels larger than 65 inches. These factors put the smart TV market in a position to grow steadily over the next ten years, albeit moderately.


Key Report Takeaways

• By Resolution


  • 4K UHD panels captured approximately 61.2% of Smart TV Market revenue in 2025, confirming ultra-high definition as the mainstream standard.


• By Panel Technology

  • Mini-LED backlighting is advancing at the fastest pace among display technologies, projected to sustain a 3.45% CAGR through 2035.
  • LED/LCD technology retained a dominant share in the Smart TV Market, although OLED and QLED continue to gain ground in premium tiers.

• By Screen Size

  • The 46–55 inch bracket represented 39.4% of 2025 revenue, making it the single largest size category.


• By Distribution

  • Online distribution channels are outpacing offline retail, growing at an estimated 3.82% CAGR as direct-to-consumer and e-commerce penetration deepens.

• By Region

  • Asia-Pacific contributed an estimated 50.6% of the Smart TV Market in 2025, led by China, India, and South Korea.
  • The Middle East & Africa is the fastest-growing region at 3.37% CAGR, as mobile-money financing models unlock volume demand in previously underserved territories.


Market Size and Forecast (2021–2035)

Market Research Future employs a triangulated estimation methodology combining bottom-up panel-shipment data from leading display supply-chain trackers, top-down macroeconomic modelling aligned with IMF GDP projections, and primary interviews with OEM procurement teams and regional distributors. Historical figures reflect actual trade data; forecast values apply a calibrated CAGR of 2.84% from the 2026 base.
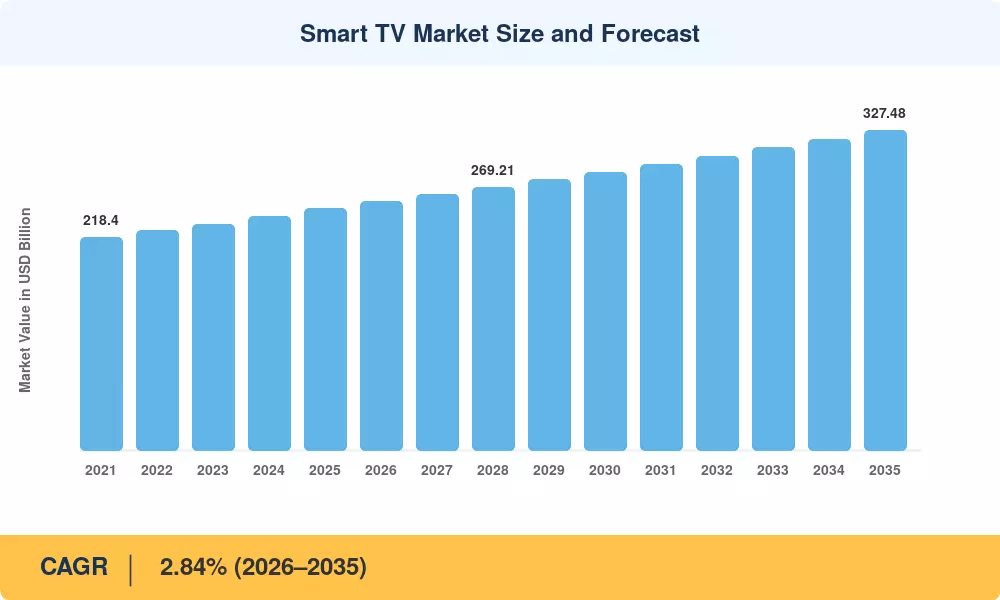
Smart TV Market Size and Forecast
Our Impact
Enabled $4.3B Revenue Impact for Fortune 500 and Leading Multinationals
Partnering with 2000+ Global Organizations Each Year
30K+ Citations by Top-Tier Firms in the Industry

Driver Impact Analysis

Driver ~% Impact on CAGR Geographic Relevance Impact Timeline
FTTH & broadband expansion +0.55% Global Short-term (≤2 yr)
4K/Mini-LED panel price erosion +0.45% Asia-Pacific, Europe Short-term
FAST channel & ad-supported streaming growth +0.40% North America, Europe Medium-term (2–4 yr)
Cloud-gaming platform partnerships +0.30% North America, Asia-Pacific Medium-term
PLI & domestic manufacturing incentives +0.25% India, Southeast Asia Medium-term
Mobile-money & instalment financing +0.20% Middle East & Africa Long-term (≥4 yr)
8K broadcast infrastructure deployment +0.15% Japan, South Korea Long-term


Broadband Infrastructure Buildout

Government-backed initiatives are rapidly expanding high-speed connectivity. The International Telecommunication Union (ITU) reports that by the end of 2024, approximately 73 percent of the global population was using the internet. As nations push toward universal gigabit targets, such as the European Union’s Digital Decade, improved bandwidth availability increasingly enables households to adopt high-performance, content-ready smart television hardware.


Panel Price Compression in 4K and Mini-LED

Manufacturing scale and supply chain adjustments have fundamentally altered consumer accessibility. While market volatility exists, industry data indicate that competitive production capacities for large-format displays have maintained consistent downward pressure on unit costs. This affordability shift has broadened the addressable consumer base, enabling more households to transition from standard sets to advanced 4K and Mini-LED display technologies.


FAST Channel and Streaming Ad Revenue

The rapid rise of Free Ad-Supported Streaming Television (FAST) has transformed television monetization. International telecommunications reports highlight that digital video consumption continues to displace traditional broadcast models, with advertising spend shifting heavily toward connected platforms. This revenue model allows manufacturers to sustain hardware distribution through pre-installed software ecosystems, effectively subsidizing set prices while capturing long-term lifecycle value.


Cloud-Gaming Ecosystem Expansion

Hardware specifications are evolving to meet the demands of integrated cloud-gaming services. With OEMs incorporating high-refresh-rate panels and specialized gaming hubs into standard models, the television is now positioned as a primary entertainment console. This integration aligns with broader digital consumption trends, incentivizing hardware upgrades among demographics that prioritize console-free gaming experiences delivered directly through cloud-based streaming infrastructure.


Restraints Impact Analysis

Restraint ~% Impact on CAGR Geographic Relevance Impact Timeline
Content piracy & signal theft −0.30% Global (acute in Asia, LATAM) Persistent
Fragmented OS ecosystems −0.25% Global Medium-term (2–4 yr)
Streaming dongle cannibalisation −0.20% North America, Europe Short-term (≤2 yr)
Rising e-waste regulation & compliance costs −0.15% Europe, Japan Long-term (≥4 yr)
Macroeconomic & currency headwinds −0.10% Emerging markets Short-term


Content Piracy and Signal Theft

Online piracy undermines legitimate digital service revenues across emerging markets. Studies estimate that global content piracy results in annual losses between USD 40 billion and USD 97.1 billion, severely impacting media licensing revenues. This pervasive theft of intellectual property weakens the economic foundations of media licensing, directly reducing the investment capacity of creators to support hardware-linked partnerships.


Fragmented Operating System Landscape

The smart television market faces persistent technical fragmentation as manufacturers deploy proprietary operating systems. Each platform requires unique development pipelines, creating significant friction for app distributors seeking a broad reach. Analysis suggests this complexity complicates the ecosystem, as diverse data policies and fragmented ad-tech supply chains prevent the seamless integration required to achieve full-scale, unified programmatic advertising revenue models.


Streaming Dongle Substitution

Low-cost streaming devices are extending the lifecycles of legacy hardware, as consumers opt for external upgrades rather than replacing entire television units. The United Nations' Global E-waste Monitor indicates that rapid consumption patterns and shorter product lifecycles contribute to a global generation of 62 million tonnes of e-waste annually, emphasizing the impact of hardware turnover.


Smart TV Market Opportunities

Premium Large-Format Panel Upcycle

Consumer preference is migrating toward larger screens, with the segment featuring displays over 52 inches projected to hold the largest market share by 2030. Advanced OLED and Mini-LED technologies allow manufacturers to deliver superior visual quality. This transition to high-resolution, large-format hardware sustains value as consumers increasingly prioritize immersive, cinema-like experiences in their homes


Emerging-Market Volume Expansion

Untapped growth persists in emerging economies where digital infrastructure is rapidly expanding. By early 2026, over 6 billion people globally were using the internet. Government-led digital initiatives, such as those in India, where broadband subscribers surpassed 1 billion, are bridging the connectivity gap, providing a foundation for increased adoption of smart television hardware.


Data Monetisation and Advertising Operating Systems

Connected platforms now sit at the center of digital engagement. The global television advertising market is valued at over USD 260 billion as of 2026. As privacy-safe data frameworks mature, OEMs can utilize viewership insights to develop recurring revenue models, transforming the smart television from a one-time hardware sale into a continuous platform-based relationship.


Commercial and Digital Signage Applications

Beyond residential use, connected panels are penetrating commercial sectors. The global digital signage market is projected to reach USD 28.88 billion by 2030. Smart televisions equipped with content management systems offer a cost-effective, turnkey alternative to proprietary signage, meeting the rising demand for interactive, high-resolution information displays in public infrastructure, retail, and hospitality environments.


Smart TV Market Future Outlook

AI-Powered Viewing Experiences

On-device neural processing units (NPUs) will move beyond basic upscaling to enable real-time scene-adaptive picture tuning, conversational voice interfaces, and proactive content recommendations that anticipate viewer preferences. By 2030, an estimated 80% of smart televisions shipped will integrate dedicated AI silicon [10], making computational capability a core differentiator in the Smart TV Market rather than an ancillary feature.

Platform Economics and Recurring Revenue

The hardware-margin compression that defined the 2020s will accelerate a shift toward platform-based business models. OEMs will derive an increasing share of lifetime value from advertising, data licensing, app-store commissions, and cloud-gaming subscriptions. Samsung's Tizen and Google's Android TV are already generating post-sale ARPU exceeding USD 15 per connected device annually in North America [4]. This figure is expected to double by 2032 as programmatic advertising matures across the Smart TV Market.

Sustainability and Circular-Economy Mandates

The EU's revised WEEE Directive and proposed Digital Product Passport will impose lifecycle transparency requirements on television manufacturers by 2028 [12]. Brands that invest in modular designs, recycled-content enclosures, and extended software-support commitments will gain regulatory advantage and consumer goodwill. ENERGY STAR estimates that the most efficient smart television models consume much less power than their 2019 equivalents [20], a trajectory that will shape competitive positioning across the Smart TV Market through 2035.

Convergence of Residential and Commercial Use Cases

The boundary between consumer and commercial displays is blurring. Smart televisions equipped with built-in digital signage software, room-occupancy sensors, and HDMI-CEC management suites are entering hotel rooms, co-working spaces, and retail environments at price points well below dedicated commercial panels. This dual-use potential expands the total addressable Smart TV Market and opens distribution partnerships with hospitality and facilities-management channels that OEMs have historically underserved [19].


Smart TV Market Segmentation

By Resolution

Segment Metric Primary Demand Driver
HD / Full HD USD 38.20 Billion (2025) Budget tier, secondary-room sets
4K UHD ~61.2% share (2025) Price parity with legacy FHD at 55"
8K UHD 4.90% CAGR (2026–2035) Broadcast standards, premium early adopters


The 4K UHD segment forms the backbone of the Smart TV Market, driven by Gen-10.5 fab economics that have collapsed price premiums over Full HD to single-digit percentages at the 55-inch tier. Premium buyers continue to migrate toward 8K panels as Japan's NHK and South Korea's KBS expand native 8K programming, although content availability remains the primary bottleneck restraining faster adoption [9].

By Screen Size

Segment Metric Primary Demand Driver
Up to 32 inches USD 18.90 Billion (2025) Kitchen/bedroom secondary sets
33–45 Inch 2.50% CAGR Compact-living markets in Asia
46–55 Inch ~39.4% share (2025) Sweet spot for mainstream living rooms
Above 55 Inch 3.12% CAGR (2026–2035) Home-cinema upgrades, immersive gaming


The 46–55 inch bracket retains its position as the volume leader in the Smart TV Market because it balances viewing immersion with room-size practicality across most global housing stocks. Screens above 65 inches are the fastest-growing sub-segment, supported by declining Mini-LED and OLED panel costs that bring large-format experiences within reach of mid-tier budgets.

By Panel / Display Technology

Segment Metric Primary Demand Driver
LED / LCD ~86.5% share (2025) Cost leadership, supply abundance
OLED USD 22.80 Billion (2025) Contrast, gaming, and premium positioning
QLED 2.75% CAGR Brightness advantage for well-lit rooms
Mini-LED 3.45% CAGR (2026–2035) OLED-adjacent performance at lower cost
Other USD 3.10 Billion (2025) MicroLED, Laser TV niche segments


LED/LCD dominates the Smart TV Market on sheer volume economics. However, Mini-LED is the technology to watch: it delivers local-dimming zone counts exceeding 2,000 in flagship models, closing the HDR performance gap with OLED while maintaining a 30–40% price advantage [11]. OLED remains the benchmark for premium image quality, and LG Display's shift to horizontal evaporation printing is expected to improve yields and broaden price accessibility by 2029.

By Operating System

Segment Metric Primary Demand Driver
Android TV (Google TV) ~45.8% share (2025) Open ecosystem, broad app availability
Other / OEM Proprietary 5.28% CAGR (2026–2035) Samsung Tizen, LG webOS, Roku OS differentiation


Android TV's dominance in the Smart TV Market reflects its low licensing barrier and deep integration with Google's content and advertising ecosystem. Proprietary platforms, however, are growing faster because Samsung and LG leverage their OS control to capture post-sale advertising revenue and deliver differentiated UX features such as gaming hubs and ambient-mode interfaces [17].

By Distribution Channel

Segment Metric Primary Demand Driver
Offline Retail ~63.0% share (2025) In-store demo, impulse upgrade purchases
Online 3.82% CAGR (2026–2035) D2C growth, Prime Day / sale-event concentration


By Screen Shape

Segment Metric Primary Demand Driver
Flat ~94.2% share (2025) Universal room compatibility, wall mounting
Curved 2.15% CAGR Niche gaming and immersive cinema enthusiasts


Regional Market Share Analysis

Region Metric Primary Investment Themes
Asia-Pacific ~50.6% share (2025) Panel manufacturing, PLI programmes, 5G-FWA connectivity
North America ~22.5% share (2025) FAST channels, premium panel upgrades, cloud gaming
Europe ~18.2% share (2025) Sustainability regulation, OLED adoption, DVB-I rollout
South America ~4.8% share (2025) E-commerce penetration, local assembly incentives
Middle East & Africa 3.37% CAGR (2026–2035) Mobile-money financing, satellite broadband, urbanisation
Total USD 247.52 Billion (2025)

The Smart TV Market exhibits a concentrated regional structure, with Asia-Pacific generating over half of global revenue and North America and Europe collectively accounting for roughly 40%. Growth momentum is shifting toward developing regions where broadband penetration and discretionary spending are rising simultaneously.


North America

Country Metric Key Driver
United States ~78% of regional revenue FAST/AVOD ecosystem dominance
Canada 2.65% CAGR CRTC broadband mandates
Mexico USD 5.10 Billion (2025) Nearshoring assembly growth


The U.S. drives the North American Smart TV Market through a mature streaming infrastructure and high household penetration above 85%. Canada's CRTC universal broadband fund and Mexico's expanding Foxconn and Samsung assembly corridors contribute complementary growth vectors, ensuring the region maintains its position as the second-largest revenue pool globally [14] [15].

Europe

Country Metric Key Driver
Germany ~22% of regional share Energy-label regulation, premium OLED demand
United Kingdom 2.78% CAGR Freeview Play, ad-funded streaming
France USD 6.85 Billion (2025) Canal+ bundling, DTT migration
Italy ~11% of regional share DVB-T2 switchover stimulus
Spain 2.90% CAGR Tourism-driven hospitality demand
Nordic Countries USD 4.20 Billion (2025) High broadband penetration
Russia ~7% of regional share Local brands filling Western exit gap
Rest of Europe 2.55% CAGR EU digital single-market initiatives


Europe's Smart TV Market is shaped by the EU Ecodesign Regulation, which mandates minimum energy-efficiency thresholds and repairability indices for televisions sold in the bloc [12]. Germany and the UK anchor regional demand, while Italy's 2024 DVB-T2 switchover created a one-time replacement surge that lifted the broader Southern European sub-segment.

Asia-Pacific

Country Metric Key Driver
China ~48% of regional share BOE/CSOT fab output, Huawei HarmonyOS TVs
India 3.25% CAGR PLI scheme, Jio broadband roll-out
Japan USD 12.40 Billion (2025) 8K NHK broadcasts, high OLED adoption
South Korea ~14% of regional share Samsung/LG home-market dominance
ASEAN 3.10% CAGR Rising middle class, e-commerce logistics
Rest of Asia-Pacific USD 8.70 Billion (2025) Government digitalisation initiatives


Asia-Pacific's leadership in the Smart TV Market stems from vertical integration across the panel value chain—from glass substrates to finished modules—concentrated in China and South Korea. India's PLI programme has attracted commitments exceeding USD 2.4 billion, incentivising Samsung, LG, and Dixon Technologies to localise assembly, while Japan's NHK-led 8K broadcasting standard supports a premium replacement cycle [2] [9].

South America

Country Metric Key Driver
Brazil ~62% of regional share Manaus free-trade zone assembly
Argentina 2.40% CAGR Currency stabilisation, pent-up demand
Rest of South America USD 2.15 Billion (2025) Cross-border e-commerce growth


Brazil's Manaus industrial zone remains the production hub for the South American Smart TV Market, offering tax incentives that reduce landed costs by up to 25% [18]. Argentine demand has been volatile due to currency controls, but recent stabilisation measures are expected to release pent-up consumer spending through the mid-forecast period.

Middle East & Africa

Country Metric Key Driver
Saudi Arabia ~28% of regional share Vision 2030 smart-city projects
UAE USD 1.95 Billion (2025) Tourism, hospitality panel demand
South Africa 3.05% CAGR DStv/Showmax streaming ecosystem
Egypt ~12% of regional share Population scale, local assembly
Rest of MEA 3.50% CAGR Mobile-money instalment financing


The Middle East & Africa region is the fastest-growing segment of the Smart TV Market, fueled by a convergence of urbanisation, satellite-broadband expansion (Starlink, OneWeb), and innovative financing mechanisms that bypass traditional credit infrastructure [5]. Saudi Arabia's Vision 2030 programme is driving bulk procurement for smart-city residential developments and hospitality projects, while sub-Saharan Africa represents the steepest volume growth curve globally.


Smart TV Market By Region, 2025-2035

Competitive Benchmarking

The Smart TV Market displays medium concentration, with an estimated top-five revenue share of approximately 55–60% and an HHI below 1,200, indicating a moderately competitive environment. Samsung Electronics and LG Electronics lead on brand equity and panel-technology ownership, while Chinese manufacturers—TCL, Hisense, and Xiaomi—compete aggressively on price-to-performance ratio, compressing margins across the mid-tier.

Company Est. Revenue Share Range Key Offerings for Smart TV Market Strategic Positioning
Samsung Electronics ~18–22% Neo QLED, Micro LED, Tizen OS gaming hub Premium + mid-tier breadth; first-party ad platform
LG Electronics ~12–15% OLED evo, QNED, webOS smart ecosystem OLED technology leadership; content partnerships
Sony Corporation ~7–10% BRAVIA XR, cognitive processor, PS5 integration Premium A/V positioning; gaming cross-sell
TCL Technology ~8–11% Mini-LED CSOT panels, Google TV, Roku TV Vertical integration; aggressive price disruption
Hisense Group ~6–9% ULED X, Vidda sub-brand, FIFA sponsorship Value champion; sports-marketing visibility
Xiaomi (Redmi TV) ~5–7% Xiaomi TV Max, PatchWall UI, AIoT integration Ecosystem plays; ultra-competitive pricing
Vizio (Walmart subsidiary) ~3–5% SmartCast, WatchFree+ FAST platform Ad-revenue-first hardware model
Panasonic Holdings ~2–4% MZ-series OLED, Fire OS integration Premium imaging heritage; select-market focus
Philips (TP Vision) ~2–4% Ambilight, Android TV, P5 picture engine Differentiated UX (Ambilight); European foothold
Skyworth Group ~2–3% Coocaa OS, value 4K range, ODM services Emerging-market volume; white-label manufacturing


Recent News & Developments


  • Samsung and Glance(June 23, 2026)—Launched a partnership to integrate AI-assisted, agentic e-commerce capabilities directly into Samsung smart TVs' Tizen operating system.
  • Walmart and Vibe.co(2026)—Following its 2024 Vizio acquisition, Walmart acquired streaming advertising technology company Vibe.co to strengthen its retail media and TV advertising capabilities.
  • Samsung and Amazon(July 2026)—Expanded their partnership to integrate Amazon’s interactive video ad technology into Samsung TV Plus, enabling direct-to-purchase functionality via remote.


Smart TV Market Report Scope

Item Detail
Market Scope Global Smart TV Market covering hardware sales across residential, commercial, and hospitality end uses
Study Period 2021–2035
CAGR (Forecast Window) 2.84% (2026–2035)
Base Year Market Size USD 247.52 Billion (2025)
Forecast Endpoint USD 327.48 Billion (2035)
Fastest Growing Segments Mini-LED (by panel technology); 8K UHD (by resolution); Middle East & Africa (by region)
Companies Profiled Samsung, LG, Sony, TCL, Hisense, Xiaomi, Vizio, Panasonic, Philips (TP Vision), Skyworth
Valuation Currency USD Billion


FAQs

How does Wi-Fi 6E improve the smart television viewing experience compared with Wi-Fi 5?
Wi-Fi 6E operates on the uncongested 6 GHz band, delivering roughly 2× the throughput and 50% lower latency than Wi-Fi 5 [8]. This eliminates buffering on 4K HDR streams and supports lag-free cloud gaming at 120 Hz.
What total cost of ownership factors should buyers weigh beyond the sticker price?
Annual electricity consumption, subscription-app costs, and average panel lifespan (7–9 years) collectively add 30–40% to the purchase price over a television's lifetime [20]. Buyers should also factor in potential repair costs and software support longevity from the OS provider.
How are OEMs addressing cybersecurity risks in connected televisions?
Leading brands now ship quarterly firmware patches, support WPA3 encryption, and isolate smart-TV apps in sandboxed runtime environments [17]. Buyers should verify that the manufacturer commits to a minimum software-support window of four years.
What distinguishes Mini-LED backlighting from conventional direct-lit LED in real-world performance?
Mini-LED uses thousands of smaller diodes to create hundreds or thousands of local-dimming zones, dramatically improving contrast and HDR peak brightness over conventional direct-lit panels [7]. The result is near-OLED black levels without the burn-in risk.
How do tariff and trade-policy shifts affect smart television pricing for end consumers?
U.S. Section 301 tariffs added 7.5–25% duties on Chinese-assembled television components, prompting brands to diversify assembly into Vietnam, India, and Mexico [18]. These shifts can delay price erosion by 6–12 months in affected categories.
What energy-efficiency certifications should institutional buyers prioritise?
ENERGY STAR 9.0 and the EU Energy Label (classes A–G) are the two most widely recognised benchmarks for television power consumption [20]. Institutional buyers should prioritise models rated ENERGY STAR Most Efficient for lifecycle cost savings.
How are smart televisions being adapted for commercial hospitality environments?
Hospitality-grade firmware locks channel selections, turns off consumer app stores, and integrates with property-management systems for guest-check-in messaging [19]. Brands such as Samsung and LG offer dedicated hospitality SKUs with centralised remote management.    
Author
Author
Author Profile
Kiran Jinkalwad LinkedIn
Research Associate Level - II
Kiran Jinkalwad brings over four years of experience in market research, specializing in the ICT and Semiconductor sectors. She has worked on 50+ projects, including custom studies for companies like Microsoft and Huawei, addressing complex business challenges. With a background in Electronics and Telecommunication, Kiran excels in market estimation, forecasting, and strategic analysis. His sharp analytical skills and industry knowledge consistently deliver actionable insights for diverse clients.
Co-Author
Co-Author Profile
Aarti Dhapte LinkedIn
AVP - Research
A consulting professional focused on helping businesses navigate complex markets through structured research and strategic insights. I partner with clients to solve high-impact business problems across market entry strategy, competitive intelligence, and opportunity assessment. Over the course of my experience, I have led and contributed to 100+ market research and consulting engagements, delivering insights across multiple industries and geographies, and supporting strategic decisions linked to $500M+ market opportunities. My core expertise lies in building robust market sizing, forecasting, and commercial models (top-down and bottom-up), alongside deep-dive competitive and industry analysis. I have played a key role in shaping go-to-market strategies, investment cases, and growth roadmaps, enabling clients to make confident, data-backed decisions in dynamic markets.

Research Approach


Secondary Research

The secondary research process involved comprehensive analysis of regulatory databases, industry standards publications, semiconductor and display technology journals, and authoritative consumer technology organizations. Key sources included the US Federal Communications Commission (FCC), European Telecommunications Standards Institute (ETSI), International Telecommunication Union (ITU-R and ITU-T standards), National Institute of Standards and Technology (NIST), Ministry of Internal Affairs and Communications (MIC) Japan, National Radio and Television Administration (NRTA) China, Bureau of Indian Standards (BIS), Consumer Technology Association (CTA), Society of Motion Picture and Television Engineers (SMPTE), Institute of Electrical and Electronics Engineers (IEEE), International Data Corporation (IDC), NPD Group/Circana, GfK (NIQ), Display Supply Chain Consultants (DSCC), Omdia, Motion Picture Association (MPA), company annual reports from major OEMs (Samsung Electronics, LG Electronics, Sony Corporation, TCL Electronics), and streaming platform deployment statistics from Netflix, Amazon Prime Video, and Disney+.

Shipment data, regulatory certification information, display technology roadmaps, broadband penetration patterns, over-the-top (OTT) adoption rates, and competitive landscape analyses for 4K UHD, Full HD, 8K, and upcoming display technologies were all gathered from these sources.


Primary Research

To gather both qualitative and quantitative insights, supply-side and demand-side stakeholders were interviewed during the primary research process. CEOs, vice presidents of product strategy, heads of sourcing for display panels, chief technology officers, and ecosystem partnership leads from manufacturers of display panels (Samsung Display, LG Display, BOE, CSOT, AUO), OS platform providers (Google Android TV, Samsung Tizen, LG WebOS, Roku Inc.), and Smart TV OEMs were among the supply-side sources. Demand-side sources included technology strategists from broadcast television networks, procurement directors from OTT streaming services and content delivery network (CDN) providers, and category managers from large retailers (Best Buy, Walmart, Amazon, and MediaMarkt Saturn). In addition to verifying product refresh cycles and panel supply agreements, primary research validated market segmentation across resolution tiers and operating systems. It also collected information on consumer upgrade trends, pricing elasticity by screen size, and the dynamics of advertising revenue sharing between TV manufacturers and streaming platforms.

Primary Respondent Breakdown:

• By Designation: C-level Primaries (32%), Director Level (30%), Others (38%)

• By Region: North America (30%), Europe (32%), Asia-Pacific (28%), Rest of World (10%)


Market Size Estimation

Unit shipment mapping and average selling price (ASP) analysis across resolution and operating system sectors were used to determine the global market valuation. The following were part of the methodology:

Over fifty major manufacturers from North America, Europe, Asia-Pacific, and Latin America were identified. These included Tier 1 brands (Samsung, LG, and Sony), Tier 2 manufacturers (TCL, Hisense, and Vizio), and Tier 3 regional companies.

• Product mapping spanning screen size brackets from less than 32 inches to more than 65 inches; Android TV, Tizen, WebOS, Roku, and proprietary operating system platforms; and 4K UHD TV, Full HD TV, 8K TV, and HDTV resolution categories

• Examining reported and projected quarterly shipping volumes and blended ASPs for Smart TV portfolios, taking into account variations in seasonal demand and the effects of promotional calendars

• Manufacturers that will account for 75–80% of the global market in 2024 are covered, with special attention paid to panel allocation tactics from top display providers (Samsung Display, LG Display, BOE Technology).

• To obtain segment-specific values and platform-level ecosystem revenue estimations, extrapolation is done using top-down (manufacturer revenue validation against OTT platform activation data) and bottom-up (unit shipments × regional ASP by resolution and OS type) methodologies.

Download Free Sample

Kindly complete the form below to receive a free sample of this Report

Download PDF ×

We do not share your information with anyone. However, we may send you emails based on your report interest from time to time. You may contact us at any time to opt-out.

















