Segmentation Quick Reference
| Dimension | Sub-Segments | Dominant Segment (2025) | Fastest Growing Segment (2026–2035) |
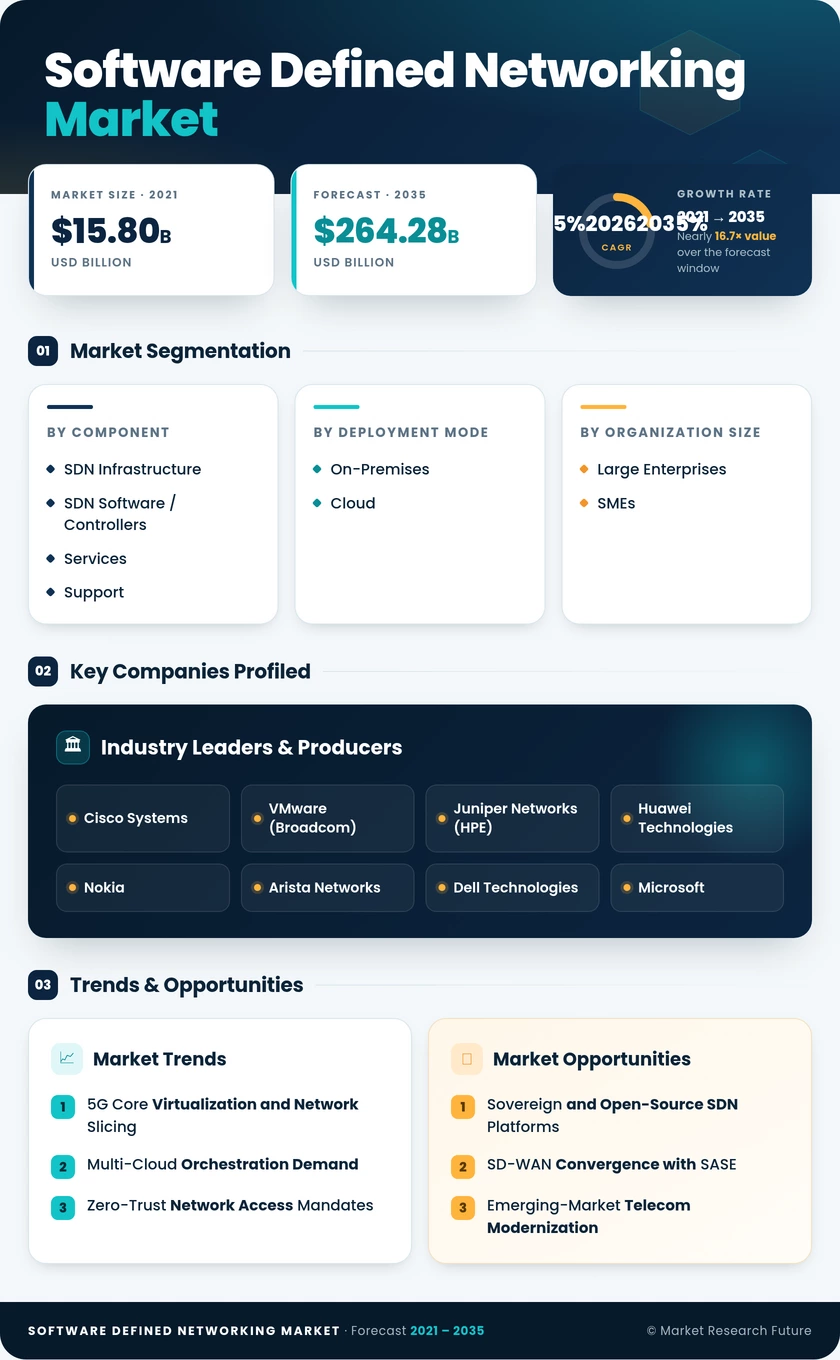
| Component | SDN Infrastructure; SDN Software / Controllers; Services and Support | SDN Infrastructure | Services and Support |
| Deployment Mode | On-Premises; Cloud | On-Premises | Cloud |
| Organization Size | Large Enterprises; SMEs | Large Enterprises | SMEs |
| Application | Data Center and Cloud; Enterprise Campus; SD-WAN | Data Center and Cloud | SD-WAN |
| End User | Telecom & Cloud SPs; BFSI; Manufacturing; Government; Software Defined Networking Market | Telecom & Cloud SPs | Manufacturing |
Market Segmentation Overview
By Component
| Sub-Segment | Key Trend |
| SDN Infrastructure | White-box merchant silicon switches are displacing proprietary chassis |
| SDN Software / Controllers | Intent-based orchestration platforms integrating AI-driven analytics |
| Services and Support | Managed SDN services are gaining traction among mid-market enterprises. |
SDN Infrastructure remains the revenue anchor due to the capital-intensive nature of physical network build-outs. At the same time, SDN Software and Controllers capture higher margins as enterprises invest in automation-layer licensing. Services and support are scaling as organizations seek expert-managed deployment and 24/7 monitoring.
By Deployment Mode
| Sub-Segment | Key Trend |
| On-Premises | Preferred by regulated industries for data-sovereignty compliance |
| Cloud | Multi-cloud SDN-as-a-Service adoption is accelerating among distributed enterprises. |
On-premises installations continue to dominate in verticals where latency sensitivity and regulatory restrictions prevent off-site control-plane hosting. In contrast, cloud-managed SDN is the default choice for born-in-the-cloud enterprises expanding across multiple public-cloud providers.
By Organization Size
| Sub-Segment | Key Trend |
| Large Enterprises | Complex multi-site deployments requiring bespoke SDN fabric engineering |
| SMEs | Subscription-based NaaS models are removing capex barriers to adoption. |
Large enterprises drive the majority of current revenue through complex data-center and campus-fabric initiatives. At the same time, SMEs represent the high-growth frontier as vendor pricing evolves toward usage-based billing.
By Application
| Sub-Segment | Key Trend |
| Data Center and Cloud | AI/ML workload clustering requiring lossless, programmable Ethernet fabrics |
| Enterprise Campus | Wi-Fi 6E/7 integration with campus-fabric SDN controllers |
| SD-WAN | SASE convergence merging WAN optimization with cloud-delivered security |
Data-center and cloud applications remain the largest segment, propelled by hyperscaler traffic growth. SD-WAN leads growth momentum as the SASE architecture becomes the preferred enterprise WAN model.
By End User
| Sub-Segment | Key Trend |
| Telecom and Cloud Service Providers | 5G SA core network slicing demanding programmable control planes |
| BFSI | Microsegmentation for PCI-DSS and regulatory compliance |
| Manufacturing | OT/IT convergence via campus-fabric SDN in smart factories |
| Government | Zero-trust architecture mandates driving SDN procurement. |
| Software Defined Networking Market | HIPAA-compliant network segmentation and IoMT device management |
Telecom operators remain the largest buyer category, while manufacturing is the fastest-growing vertical as Industry 4.0 adoption spreads SDN into factory-floor environments that previously relied on proprietary industrial Ethernet.