Request Free Sample ×

Kindly complete the form below to receive a free sample of this Report

* Please use a valid business email

Leading companies partner with us for data-driven Insights

clients tt-cursor
Hero Background

South America Online Sports Betting Market

ID: MRFR/ICT/59277-HCR
200 Pages
Aarti Dhapte
Last Updated: February 06, 2026
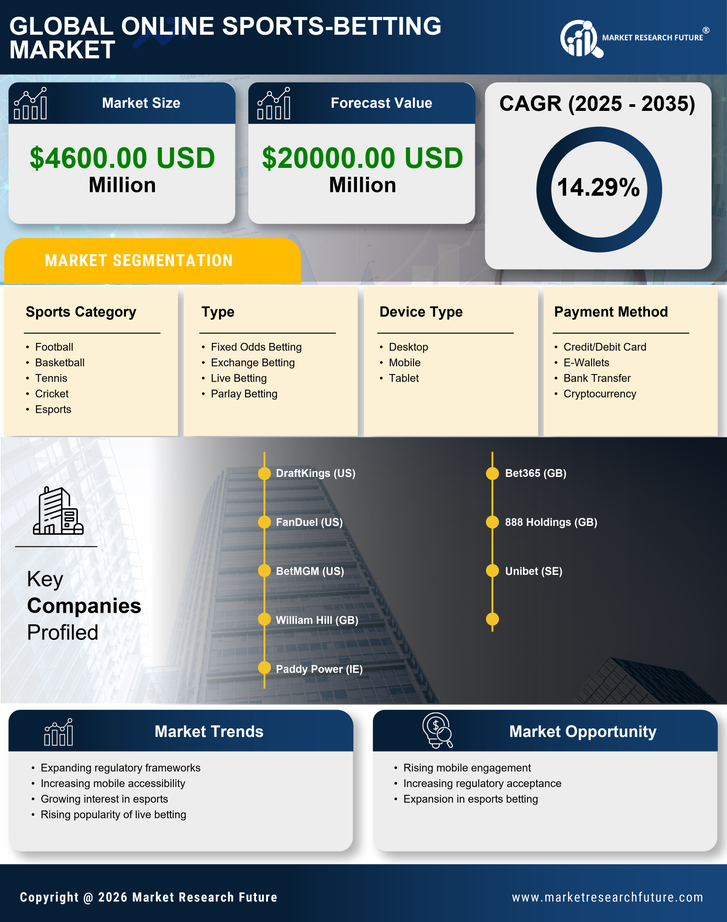
South America Online Sports Betting Market Size, Share and Research Report: By Sports Type (Football, Horse Racing/ Riding, Car Racing, Cricket, Hockey, Boxing, Baseball, Basketball, Tennis), By Type (Line-in-Play, Fixed Odds Betting, Exchange Betting, Daily Fantasy, Spread Betting, E-Sports, Others), By Application (Web-Based, Mobile-Based), By Web-Based (Windows, Mac), By Mobile-Based (iOS, Android) and By Regional (Brazil, Mexico, Argentina, Rest of South America)- Industry Forecast to 2035
Download PDF ×

We do not share your information with anyone. However, we may send you emails based on your report interest from time to time. You may contact us at any time to opt-out.

  1. 1 SECTION I: EXECUTIVE SUMMARY AND KEY HIGHLIGHTS
    1. 1.1 EXECUTIVE SUMMARY
      1. 1.1.1 Market Overview
      2. 1.1.2 Key Findings
      3. 1.1.3 Market Segmentation
      4. 1.1.4 Competitive Landscape
      5. 1.1.5 Challenges and Opportunities
      6. 1.1.6 Future Outlook
  2. 2 SECTION II: SCOPING, METHODOLOGY AND MARKET STRUCTURE
    1. 2.1 MARKET INTRODUCTION
      1. 2.1.1 Definition
      2. 2.1.2 Scope of the study
        1. 2.1.2.1 Research Objective
        2. 2.1.2.2 Assumption
        3. 2.1.2.3 Limitations
    2. 2.2 RESEARCH METHODOLOGY
      1. 2.2.1 Overview
      2. 2.2.2 Data Mining
      3. 2.2.3 Secondary Research
      4. 2.2.4 Primary Research
        1. 2.2.4.1 Primary Interviews and Information Gathering Process
        2. 2.2.4.2 Breakdown of Primary Respondents
      5. 2.2.5 Forecasting Model
      6. 2.2.6 Market Size Estimation
        1. 2.2.6.1 Bottom-Up Approach
        2. 2.2.6.2 Top-Down Approach
      7. 2.2.7 Data Triangulation
      8. 2.2.8 Validation
  3. 3 SECTION III: QUALITATIVE ANALYSIS
    1. 3.1 MARKET DYNAMICS
      1. 3.1.1 Overview
      2. 3.1.2 Drivers
      3. 3.1.3 Restraints
      4. 3.1.4 Opportunities
    2. 3.2 MARKET FACTOR ANALYSIS
      1. 3.2.1 Value chain Analysis
      2. 3.2.2 Porter's Five Forces Analysis
        1. 3.2.2.1 Bargaining Power of Suppliers
        2. 3.2.2.2 Bargaining Power of Buyers
        3. 3.2.2.3 Threat of New Entrants
        4. 3.2.2.4 Threat of Substitutes
        5. 3.2.2.5 Intensity of Rivalry
      3. 3.2.3 COVID-19 Impact Analysis
        1. 3.2.3.1 Market Impact Analysis
        2. 3.2.3.2 Regional Impact
        3. 3.2.3.3 Opportunity and Threat Analysis
  4. 4 SECTION IV: QUANTITATIVE ANALYSIS
    1. 4.1 Information and Communications Technology, BY Type (USD Million)
      1. 4.1.1 Fixed Odds Betting
      2. 4.1.2 Exchange Betting
      3. 4.1.3 Live Betting
      4. 4.1.4 Parlay Betting
    2. 4.2 Information and Communications Technology, BY Device Type (USD Million)
      1. 4.2.1 Desktop
      2. 4.2.2 Mobile
      3. 4.2.3 Tablet
    3. 4.3 Information and Communications Technology, BY Sports Category (USD Million)
      1. 4.3.1 Football
      2. 4.3.2 Basketball
      3. 4.3.3 Tennis
      4. 4.3.4 Cricket
      5. 4.3.5 Esports
    4. 4.4 Information and Communications Technology, BY Payment Method (USD Million)
      1. 4.4.1 Credit/Debit Card
      2. 4.4.2 E-Wallets
      3. 4.4.3 Bank Transfer
      4. 4.4.4 Cryptocurrency
  5. 5 SECTION V: COMPETITIVE ANALYSIS
    1. 5.1 Competitive Landscape
      1. 5.1.1 Overview
      2. 5.1.2 Competitive Analysis
      3. 5.1.3 Market share Analysis
      4. 5.1.4 Major Growth Strategy in the Information and Communications Technology
      5. 5.1.5 Competitive Benchmarking
      6. 5.1.6 Leading Players in Terms of Number of Developments in the Information and Communications Technology
      7. 5.1.7 Key developments and growth strategies
        1. 5.1.7.1 New Product Launch/Service Deployment
        2. 5.1.7.2 Merger & Acquisitions
        3. 5.1.7.3 Joint Ventures
      8. 5.1.8 Major Players Financial Matrix
        1. 5.1.8.1 Sales and Operating Income
        2. 5.1.8.2 Major Players R&D Expenditure. 2023
    2. 5.2 Company Profiles
      1. 5.2.1 DraftKings (US)
        1. 5.2.1.1 Financial Overview
        2. 5.2.1.2 Products Offered
        3. 5.2.1.3 Key Developments
        4. 5.2.1.4 SWOT Analysis
        5. 5.2.1.5 Key Strategies
      2. 5.2.2 FanDuel (US)
        1. 5.2.2.1 Financial Overview
        2. 5.2.2.2 Products Offered
        3. 5.2.2.3 Key Developments
        4. 5.2.2.4 SWOT Analysis
        5. 5.2.2.5 Key Strategies
      3. 5.2.3 BetMGM (US)
        1. 5.2.3.1 Financial Overview
        2. 5.2.3.2 Products Offered
        3. 5.2.3.3 Key Developments
        4. 5.2.3.4 SWOT Analysis
        5. 5.2.3.5 Key Strategies
      4. 5.2.4 William Hill (GB)
        1. 5.2.4.1 Financial Overview
        2. 5.2.4.2 Products Offered
        3. 5.2.4.3 Key Developments
        4. 5.2.4.4 SWOT Analysis
        5. 5.2.4.5 Key Strategies
      5. 5.2.5 Paddy Power (IE)
        1. 5.2.5.1 Financial Overview
        2. 5.2.5.2 Products Offered
        3. 5.2.5.3 Key Developments
        4. 5.2.5.4 SWOT Analysis
        5. 5.2.5.5 Key Strategies
      6. 5.2.6 Bet365 (GB)
        1. 5.2.6.1 Financial Overview
        2. 5.2.6.2 Products Offered
        3. 5.2.6.3 Key Developments
        4. 5.2.6.4 SWOT Analysis
        5. 5.2.6.5 Key Strategies
      7. 5.2.7 888 Holdings (GB)
        1. 5.2.7.1 Financial Overview
        2. 5.2.7.2 Products Offered
        3. 5.2.7.3 Key Developments
        4. 5.2.7.4 SWOT Analysis
        5. 5.2.7.5 Key Strategies
      8. 5.2.8 Unibet (SE)
        1. 5.2.8.1 Financial Overview
        2. 5.2.8.2 Products Offered
        3. 5.2.8.3 Key Developments
        4. 5.2.8.4 SWOT Analysis
        5. 5.2.8.5 Key Strategies
    3. 5.3 Appendix
      1. 5.3.1 References
      2. 5.3.2 Related Reports
  6. 6 LIST OF FIGURES
    1. 6.1 MARKET SYNOPSIS
    2. 6.2 SOUTH AMERICA MARKET ANALYSIS BY TYPE
    3. 6.3 SOUTH AMERICA MARKET ANALYSIS BY DEVICE TYPE
    4. 6.4 SOUTH AMERICA MARKET ANALYSIS BY SPORTS CATEGORY
    5. 6.5 SOUTH AMERICA MARKET ANALYSIS BY PAYMENT METHOD
    6. 6.6 KEY BUYING CRITERIA OF INFORMATION AND COMMUNICATIONS TECHNOLOGY
    7. 6.7 RESEARCH PROCESS OF MRFR
    8. 6.8 DRO ANALYSIS OF INFORMATION AND COMMUNICATIONS TECHNOLOGY
    9. 6.9 DRIVERS IMPACT ANALYSIS: INFORMATION AND COMMUNICATIONS TECHNOLOGY
    10. 6.10 RESTRAINTS IMPACT ANALYSIS: INFORMATION AND COMMUNICATIONS TECHNOLOGY
    11. 6.11 SUPPLY / VALUE CHAIN: INFORMATION AND COMMUNICATIONS TECHNOLOGY
    12. 6.12 INFORMATION AND COMMUNICATIONS TECHNOLOGY, BY TYPE, 2024 (% SHARE)
    13. 6.13 INFORMATION AND COMMUNICATIONS TECHNOLOGY, BY TYPE, 2024 TO 2035 (USD Million)
    14. 6.14 INFORMATION AND COMMUNICATIONS TECHNOLOGY, BY DEVICE TYPE, 2024 (% SHARE)
    15. 6.15 INFORMATION AND COMMUNICATIONS TECHNOLOGY, BY DEVICE TYPE, 2024 TO 2035 (USD Million)
    16. 6.16 INFORMATION AND COMMUNICATIONS TECHNOLOGY, BY SPORTS CATEGORY, 2024 (% SHARE)
    17. 6.17 INFORMATION AND COMMUNICATIONS TECHNOLOGY, BY SPORTS CATEGORY, 2024 TO 2035 (USD Million)
    18. 6.18 INFORMATION AND COMMUNICATIONS TECHNOLOGY, BY PAYMENT METHOD, 2024 (% SHARE)
    19. 6.19 INFORMATION AND COMMUNICATIONS TECHNOLOGY, BY PAYMENT METHOD, 2024 TO 2035 (USD Million)
    20. 6.20 BENCHMARKING OF MAJOR COMPETITORS
  7. 7 LIST OF TABLES
    1. 7.1 LIST OF ASSUMPTIONS
  8. 7.1.1
    1. 7.2 South America MARKET SIZE ESTIMATES; FORECAST
      1. 7.2.1 BY TYPE, 2025-2035 (USD Million)
      2. 7.2.2 BY DEVICE TYPE, 2025-2035 (USD Million)
      3. 7.2.3 BY SPORTS CATEGORY, 2025-2035 (USD Million)
      4. 7.2.4 BY PAYMENT METHOD, 2025-2035 (USD Million)
    2. 7.3 PRODUCT LAUNCH/PRODUCT DEVELOPMENT/APPROVAL
  9. 7.3.1
    1. 7.4 ACQUISITION/PARTNERSHIP
  10. 7.4.1

South America Information and Communications Technology Market Segmentation

Information and Communications Technology By Type (USD Million, 2025-2035)

  • Fixed Odds Betting
  • Exchange Betting
  • Live Betting
  • Parlay Betting

Information and Communications Technology By Device Type (USD Million, 2025-2035)

  • Desktop
  • Mobile
  • Tablet

Information and Communications Technology By Sports Category (USD Million, 2025-2035)

  • Football
  • Basketball
  • Tennis
  • Cricket
  • Esports

Information and Communications Technology By Payment Method (USD Million, 2025-2035)

  • Credit/Debit Card
  • E-Wallets
  • Bank Transfer
  • Cryptocurrency