Transformer Monitoring System Market (2026 - 2035)

Transformer Monitoring System Market Research Report By Component (Software, Hardware), By Monitoring Type (Online Continuous, Offline), By Phase (Single, Three), By Deployment Type (Edge, Cloud/Hybrid, On-Premise Server), By Transformer Type (Power, Distribution, Specialty), By Service (Oil/Dissolved-Gas Analysis, Partial-Discharge, Thermal/Winding Temperature, Bushing and Other Services), By End-User (Power Utilities, Industrial, Transport, Data Centers and Others) and By Regional (North America, Europe, South America, Asia Pacific, Middle East and Africa) - Forecast to 2035
ID: MRFR/EnP/1696-CR
155 Pages
Anshula Mandaokar
Last Updated: August 24, 2026
Transformer Monitoring System Market
Market Size
Forecast Period2026-2035
CAGR (2026-2035)9.75%
2025 Market SizeUSD 3.40 Billion
2035 Market SizeUSD 8.56 Billion
Key Players
Hitachi Energy
ABB
Siemens Energy
GE Vernova
Qualitrol
Doble Engineering
Opportunities
  • Software-Led Attach in Existing Installed Bases
  • Monitoring-as-a-Service in Emerging Grids
  • Data Monetisation Through Fleet Benchmarking

Transformer Monitoring System Market Summary

The Transformer Monitoring System Market reached USD 3.40 Billion in 2025 and enters the forecast window at USD 3.71 Billion in 2026, climbing to USD 8.56 Billion by 2035 at a 9.75% CAGR. Two catalysts anchor that trajectory. Utilities across the OECD are recovering sensor capex through reliability-linked rate mechanisms, while the IEA's estimate that global grid spending must roughly double to USD 600 billion annually by 2030 has moved substation instrumentation from discretionary to planned capital [2]. A single averted forced outage on a 230 kV unit avoids roughly USD 1 million in replacement power and restoration costs, which is why the Transformer Monitoring System Market clears investment committees even in rate-regulated territories [1].

Replacement is the real story underneath the growth curve. Annual laboratory oil sampling and periodic thermographic surveys are giving way to continuous dissolved-gas, hot-spot temperature, bushing capacitance, and partial-discharge sensing streamed into asset performance platforms. Grid digitalization programs — the EU's EUR 584 billion grid action plan chief among them — are funding that swap directly [9]. Software is now outgrowing the sensors it depends on.

Asia-Pacific dominates with 38.5% of 2025 revenue and also grows fastest, at an 11.2% CAGR. North America follows at 25.4%, propelled by FERC Order No. 1920 transmission planning obligations and data-center load growth [13]. Europe sits third at 23.6%, where regulated performance frameworks reward measurable reliability gains. Expect the gap between instrumented and uninstrumented fleets to widen sharply after 2028.


Key Report Takeaways

• By Component

  • Hardware held 64.8% of Transformer Monitoring System Market revenue in 2025, led by multi-gas DGA modules and fibre-optic winding probes
  • Software and analytics platforms are the fastest-expanding component at a 12.7% CAGR through 2035


• By Monitoring

  • Online continuous monitoring contributed USD 2.04 Billion in 2025

• By End User

  • Power utilities account for 60.5% of end-user demand
  • Industrial and heavy-process users are advancing at a 10.4% CAGR


• By Service

  • Partial-discharge services post the highest service-line growth in the Transformer Monitoring System Market at an 11.3% CAGR

• By Region

  • Asia-Pacific leads with 38.5% share
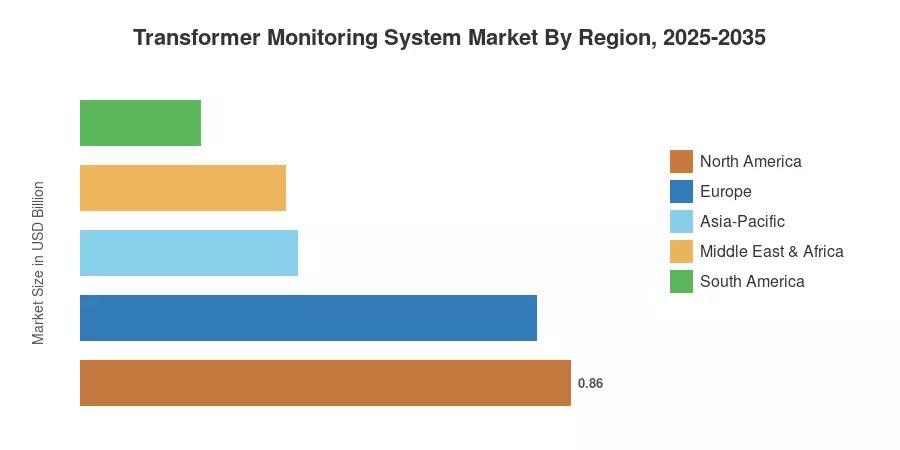
  • North America generated USD 0.86 Billion in 2025
  • Middle East & Africa grows at a 10.6% CAGR


Market Size and Forecast (2021–2035)

Figures below blend utility capital plan disclosures, regulator filings, vendor segment reporting, and a bottom-up install-base model covering roughly 1.9 million transmission-class units. Historical years were reconciled against audited company revenue; forecast years apply regional capex intensity weights to the Transformer Monitoring System Market install base.
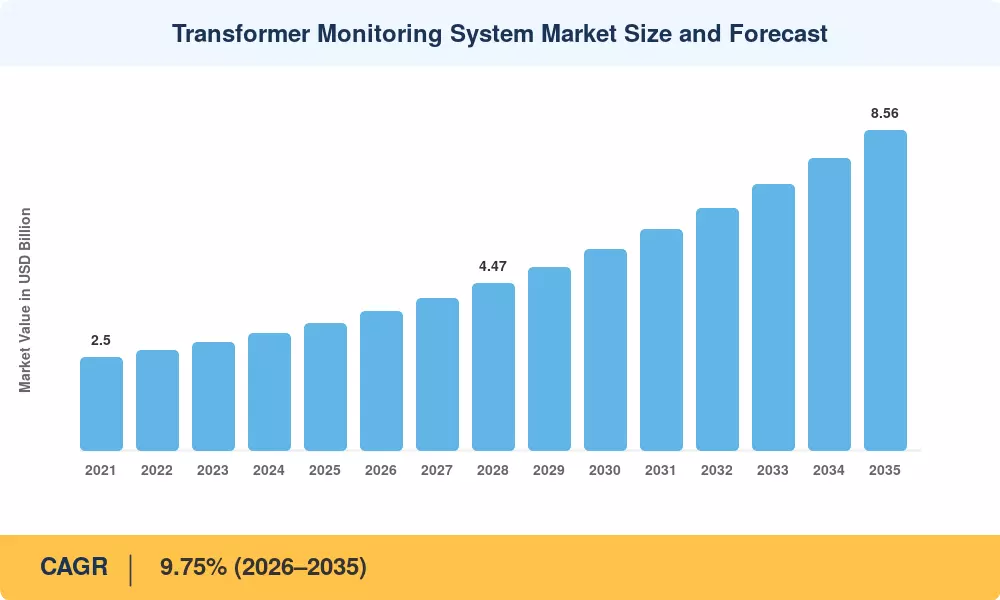
Transformer Monitoring System Market Size and Forecast
Our Impact
Enabled $4.3B Revenue Impact for Fortune 500 and Leading Multinationals
Partnering with 2000+ Global Organizations Each Year
30K+ Citations by Top-Tier Firms in the Industry

Driver Impact Analysis

Driver ~% Impact on CAGR Geographic Relevance Impact Timeline
Grid reliability mandates and rate-base recovery +1.8 Global Medium-term (2–4 yr)
Aging fleets past 40-year design life +1.6 North America, Europe Short-term (≤2 yr)
Renewable interconnection and variable loading stress +1.5 Asia-Pacific, Europe Medium-term (2–4 yr)
Data-center and electrification load growth +1.3 North America, Asia-Pacific Long-term (≥4 yr)
AI-assisted diagnostics in asset platforms +1.2 Global Long-term (≥4 yr)
Falling sensor and edge-gateway unit cost +1.1 Global Short-term (≤2 yr)
Outage penalty and insurance pressure +0.8 Europe, North America Medium-term (2–4 yr)


Reliability Regulation Rewrites the Business Case

Instrumentation was no longer considered overhead by regulators. Network companies that switch from calendar servicing to condition-based maintenance have recorded outage-minute savings of tens of millions of pounds per price control cycle [10]. Ofgem's RIIO-2 framework links transmission operator returns to quantifiable availability. The best justification for the Transformer Monitoring System Market within a controlled capital plan is that mechanism, which turns a sensor acquisition into a revenue-protecting asset.


Fleet Age Is Now a Balance-Sheet Problem

According to CIGRE's global reliability survey, the median age of transmission transformer failures is close to 33 years, with a disproportionate number of failures concentrated in units put into service during the build-out of the 1970s and 1980s [16]. Large power transformer lead times of 80 to 120 weeks are highlighted in the U.S. Department of Energy's transmission needs analysis, indicating that a malfunctioning unit cannot be easily replaced [3]. The planning runway that supply chains no longer offer is purchased by early gas trend identification.


Renewables Make Loading Unpredictable

Variable generation drives thermal cycling that periodic sampling never captures. IRENA recorded 585 GW of renewable capacity added globally in 2024, much of it interconnecting through transformers originally sized for steady industrial load profiles [6]. Continuous winding-temperature and gas trending let operators run assets closer to nameplate without gambling on paper ratings.

Analytics Economics Beat Sensor Economics

Sensor hardware prices have fallen roughly 30% since 2021 as gas-detection chemistry commoditised, while multi-year software subscriptions now carry gross margins above 60% for leading vendors [8]. EPRI's diagnostic guidance has accelerated the shift by standardising how fleet-level gas ratios are interpreted, making cross-vendor benchmarking commercially viable for the first time [5].


Restraints Impact Analysis

Restraint weightings mirror the driver methodology and are directional. They reflect observed procurement delays and deployment attrition rather than a subtractive adjustment to the Transformer Monitoring System Market growth rate.

Restraint ~% Impact on CAGR Geographic Relevance Impact Timeline
Upfront capex versus rate recovery lag −1.4 South America, MEA Short-term (≤2 yr)
Retrofit complexity and outage window scarcity −1.1 Global Medium-term (2–4 yr)
Cybersecurity and OT/IT integration risk −0.9 North America, Europe Medium-term (2–4 yr)
Fragmented interoperability standards −0.7 Global Long-term (≥4 yr)
Diagnostic workforce shortage −0.6 Europe, Asia-Pacific Long-term (≥4 yr)


Capital Rationing in Developing Grids

Monitoring loses raw capacity when tariffs fail to recoup reliability expenditures. Technical and commercial loss reduction regularly outperforms diagnostics in capital queues, according to a World Bank analysis of distribution utilities in lower-middle-income economies [17]. In response, vendors provide monitoring-as-a-service contracts; nonetheless, adoption is still around five years behind the OECD.


Retrofits Are Harder Than Greenfield

Transmission operators closely monitor outage windows during peak seasons, and installing bushing taps or oil-circulating gas analyzers typically necessitates de-energization. Fleet coverage projects are spread over ten years rather than a budget cycle since practical retrofit throughput typically caps at 40 to 60 units per operator annually [16].


Cyber Exposure Slows Cloud Adoption

Substation gateways became regulated assets once NERC CIP scope expanded to low-impact BES cyber systems, adding audit burden that many operators absorb by keeping analytics on-premises [14]. Security review has added roughly six to nine months to typical cloud-connected procurement timelines.


Transformer Monitoring System Market Opportunities

Software-Led Attach in Existing Installed Bases

Thousands of transformers already carry first-generation sensors feeding nothing but a local alarm. Layering modern diagnostics onto that hardware avoids outage windows entirely and represents the highest-margin near-term expansion path in the Transformer Monitoring System Market.

Monitoring-as-a-Service in Emerging Grids

Southeast Asian and African utilities facing capital rationing respond well to per-asset subscription pricing that shifts diagnostics into operating budgets. Egypt and Saudi Arabia have both tendered reliability programs structured this way since 2024 [25].

Data Monetisation Through Fleet Benchmarking

Aggregated, anonymised gas and thermal data across thousands of units supports actuarial-grade failure models. Insurers and reinsurers underwriting transformer risk are already paying for that signal, creating a second revenue line independent of hardware [7].

HVDC and Traction Specialty Assets

Converter and traction transformers carry harmonic and duty-cycle stresses that standard diagnostics misread, and this niche is growing at a 12.8% CAGR — the fastest of any transformer class.

Interoperability as Competitive Positioning

Vendors publishing full IEC 61850 and MQTT interfaces win multi-vendor fleet tenders that closed architectures cannot access [15].


Transformer Monitoring System Market Future Outlook

Autonomous Diagnostics

Machine-learning models trained on multi-year gas and thermal histories are beginning to issue failure-mode classifications rather than threshold alarms. By 2030, expect leading platforms to auto-generate maintenance work orders, with human engineers reviewing exceptions instead of raw trends [5].

Platform Economics Reshape Vendor Margins

Recurring software revenue will approach one-third of total Transformer Monitoring System Market value by 2035, up from roughly 20% today. That mix shift rewards vendors with open data models and punishes those defending proprietary sensor lock-in [15].

The Electrification Supercycle

IEA projections place global electricity demand growth above 3.5% annually through 2030, driven by data centers, heat pumps, and electric vehicles [2]. Every increment loads transformers harder and shortens insulation life, converting diagnostics from prudence into necessity.

Sustainability Disclosure Pulls Data Forward

Extending transformer service life avoids the embodied carbon of replacement — several tonnes of copper, steel, and mineral oil per unit. Utilities reporting under CSRD and comparable frameworks increasingly cite monitored asset-life extension as a quantified Scope 3 avoidance measure [9].


Transformer Monitoring System Market Segmentation

By Component

Segment Metric Primary Demand Driver
Hardware 64.8% share Sensor retrofit programmes
Software 12.7% CAGR Fleet analytics and AI diagnostics


Hardware still captures most spend in the Transformer Monitoring System Market because every deployment starts with physical instrumentation. Software wins the growth argument: once sensors exist, incremental analytics revenue arrives with no outage window and near-zero marginal cost, and renewal rates above 90% compound the base.

By Monitoring Type

Segment Metric Primary Demand Driver
Online Continuous USD 2.04 Billion Transient fault signature capture
Offline / Periodic 40.1% share Distribution-class cost sensitivity


Continuous systems dominate new transmission deployments because incipient faults develop between sampling intervals. Offline testing persists at distribution voltages where per-unit asset value cannot justify permanent instrumentation.

By Phase

Segment Metric Primary Demand Driver
Three-Phase 75.4% share Transmission and industrial substations
Single-Phase 9.1% CAGR North American distribution networks


Due to their extensive use in utility-scale, commercial, and industrial power distribution applications, three-phase transformers held a 75.4% market share.The fastest-growing category is single-phase transformers, which are expected to rise at a 9.1% CAGR due to rising demand from distributed power applications, small businesses, and homes.


By Deployment Type

Segment Metric Primary Demand Driver
Edge 47.7% share Cyber isolation requirements
Cloud / Hybrid 13.5% CAGR Multi-site fleet benchmarking
On-Premise Server USD 0.48 Billion Legacy SCADA integration


Edge architectures lead today largely because security teams prefer them, yet hybrid designs — local inference with cloud aggregation — are absorbing most new tenders. Growth in the Transformer Monitoring System Market increasingly follows whichever architecture satisfies auditors fastest.

By Transformer Type

Segment Metric Primary Demand Driver
Power (>72.5 kV) 55.8% share High replacement cost and lead times
Distribution USD 1.10 Billion Smart meter data convergence
Specialty (HVDC, Traction) 12.8% CAGR Converter station build-out


The Power (>72.5 kV) segment dominated the market, accounting for 55.8% share, supported by extensive deployment in high-voltage transmission networks and grid infrastructure. Meanwhile, the Specialty (HVDC, Traction) segment is the fastest-growing segment, projected to expand at a 12.8% CAGR, driven by increasing HVDC transmission projects, electrification, and demand for specialized transformer applications.


By Service

Segment Metric Primary Demand Driver
Oil / Dissolved-Gas Analysis 35.1% share Established diagnostic standards [23]
Partial-Discharge Monitoring 11.3% CAGR Insulation defect detection
Thermal / Winding Temperature 21.4% share Dynamic rating applications
Bushing and Other Services USD 0.54 Billion Bushing failure share of outages


The Oil / Dissolved-Gas Analysis segment dominated the market, accounting for 35.1% share, driven by its critical role in detecting insulation degradation and identifying developing transformer faults. Meanwhile, Partial-Discharge Monitoring is the fastest-growing segment, projected to expand at an 11.3% CAGR, supported by increasing demand for early fault detection and predictive maintenance.

By End-User

Segment Metric Primary Demand Driver
Power Utilities 60.5% share Regulated reliability obligations
Industrial 10.4% CAGR Process continuity economics
Transport, Data Centers and Others USD 0.50 Billion Uptime-critical facility loads


Utilities anchor the Transformer Monitoring System Market and will continue to, but industrial buyers convert faster because their downtime cost is measured directly in lost production rather than regulatory penalty. Semiconductor fabs and hyperscale data centers now specify monitoring at the design stage.


Regional Market Share Analysis

Region Metric (2025) Primary Investment Themes
North America USD 0.86 Billion Interconnection queues, data-center load, aging fleets
Europe 23.6% share Regulated performance frameworks, cross-border capacity
Asia-Pacific 11.2% CAGR Ultra-high-voltage build-out, renewable integration
South America 6.2% share Hydro transmission corridors, loss reduction
Middle East & Africa 10.6% CAGR Desalination load, mega-project substations
Total USD 3.40 Billion

Regional performance in the Transformer Monitoring System Market tracks grid investment intensity far more closely than it tracks electricity consumption, which is why Asia-Pacific leads on both share and growth.


North America

Country Metric Key Driver
US 81.4% of region Order No. 1920 planning compliance
Canada USD 0.11 Billion Hydro-Québec transmission renewal
Mexico 8.1% CAGR Industrial nearshoring load


Interconnection backlogs dominate U.S. planning discussions, and the DOE's transmission needs study documents transformer procurement as a binding constraint on queue clearance [3]. Utilities have responded by instrumenting critical-path units first, prioritising autotransformers feeding data-center clusters in Virginia, Ohio, and Texas. Canadian adoption follows a slower but steadier regulated pattern.

Europe

Country Metric Key Driver
Germany 23.1% of region Offshore corridor converter stations
UK USD 0.14 Billion RIIO-2 reliability incentives
France 12.4% of region Nuclear fleet transformer renewal
Italy 8.9% of region Interconnector expansion
Spain 9.6% CAGR Solar interconnection density
Nordic Countries 8.2% of region Industrial electrification
Russia 6.1% of region Domestic equipment substitution
Rest of Europe 5.3% of region EU cohesion grid funding


Europe's advantage is regulatory clarity rather than volume. The EU grid action plan earmarked EUR 584 billion through 2030, and national regulators have largely aligned incentive structures behind measurable availability outcomes [9]. German offshore converter stations, in particular, justify premium diagnostics because a single failure isolates gigawatts of generation.

Asia-Pacific

Country Metric Key Driver
China 44.8% of region Ultra-high-voltage corridor programme
India 12.4% CAGR National Electricity Plan transmission volume
Japan USD 0.14 Billion Post-restart nuclear reliability standards
South Korea 7.8% of region Semiconductor fab load density
ASEAN 10.9% CAGR Cross-border interconnection projects
Rest of Asia-Pacific 4.6% of region Rural electrification upgrades


China's new-type power system guidance embeds condition-based asset management into provincial grid company targets, which pushes monitoring adoption faster than any commercial argument would [12]. India's transmission plan calls for roughly 191,000 circuit kilometres of new lines and the substation equipment to match, making it the highest-velocity national opportunity within the Transformer Monitoring System Market [11].

South America

Country Metric Key Driver
Brazil 58.3% of region ANEEL transmission auction cycles
Argentina USD 0.04 Billion Vaca Muerta industrial load
Rest of South America 9.4% CAGR Andean interconnection projects


Brazilian transmission auctions bundle long concession terms with availability penalties, which quietly makes monitoring a bid-economics question rather than an engineering preference. Chilean and Colombian operators have begun copying that contractual structure.

Middle East & Africa

Country Metric Key Driver
Saudi Arabia 31.7% of region NEOM and desalination substations
UAE 22.4% of region Nuclear and solar integration
South Africa USD 0.03 Billion Eskom fleet reliability recovery
Egypt 11.8% CAGR Interconnector and industrial zones
Rest of MEA 14.2% of region Donor-funded grid strengthening


Gulf procurement favours turnkey packages where monitoring arrives bundled with the transformer itself, compressing the aftermarket but raising attach rates. South Africa presents the inverse case: a stressed fleet with acute diagnostic need and constrained capital, which is exactly where service-based commercial models find traction [25].


Transformer Monitoring System Market By Region, 2025-2035

Competitive Benchmarking

Concentration sits in the moderate band. The top five suppliers hold roughly 44% to 52% of global revenue, and the estimated HHI falls between 850 and 1,000 — enough scale for the majors to set interface standards, but loose enough that specialists in ultra-sensitive gas detection or secure gateways win meaningful share. The Transformer Monitoring System Market rewards installed-base incumbency, since diagnostic history has real switching value.

Company Est. Revenue Share Range Key Offerings for Transformer Monitoring System Market Strategic Positioning
Hitachi Energy ~10–13% TXpert ecosystem, digital bushing sensors Broadest OEM-integrated portfolio [18]
ABB ~9–12% CoreSense multi-gas, condition assessment services Sensor chemistry leadership [20]
Siemens Energy ~8–11% Sensformer connected transformers Bundles monitoring with new units [19]
GE Vernova ~7–10% Perception fleet software, Kelman DGA Analytics-first go-to-market [21]
Qualitrol (Fortive) ~6–9% Bushing, PD and fibre-optic temperature systems Retrofit and aftermarket specialist [22]
Doble Engineering ~5–8% Diagnostic instruments and advisory services Test-lab credibility and standards influence
Schneider Electric ~4–7% EcoStruxure asset advisor Strong distribution-class reach
Camlin Group ~3–6% TOTUS online DGA and bushing monitors Agile challenger in retrofit tenders
Dynamic Ratings ~3–5% Modular monitoring and dynamic loading Utility-engineering-led niche
Weidmann Electrical Technology ~2–4% Oil diagnostics and insulation analytics Materials-science differentiation
Mitsubishi Electric ~2–4% Integrated substation monitoring Strong Japan and ASEAN position


Recent News & Developments

  • Hitachi Energy (March 2024): Expanded TXpert Hub interoperability to third-party sensors, signalling a shift away from closed OEM architectures and widening the addressable retrofit pool [18]
  • FERC (May 2024): Issued Order No. 1920 mandating long-term regional transmission planning, indirectly accelerating diagnostic budgets tied to new interconnection assets [13]
  • Siemens Energy (September 2024): Reported record transformer order backlog, with connected units shipped as standard on selected transmission ranges [19]
  • European Commission (November 2023): Launched the EU Grid Action Plan committing EUR 584 billion of grid investment through 2030 [9]
  • Camlin Group (June 2024): Announced a multi-year fleet monitoring agreement with a Southeast Asian transmission operator covering several hundred units [8]
  • GE Vernova (February 2025): Released updated fleet analytics with AI-based fault-mode classification, targeting utilities running mixed-vendor sensor estates [21]
  • Central Electricity Authority, India (July 2024): Published transmission expansion targets requiring substantial new substation capacity through 2032 [11]
  • NERC (December 2024): Flagged elevated transformer failure exposure in its long-term reliability assessment, strengthening the internal case for monitoring capex [4]


Transformer Monitoring System Market Report Scope

Parameter Detail
Market Scope Global Transformer Monitoring System Market by component, monitoring type, phase, deployment type, transformer type, service, end-user, and geography
Study Period 2021–2035 (Historical 2021–2024; Base Year 2025; Forecast 2026–2035)
CAGR 9.75% (2026–2035)
Market Size Checkpoints USD 3.40 Billion (2025); USD 3.71 Billion (2026); USD 8.56 Billion (2035)
Fastest Growing Segments Software (12.7% CAGR); Cloud/Hybrid deployment (13.5% CAGR); Specialty transformers (12.8% CAGR)
Companies Profiled 11 global and regional suppliers including OEMs, instrument specialists, and analytics vendors
Valuation Currency USD Billion, constant 2025 exchange rates

FAQs

How should a utility phase spending across a mixed-age fleet in the Transformer Monitoring System Market?
Instrument critical-path and single-contingency units first, then units past 30 years. Phased three-year tranches keep annual capex predictable while covering the highest-consequence assets early [5].
What makes retrofitting an energised transformer difficult?
Bushing-tap and oil-circulating installations normally require de-energisation, competing with scarce outage windows. Externally mounted acoustic and thermal sensors offer partial coverage without a shutdown [16].
Do online gas sensors replace laboratory oil sampling entirely?
No. Online units catch transient fault gases between sampling intervals, but laboratory analysis remains the reference for furan, moisture, and oil quality testing under established interpretation standards [23].
Which procurement criteria separate vendors in the Transformer Monitoring System Market?
Prioritise open data interfaces, calibration drift specifications, and documented sensor lifetime. Proprietary protocols create switching costs that outlast the hardware itself [15].
Are substation monitoring gateways subject to cybersecurity regulation?
Yes, in North America, where CIP standards now reach low-impact bulk electric system cyber assets. Compliance documentation typically adds six to nine months to procurement [14].
Can monitoring data support insurance or warranty claims?
Continuous gas and thermal records establish loading history and defect progression, which insurers increasingly accept as evidence. Some underwriters now discount premiums for instrumented fleets [7].
Which new use cases are widening the Transformer Monitoring System Market beyond utilities?
Hyperscale data centers, semiconductor fabs, and electrified rail now specify monitoring at the design stage. Their downtime costs justify diagnostics without any regulatory mandate [3].    
Author
Author
Author Profile
Anshula Mandaokar LinkedIn
Team Lead - Research
Anshula Mandaokar holds an academic degree in Chemical Engineering and has been contributing to the field for more than 5 years. She has expertise in Market Research and Business Consulting and serves as a Team Lead for a reputed Market Research firm under the Chemicals and Materials domain spectrum. She has worked on multiple projects, generating explicit results in a quick turnaround time. Her understanding of data interpretation justifies her role as a leader.
Download Free Sample

Kindly complete the form below to receive a free sample of this Report

* Please use a valid business email

Download PDF ×

We do not share your information with anyone. However, we may send you emails based on your report interest from time to time. You may contact us at any time to opt-out.
















