US 3D Printing Market Segmentation
US 3D Printing Market By Type (USD Million, 2025-2035)
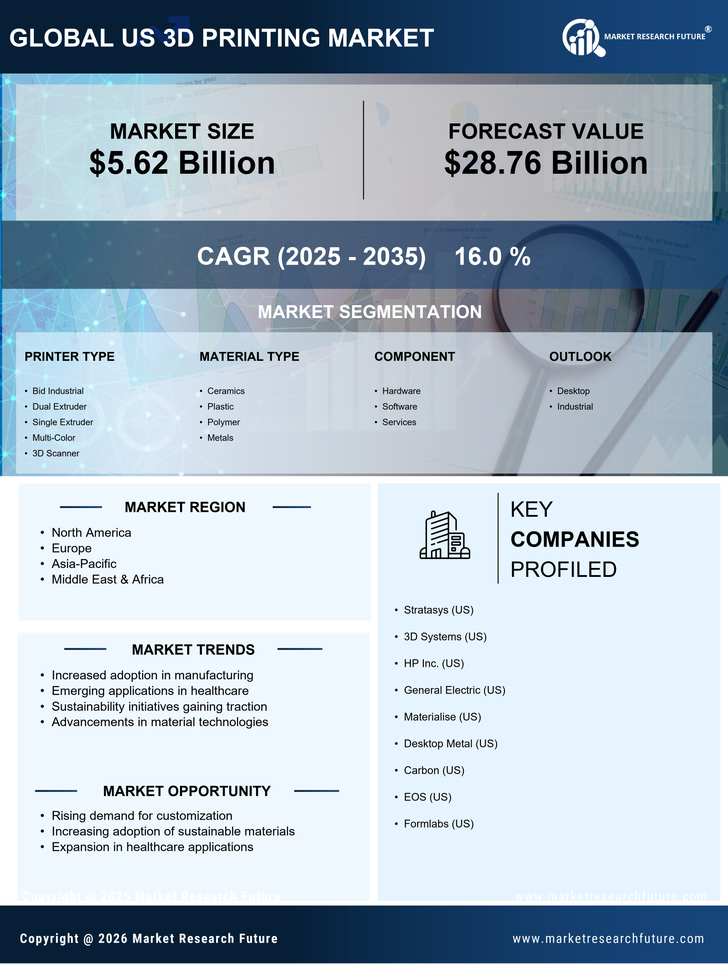
- Hardware
- Software
- Services
US 3D Printing Market By Application (USD Million, 2025-2035)
- Prototyping
- Tooling
- Functional Parts
US 3D Printing Market By Printer Type (USD Million, 2025-2035)
- Desktop 3D Printer
- Industrial 3D Printer
US 3D Printing Market By US 3D Printing Market (USD Million, 2025-2035)
- Stereolithography
- Fused Deposition Modeling
- Selective Laser Sintering
- Direct Metal Laser Sintering
- Polyjet Printing
- Inkjet Printing
- Electron Beam Melting
- Laser Metal Deposition
- Digital Light Processing
- Laminated Object Manufacturing
- Others
US 3D Printing Market By Software (USD Million, 2025-2035)
- Design Software
- Printer Software
- Scanning Software
- Others
US 3D Printing Market By Vertical (USD Million, 2025-2035)
- Industrial 3D Printing
- Desktop 3D Printing
US 3D Printing Market By Material (USD Million, 2025-2035)
- Polymer
- Metal
- Ceramic