Virtual Reality Market (2026 - 2035)

Virtual Reality Market Size, Share and Research Report: By Component (Hardware, Software), By Device Type (Head-Mounted Displays, Gesture Tracking Device, Projectors and Display Walls, 3D Cameras), By Technology (Non-Immersive, Semi-Immersive, Fully Immersive), By Vertical (Consumer Electronics, Aerospace and Defense, Healthcare, Commercial, Industrial) And By Region (North America, Europe, Asia-Pacific, And Rest Of The World) –Market Forecast Till 2035.
ID: MRFR/ICT/0411-CR
102 Pages
Ankit Gupta
Last Updated: July 28, 2026
Virtual Reality Market
Market Size
Forecast Period2026-2035
CAGR (2026-2035)19.2%
2025 Market SizeUSD 14.18 billion
2035 Market SizeUSD 82.12 billion
Key Players
Meta Platforms
Sony Interactive Entertainment
Apple
ByteDance
HTC
Samsung Electronics
Opportunities
  • Mixed-Reality and Spatial-Computing Convergence
  • AI-Personalized Immersive Experiences
  • Emerging-Market Manufacturing VR Training

Virtual Reality Market Summary

The Virtual Reality Market reached an estimated USD 14.18 billion in 2025 and is projected to grow from USD 16.90 billion in 2026 to USD 82.12 billion by 2035, expanding at a CAGR of 19.2% during the forecast period. This trajectory reflects growing enterprise investment in immersive training platforms and the declining average selling price of consumer-grade head-mounted displays. Corporate training budgets alone channeled over USD 4.2 billion toward simulation-based learning in 2024, reducing workplace safety incidents by an estimated 35% in early-adopter industries such as oil and gas [1].

The Virtual Reality Market is seeing a fundamental transition in technology as tethered, PC-dependent headsets are replaced with stand-alone devices with on-board computing. Spatial computing that once needed desktop GPUs is now available on Qualcomm’s Snapdragon XR platform and similar offerings from MediaTek. In the U.S. Department of Defense's FY 2025 budget, $1.1 billion was budgeted for extended-reality training simulators, showing institutional confidence in the technology's operational readiness [2].

North America held around 40.2% of the Virtual Reality Market in 2025, thanks to a well-established vendor base and substantial venture capital investments in XR start-ups. Asia-Pacific is expected to witness the most growth at a CAGR of 25.3% until 2035, with 5G rollouts and cloud-rendered VR reducing the per-seat deployment cost across manufacturing hubs in China, Japan, and South Korea. The second-highest share was attributable to Europe, with almost 28%, driven by automotive and aerospace simulation projects in Germany and France. This decade is a critical moment for the global adoption of immersive technology, given the confluence of AI, spatial computing and lightweight optics.

Key Report Takeaways

• By Offering

  • Hardware captured approximately 84% of the Virtual Reality Market in 2025, driven by rapid stand-alone headset proliferation.
  • Services are forecast to expand at a 23.1% CAGR through 2035 as outcome-based integration contracts replace one-time device procurement.

• By Device Form Factor

  • Stand-alone head-mounted displays are projected to grow at a 24.0% CAGR through 2035, outpacing tethered systems as on-device processing matures.
  • Tethered HMDs retained roughly 38% of revenue in 2025, sustained by professional visualization and defense applications.

• By End-User Industry

  • Gaming held an estimated 58.9% share of the Virtual Reality Market in 2025, reinforced by titles designed for room-scale interaction.
  • Healthcare is projected to advance at a 26.1% CAGR through 2035 as surgical simulation and therapeutic exposure programs scale.

• By Geography

  • North America accounted for 40.2% of the Virtual Reality Market in 2025.
  • Asia-Pacific is anticipated to be the fastest-growing region at a 25.3% CAGR, propelled by 5G infrastructure and government digitization mandates.


Market Size and Forecast (2021–2035)

Market Research Future (MRFR) estimations are built on a mixture of vendor disclosed revenue disclosures, import-export databases, patent filing trends, and proprietary econometric modeling. Historical data (2021-2024) reflect actual market performance. 2025 is the base-year calibration point; 2026-2035 values are model-projected to the calibrated 19.2% CAGR, adjusted for anticipated demand shifts in corporate and consumer categories.
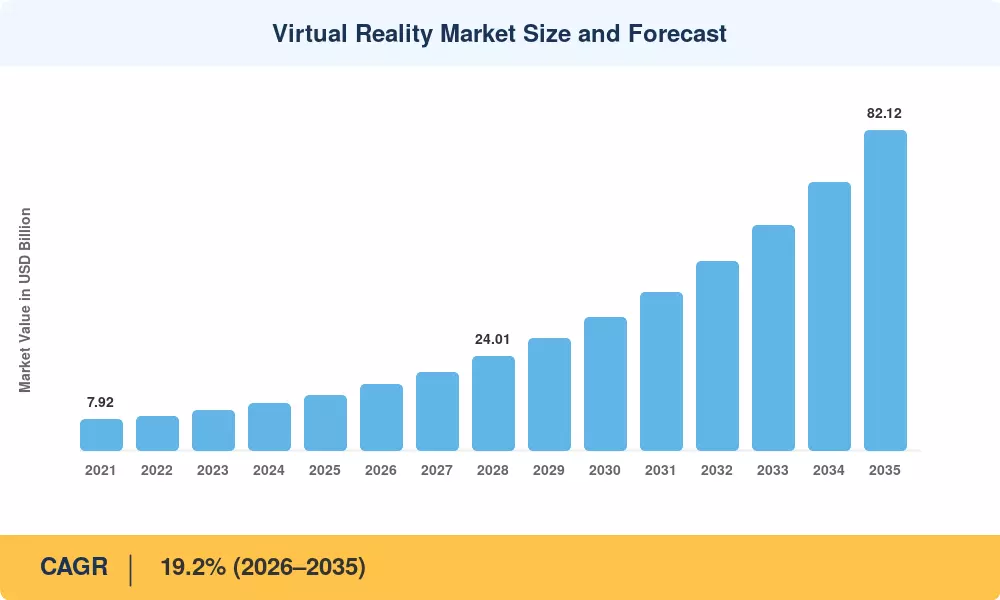
Virtual Reality Market Size and Forecast
Our Impact
Enabled $4.3B Revenue Impact for Fortune 500 and Leading Multinationals
Partnering with 2000+ Global Organizations Each Year
30K+ Citations by Top-Tier Firms in the Industry

Driver Impact Analysis

Driver ~% Impact on CAGR Geographic Relevance Impact Timeline
Enterprise workforce training adoption +3.8% Global Medium-term (2–4 yr)
Consumer gaming and interactive entertainment +3.4% North America, Asia-Pacific Short-term (≤2 yr)
5G and edge-computing deployment +2.9% Asia-Pacific, Europe Medium-term (2–4 yr)
Healthcare simulation and therapeutic VR +2.5% North America, Europe Long-term (≥4 yr)
Declining headset ASPs and component costs +2.1% Global Short-term (≤2 yr)
Defense and public-sector simulation budgets +1.8% North America, the Middle East Long-term (≥4 yr)
Retail and e-commerce virtual try-on experiences +1.3% Europe, Asia-Pacific Medium-term (2–4 yr)


Enterprise Workforce Training Adoption

Large manufacturers and energy companies are embedding VR simulations into mandatory safety and skills programs. BP reported a 43% reduction in on-site training incidents after deploying immersive well-control scenarios across 14 upstream facilities [1]. The 2024 workforce study found that VR-trained employees completed certification modules four times faster than classroom cohorts and retained procedural knowledge 275% more effectively at the 30-day mark [12]. These economics are pushing Fortune 500 learning-and-development teams to shift discretionary budgets toward VR-delivered curricula, reinforcing the growth trajectory of the Virtual Reality Market through the medium term.

Consumer Gaming and Interactive Entertainment

The installed base of consumer VR headsets surpassed 45 million units globally by end-2024, with AAA studios now committing dedicated development budgets to room-scale titles [10]. Meta's Quest platform has generated over USD 2 billion in cumulative content revenue since launch, demonstrating that the software flywheel — more users attracting more developers attracting more users — has reached self-sustaining velocity in the gaming vertical of the Virtual Reality Market.

5G and Edge-Computing Deployment

Cloud-rendered VR relies on sub-20-millisecond round-trip latency to avoid perceptible lag, a threshold that 5G standalone networks paired with multi-access edge compute can reliably achieve. South Korea's three mobile operators collectively covered 93% of the urban population with 5G by mid-2024, and SK Telecom's Jump VR service reached 4.8 million subscribers [7]. This infrastructure trajectory lowers the processing burden on headsets, enabling thinner, lighter devices that expand the addressable user base of the Virtual Reality Market in Asia-Pacific.

Healthcare Simulation and Therapeutic VR

The U.S. Centers for Medicare & Medicaid Services issued reimbursement codes for VR-based chronic pain therapy in 2024, opening a direct payment pathway for clinical-grade VR applications [8]. AppliedVR's EaseVRx received FDA De Novo authorization for lower-back pain management, and Johns Hopkins integrated VR surgical rehearsal platforms across its residency programs. These regulatory and institutional milestones are converting healthcare from an experimental vertical into a durable revenue pillar within the Virtual Reality Market.


Restraints Impact Analysis

The restraint impact percentages below are directional estimates and represent drag on the headline CAGR. They reflect friction points that slow — but do not reverse — the overall growth trend.

Restraint ~% Impact on CAGR Geographic Relevance Impact Timeline
High upfront cost of premium VR headsets –1.9% Global Short-term (≤2 yr)
Motion sickness and user comfort limitations –1.4% Global Medium-term (2–4 yr)
Limited enterprise content libraries –1.1% Europe, South America Medium-term (2–4 yr)
Privacy and biometric data security concerns –0.8% North America, Europe Long-term (≥4 yr)
Hardware fragmentation and SDK interoperability –0.7% Global Short-term (≤2 yr)


High Upfront Cost of Premium VR Headsets

Enterprise-grade headsets with inside-out tracking and high-resolution passthrough cameras still command prices between USD 1,000 and USD 3,500 per unit, creating procurement resistance among mid-market firms. A 2024 survey of 800 CIOs found that 41% cited total cost of ownership — including content development, IT support, and device refresh cycles — as the primary barrier to scaling VR beyond pilot programs [13]. Until component costs for pancake lenses and micro-OLED panels decline further, price sensitivity will temper the expansion of the Virtual Reality Market among budget-constrained buyers.

Motion Sickness and User Comfort Limitations

Vestibular conflict — the mismatch between visual motion cues and inner-ear signals — still affects an estimated 25–40% of first-time VR users, depending on content type and session duration [14]. While foveated rendering and higher refresh rates (90 Hz and above) have reduced symptom severity, locomotion-intensive applications in training and gaming continue to trigger discomfort that limits session length and repeat usage, acting as a persistent headwind for the Virtual Reality Market.


Virtual Reality Market Opportunities

Mixed-Reality and Spatial-Computing Convergence

The boundary between VR and augmented reality is dissolving as passthrough-enabled headsets allow users to toggle between fully virtual and blended environments. Apple's Vision Pro and Meta's Quest 3 both emphasize mixed-reality workflows, creating a continuum that expands addressable use cases from isolated simulation to collaborative spatial design. Hardware vendors that unify VR and AR capabilities within a single device stand to capture cross-vertical demand spanning architecture, education, and field service.

AI-Personalized Immersive Experiences

Generative AI can dynamically create VR environments, NPC behaviors, and training scenarios tailored to individual learner profiles. NVIDIA's Omniverse platform already enables real-time synthetic-data generation for digital twins, and integrating large language models into VR content pipelines could reduce custom development costs by 40–60% [18]. This cost compression opens the Virtual Reality Market to small and medium enterprises that previously found bespoke VR content prohibitively expensive.

Emerging-Market Manufacturing VR Training

China, India, and Southeast Asian nations collectively employ over 350 million factory workers, yet VR training penetration in these markets remains below 2%. Cloud-rendered VR — streamed over 5G to low-cost stand-alone headsets — can deliver safety and assembly simulations at a fraction of on-premises costs. India's Skill India Digital initiative targets 10 million digitally skilled workers by 2027, and VR-based vocational modules are among the approved delivery formats [19].

VR-as-a-Service and Subscription Models

Outcome-based pricing — where enterprises pay per user per month rather than purchasing hardware outright — is reducing adoption friction and converting capital expenditure into operational expenditure. Providers such as Strivr and Immerse bundle headsets, content, and analytics dashboards into managed contracts with measurable ROI benchmarks [15]. This shift aligns with broader enterprise procurement trends and is expanding the services segment of the Virtual Reality Market at a faster rate than hardware.

Data Monetization Through Behavioral Analytics

VR headsets equipped with eye-tracking and biometric sensors generate rich behavioral datasets — gaze patterns, reaction times, stress indicators — that enterprises can feed into workforce analytics and product-testing feedback loops. Retailers such as Walmart already use VR-derived attention mapping to optimize shelf layouts, and pharmaceutical companies employ gaze analytics in clinical-trial endpoint monitoring [20]. Monetizing this data layer creates a recurring revenue stream that extends the value chain well beyond hardware sales.


Virtual Reality Market Future Outlook

AI-Native Virtual Environments

By 2028, generative AI is expected to automate 50–60% of 3D asset creation for VR applications, collapsing production timelines from months to days [18]. Real-time neural rendering — where AI infers photorealistic scenes from sparse data — will reduce the compute burden on headsets and cloud servers alike. For the Virtual Reality Market, AI-native content generation transforms the economics of custom enterprise VR from a bespoke-studio model to a scalable platform model, dramatically expanding the addressable customer base.

Platform Economics and Content Ecosystems

The Virtual Reality Market is transitioning toward platform dynamics similar to mobile app stores. Meta's Horizon platform, Apple's visionOS App Store, and Valve's SteamVR are competing to attract developers through revenue-share incentives and SDK toolkits. By 2030, platform fees, in-app transactions, and subscription bundles could represent 25–30% of total VR revenue, shifting value from hardware margins to recurring software economics [25].

Lightweight Optics and All-Day Wearability

Pancake lens systems and micro-OLED displays are shrinking headset form factors toward sunglasses-weight profiles. Metalenz's flat-optics technology and Samsung's 3,500-PPI OLEDoS panels suggest that by 2032, consumer VR headsets may weigh under 120 grams — a threshold widely considered necessary for multi-hour workplace use [26]. Lighter, more comfortable devices will push the Virtual Reality Market beyond episodic gaming sessions into sustained professional workflows.

Regulatory Frameworks and Data Governance

The EU's AI Act and proposed XR-specific data-protection guidelines will establish guardrails for biometric data collected by VR headsets — eye-tracking patterns, physiological stress indicators, and spatial-movement logs. California's Consumer Privacy Act (CCPA) amendments are also expected to classify VR behavioral data as sensitive personal information by 2027 [16]. Clear regulatory frameworks, while initially adding compliance costs, will ultimately build user trust and accelerate institutional adoption in the Virtual Reality Market.


Virtual Reality Market Segmentation

By Offering (Hardware, Software, Services)

Segment Key Metric Primary Demand Driver
Hardware 84% share (2025) Stand-alone headset shipment growth
Software USD 1.28 billion (2025) Gaming content and enterprise applications
Services 23.1% CAGR (2026–2035) Managed VR-as-a-service contracts


Hardware remains the revenue backbone of the Virtual Reality Market, driven by a rapid product cycle that sees major OEMs refreshing headset lines every 12–18 months. Stand-alone devices now outsell tethered units by a margin exceeding two-to-one, and component-cost deflation — particularly in Qualcomm's XR2 chipset family — has brought entry-level headsets below USD 300. Services, though smaller in absolute terms, are the fastest-growing offering category as enterprises shift from purchasing headsets outright to subscribing to managed immersive-training platforms that bundle hardware, content, analytics, and support into predictable monthly fees.

By Device Form Factor (Tethered HMD, Stand-Alone HMD, Others)

Segment Key Metric Primary Demand Driver
Stand-Alone HMD 24.0% CAGR (2026–2035) Untethered mobility for enterprise and consumer use
Tethered HMD 38% share (2025) Professional visualization and defense simulation
Others (CAVEs, Phone-Based) USD 0.41 billion (2025) Location-based entertainment and research labs


Stand-alone head-mounted displays represent the pivotal growth vector within the Virtual Reality Market. Untethered operation enables VR deployment on factory floors, in hospital wards, and across classroom settings where trailing cables pose safety and logistics challenges. Tethered HMDs retain relevance in professional niches — architectural visualization, automotive clay-model review, and military simulation — where maximum graphical fidelity and sensor precision justify the mobility trade-off.

By Immersion Level (Non-Immersive, Semi-Immersive, Fully-Immersive)

Segment Key Metric Primary Demand Driver
Semi-Immersive 45.7% share (2025) Desktop VR, flight simulators, training screens
Fully-Immersive 25.1% CAGR (2026–2035) Six-degrees-of-freedom HMDs with haptic feedback
Non-Immersive USD 1.02 billion (2025) Browser-based 3D and 360-degree video


Semi-immersive systems — including CAVE-style projection rooms and multi-monitor simulator rigs — dominate the share because they require no headset, making them the default choice for collaborative engineering reviews. Fully-immersive platforms, which deliver total sensory enclosure via high-resolution HMDs and spatial audio, are growing fastest as hardware improvements narrow the comfort and resolution gaps that previously limited session duration in the Virtual Reality Market.

By End-User Industry (Gaming, Media & Entertainment, Healthcare, Others)

Segment Key Metric Primary Demand Driver
Gaming 58.9% share (2025) Installed headset base and content library depth
Healthcare 26.1% CAGR (2026–2035) Surgical simulation and therapeutic applications
Media & Entertainment USD 1.56 billion (2025) Live events, virtual tourism, immersive cinema
Others (Retail, Education, Defense) 22.4% CAGR (2026–2035) Virtual try-on, classroom VR, military training


Gaming continues to anchor the Virtual Reality Market from an end-user perspective, providing the volume base over which hardware R&D costs are amortized. Healthcare is emerging as the highest-growth vertical, propelled by regulatory clearances for VR-based therapies and the integration of surgical-rehearsal platforms into medical residency curricula. Retail adoption — particularly virtual try-on for fashion and furniture — is accelerating as conversion-rate data from early deployments demonstrates measurable revenue uplift for brands [11].


Regional Market Share Analysis

Region Key Metric Primary Investment Themes
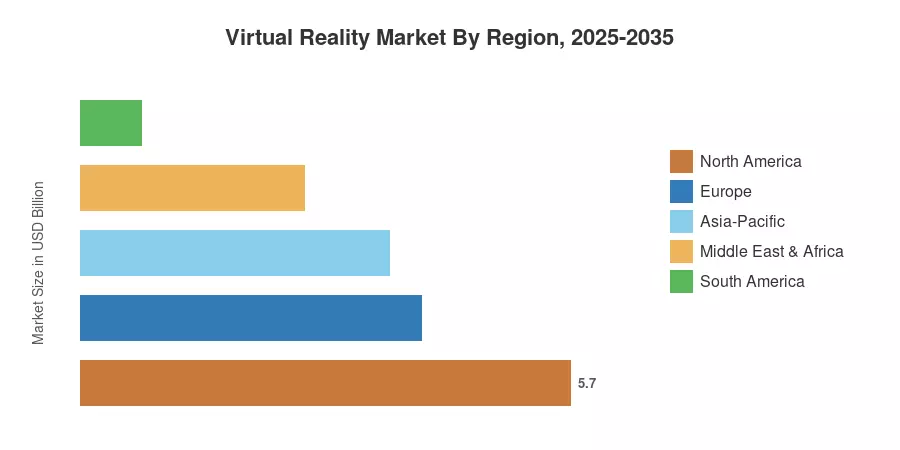
North America 40.2% share (2025) Defense simulation, healthcare VR, gaming ecosystem
Europe USD 3.97 billion (2025) Automotive design, aerospace training and EU digital skills
Asia-Pacific 25.3% CAGR (2026–2035) 5G-cloud VR, manufacturing training, consumer gaming
South America USD 0.71 billion (2025) Mining safety, telemedicine VR, education
Middle East & Africa 18.4% CAGR (2026–2035) Smart-city experiences, oil & gas simulation, defense
Total USD 14.18 billion (2025)

The Virtual Reality Market exhibits pronounced regional asymmetry: mature markets in North America and Europe drive the largest revenue pools, while Asia-Pacific delivers the highest growth rates. South America and the Middle East & Africa remain nascent but are beginning to absorb enterprise VR solutions through multilateral development programs and government digitization agendas.


North America

Country Key Metric Key Driver
United States 78% of regional share Defense budgets and Silicon Valley R&D concentration
Canada USD 0.57 billion (2025) Mining and energy sector VR training
Mexico 19.8% CAGR (2026–2035) Automotive assembly plant simulation programs


The United States anchors the Virtual Reality Market in North America through a combination of federal defense spending, deep capital markets, and the headquarters of Meta, Apple, and Valve. The U.S. Army's Integrated Visual Augmentation System (IVAS) program alone is valued at USD 21.9 billion over ten years [2]. Canada's resource sector, particularly oil sands and mining, increasingly mandates VR-based safety certification for remote-site personnel, while Mexico's automotive corridor is adopting assembly-line VR trainers supplied by Tier-1 integrators.

Europe

Country Key Metric Key Driver
Germany 26% of regional share Automotive and industrial design simulation
United Kingdom USD 0.69 billion (2025) NHS clinical training and fintech VR applications
France 20.1% CAGR (2026–2035) Aerospace (Airbus, Dassault) VR integration
Italy USD 0.31 billion (2025) Cultural heritage and tourism VR
Spain 19.6% CAGR (2026–2035) Retail and real-estate virtual showrooms
Nordic Countries USD 0.29 billion (2025) EdTech and maritime simulation
Russia 16.8% CAGR (2026–2035) Defense and energy training
Rest of Europe USD 0.42 billion (2025) Varied industrial applications


The European Virtual Reality Market benefits from strong institutional demand. Germany's automotive OEMs — Volkswagen, BMW, and Mercedes-Benz — use VR for vehicle design review and ergonomic validation, shortening development cycles by up to 30% [21]. The European Commission's Digital Decade program targets 80% of adults with basic digital skills by 2030, and multiple member states have earmarked VR learning modules as eligible expenditures under the Recovery and Resilience Facility.

Asia-Pacific

Country Key Metric Key Driver
China 38% of regional share Consumer headset manufacturing and gaming
India 27.2% CAGR (2026–2035) Skill India Digital vocational VR
Japan USD 0.48 billion (2025) Robotics training and aging-society healthcare
South Korea 26.4% CAGR (2026–2035) 5G cloud-VR entertainment services
ASEAN USD 0.22 billion (2025) Tourism and factory safety programs
Rest of Asia-Pacific 21.8% CAGR (2026–2035) Emerging digital infrastructure


Asia-Pacific represents the fastest-growing corridor in the Virtual Reality Market. China's ByteDance, through its Pico subsidiary, has become the region's leading stand-alone headset vendor, shipping an estimated 3.2 million units in 2024 [22]. Japan's demographic challenge — a shrinking labor force — is accelerating VR adoption for remote-assistance and robot-teleoperation use cases, while South Korea's mobile carriers are bundling VR content subscriptions with 5G plans, creating a carrier-subsidized demand engine.

South America

Country Key Metric Key Driver
Brazil 52% of regional share Mining VR safety, telemedicine
Argentina USD 0.11 billion (2025) Agricultural research simulation
Rest of South America 17.9% CAGR (2026–2035) Education and government digitization


Brazil dominates the South American Virtual Reality Market, driven by large-scale mining operators such as Vale that mandate VR safety drills for underground crews. Telemedicine VR platforms are also gaining traction in rural areas where specialist physicians are scarce, supported by Inter-American Development Bank funding for digital-health pilot projects [23].

Middle East & Africa

Country Key Metric Key Driver
Saudi Arabia 34% of regional share NEOM smart-city VR experiences
UAE USD 0.16 billion (2025) Tourism and real-estate virtual tours
South Africa 19.1% CAGR (2026–2035) Mining safety and skills development
Egypt USD 0.05 billion (2025) Cultural tourism VR pilots
Rest of MEA 17.2% CAGR (2026–2035) Oil & gas training, defense


Saudi Arabia's Vision 2030 and the NEOM megaproject are catalyzing VR investment across the MEA region. The NEOM entertainment district has contracted immersive-experience providers to build permanent VR attractions, while Abu Dhabi's Mubadala fund has deployed capital into XR start-ups. South Africa's mining charter mandates digital safety training, creating a regulatory tailwind for the Virtual Reality Market in sub-Saharan Africa [24].


Virtual Reality Market By Region, 2025-2035

Competitive Benchmarking

The Virtual Reality Market is moderately concentrated, with the top five firms accounting for 55-62% of the global revenues. Meta Platforms’ Quest product line has the largest single share ahead of Sony’s PlayStation VR franchise and Apple’s Vision Pro ecosystem. The market's long tail comprises specialized enterprise vendors, component suppliers and regional OEMs, giving rise to an HHI index of 1,200–1,500, which is indicative of a fairly competitive structure.

Company Est. Revenue Share Range Key Offerings for the Virtual Reality Market Strategic Positioning
Meta Platforms ~28–33% Quest headset family, Horizon platform, Presence Platform SDK Consumer and enterprise ecosystem leader
Sony Interactive Entertainment ~10–14% PlayStation VR2, exclusive gaming content pipeline Console-integrated VR
Apple ~5–8% Vision Pro, visionOS spatial computing platform Premium mixed-reality positioning
ByteDance (Pico) ~4–7% Pico 4 series, enterprise Pico Neo Asia-Pacific consumer and enterprise share
HTC ~3–6% Vive Focus, Vive XR Elite, Viverse platform Enterprise and prosumer VR
Samsung Electronics ~2–4% Micro-OLED display supply, Galaxy XR partnership Component and OEM co-development
Valve Corporation ~2–4% Valve Index, SteamVR platform, Half-Life: Alyx PC gaming VR, developer ecosystem
Varjo Technologies ~1–3% XR-4, VR-3 headsets for enterprise simulation Ultra-high resolution professional VR
Microsoft ~1–3% HoloLens platform, IVAS defense contract, AltspaceVR legacy Defense and enterprise mixed reality
HP Inc. ~1–2% Reverb G2 headset, enterprise deployment services Workplace VR solutions


Recent News & Developments

  • Meta Platforms (September 2024): Launched the Quest 3S at USD 299, bringing mixed-reality passthrough to a sub-USD-300 price point and expanding the addressable consumer base of the Virtual Reality Market [10].
  • Apple (June 2024): Released Vision Pro internationally and introduced visionOS 2 with enhanced enterprise APIs, positioning the device for corporate spatial-computing workflows beyond initial consumer launch [25].


  • ByteDance / Pico (September 2024): Unveiled Pico 4 Ultra with dual 4K displays and mixed-reality cameras, aggressively pricing the device to compete with Quest 3 across Asia-Pacific markets [22].
  • U.S. FDA (November 2021): Granted De Novo classification to AppliedVR's EaseVRx for chronic lower-back pain management, establishing a regulatory precedent for reimbursable VR therapeutics in the Virtual Reality Market [8].


Virtual Reality Market Report Scope

Parameter Detail
Market Scope Global Virtual Reality Market covering hardware, software, services, and end-user verticals.
Study Period 2021–2035
CAGR 19.2% (2026–2035)
Base Year Market Size USD 14.18 billion (2025)
Forecast Endpoint USD 82.12 billion (2035)
Fastest Growing Segment (Offering) Services (23.1% CAGR)
Fastest Growing Segment (End-User) Healthcare (26.1% CAGR)
Companies Profiled Meta, Sony, Apple, ByteDance/Pico, HTC, Samsung, Valve, Varjo, Microsoft, HP
Valuation Currency USD billion


FAQs

How do VR headset refresh-rate specifications affect enterprise purchasing decisions?
Procurement teams prioritize 90 Hz or higher displays because lower refresh rates increase cybersickness reports and reduce session compliance. Most enterprise RFPs now list 90 Hz as a minimum threshold [14].
What total cost of ownership should a mid-market company expect for a 50-seat VR training deployment?
A 50-seat stand-alone deployment typically runs USD 75,000–USD 120,000 in Year 1, covering devices, content licensing, and IT integration. Annual maintenance thereafter averages 15–20% of the initial outlay [13].
How do enterprises measure ROI from VR training compared with classroom instruction?
Organizations track time-to-competency reduction, error-rate decline, and safety-incident frequency post-deployment. Early adopters report 30–40% faster certification and 25–50% fewer on-site incidents [12].
What interoperability standards should buyers evaluate when selecting a VR platform?
OpenXR, maintained by the Khronos Group, is the primary cross-platform runtime standard. Buyers should confirm headset and software vendor compliance with OpenXR 1.0 or later to avoid vendor lock-in [17].
How does 5G latency improvement influence cloud-rendered VR deployment feasibility?
Sub-20-millisecond round-trip latency on 5G standalone networks meets the motion-to-photon threshold required for comfortable cloud VR. This eliminates the need for high-end on-device GPUs [7].
What cybersecurity risks do VR headsets introduce into corporate IT environments?
VR headsets collect biometric data — eye-tracking, hand geometry, spatial movement — that constitutes sensitive PII under GDPR and CCPA. Enterprises must integrate headsets into endpoint-management and data-encryption frameworks [16].
When will lightweight VR headsets suitable for all-day professional use reach mainstream availability?
Micro-OLED panels and pancake optics are expected to bring headset weight below 150 grams by 2028–2029, crossing the comfort threshold for sustained workplace sessions [26].    
Author
Author
Author Profile
Ankit Gupta LinkedIn
Team Lead - Research
Ankit Gupta is a seasoned market intelligence and strategic research professional with over six plus years of experience in the ICT and Semiconductor industries. With academic roots in Telecom, Marketing, and Electronics, he blends technical insight with business strategy. Ankit has led 200+ projects, including work for Fortune 500 clients like Microsoft and Rio Tinto, covering market sizing, tech forecasting, and go-to-market strategies. Known for bridging engineering and enterprise decision-making, his insights support growth, innovation, and investment planning across diverse technology markets.

Research Approach


Secondary Research

The secondary research process involved comprehensive analysis of technology regulatory databases, peer-reviewed engineering journals, industry publications, and authoritative technology organizations. Key sources included the US Department of Commerce National Institute of Standards and Technology (NIST), Federal Communications Commission (FCC) equipment authorization database, Consumer Technology Association (CTA), Entertainment Software Association (ESA), VR/AR Association (VRARA), National Telecommunications and Information Administration (NTIA), IEEE Xplore Digital Library, ACM Digital Library, International Data Corporation (IDC), Gartner Research, Statista Technology Portal, Organisation for Economic Co-operation and Development (OECD) Digital Economy Outlook, European Commission Digital Economy and Society Index (DESI), National Bureau of Statistics of China (Technology Sector Reports), Japan Ministry of Economy, Trade and Industry (METI), Korea Ministry of Science and ICT, and national digital transformation agency reports from key markets.

Statistics on technology adoption, patent filings, hardware shipment volumes, software development trends, and competitive landscape analysis for head-mounted displays, gesture tracking devices, projectors and display walls, 3D cameras, and immersive software platforms were gathered from these sources.


Primary Research

In order to gather both qualitative and quantitative insights, supply-side and demand-side stakeholders were interviewed during the primary research process. CEOs, vice presidents of hardware engineering, chief technology officers, heads of regulatory affairs, and commercial directors from semiconductor firms, software developers, and VR headset manufacturers were examples of supply-side sources. Chief information officers, training directors, healthcare technology managers, executives from gaming studios, procurement leads from aerospace and defense contractors, healthcare facilities, educational institutions, commercial businesses, and industrial training facilities were examples of demand-side sources. Market segmentation, product roadmap timescales, pricing strategies, content ecosystem development, and enterprise deployment dynamics were all confirmed by primary research.

Primary Respondent Breakdown:

By Designation: C-level Primaries (32%), Director Level (31%), Others (37%)

By Region: North America (38%), Europe (25%), Asia-Pacific (28%), Rest of World (9%)


Market Size Estimation

Revenue mapping and device shipping volume analysis were used to get the global market valuation. The methodology comprised:

Finding more than fifty important technology suppliers in North America, Europe, Asia-Pacific, and Latin America

Product mapping between categories of software (immersive applications, development platforms, content creation tools) and hardware (head-mounted displays, gesture tracking devices, projectors and display walls, 3D cameras)

Analysis of annual sales for VR product portfolios, both reported and modeled

Coverage of producers accounting for 75–80% of the world market in 2024

Extrapolation of segment-specific valuations across consumer electronics, aerospace and defense, healthcare, commercial, and industrial sectors using top-down (vendor revenue validation) and bottom-up (device shipment volume × ASP by country/segment) methods

Download Free Sample

Kindly complete the form below to receive a free sample of this Report

Download PDF ×

We do not share your information with anyone. However, we may send you emails based on your report interest from time to time. You may contact us at any time to opt-out.
















