Warehouse Robotics Market (2026 - 2035)

Warehouse Robotics Market Size, Share and Research Report: By Type (Mobile Robots, Articulated Robots, Cylindrical Robots, SCARA Robots, Parallel Robots, Cartesian Robots), By Software (Warehouse Management System, Warehouse Control System, Warehouse Execution System), By Function (Pick & Place, Palletizing & De-palletizing, Transportation, Packaging) and By Regional (North America, Europe, South America, Asia Pacific, Middle East and Africa) - Industry Forecast Till 2035
ID: MRFR/SEM/3604-HCR
200 Pages
Nirmit Biswas, Aarti Dhapte
Last Updated: July 10, 2026
Warehouse Robotics Market
Market Size
Forecast Period2026-2035
CAGR (2026-2035)16.1%
2025 Market SizeUSD 10.02 Billion
2035 Market SizeUSD 44.58 Billion
Key Players
KUKA AG
Fanuc Corporation
ABB Ltd
Daifuku Co., Ltd.
Yaskawa Electric
Dematic
Opportunities
  • Robotics-as-a-Service (RaaS) for Mid-Market Penetration
  • Emerging-Market Warehouse Modernization
  • Data Monetization Through Fleet Analytics

Warehouse Robotics Market Summary

The Warehouse Robotics Market reached USD 10.02 billion in 2025, and Market Research Future (MRFR) projects it will grow from USD 11.63 billion in 2026 to USD 44.58 billion by 2035, registering a compound annual growth rate of 16.1% across the forecast window. Two forces are compressing fulfillment timelines simultaneously: tightening labor availability across OECD economies and same-day-delivery commitments that retailers can no longer walk back. Those pressures have pushed capital budgets toward autonomous mobile robots, automated storage and retrieval systems, and robotic picking cells at a pace that would have been unimaginable five years ago [1][2].

The technical narrative in the Warehouse Robotics Market is about fast displacement. Traditional fixed conveyor layouts geared for dependable pallet-in-pallet-out operations are giving way to flexible, software-orchestrated fleets that can be altered overnight. With new developments in computer vision, robotic arms can now pick up irregular and deformable materials, opening up use cases that were only possible manually before 2022. In December 2024, Zebra Technologies highlighted the rate of change with the acquisition of Photoneo for $350 million to bring 3-D vision IP in-house [3].

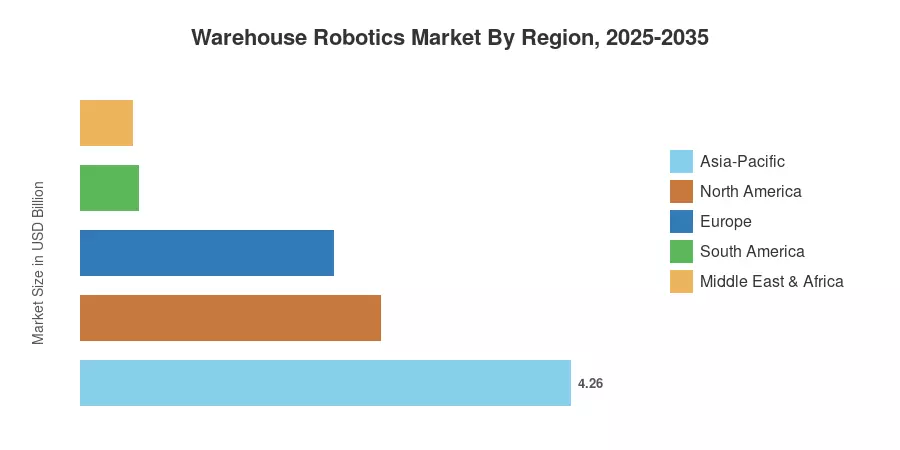
The Asia-Pacific region contributes to over 42.5% of the worldwide Warehouse Robotics Market, with China seeing a 44% jump in new warehouse robot installations in 2024 alone [1]. In North America, the second position is around 26% share, supported by investments in retailer and third-party logistics automation. In Europe, the pace is slower, at roughly 22%, with labour shortages in Germany, the UK and the Nordics driving faster adoption. By 2035, fleet orchestration, based on edge-AI and energy-efficient robotic architectures, will progressively set the course of the warehouse robotics market.

Key Report Takeaways

• By Product Type

  • Industrial robots held a 36.3% revenue share of the Warehouse Robotics Market in 2025, reflecting entrenched adoption in palletizing and heavy-goods handling.
  • Mobile robots are projected to expand at a 19.4% CAGR through 2035, outpacing every other product category as flexible navigation gains ground.

• By Function

  • Storage commanded a 41.0% share of the Warehouse Robotics Market in 2025, anchored by automated storage and retrieval system deployments.
  • Picking and sorting is the fastest-growing function at a projected 19.5% CAGR, driven by SKU proliferation in e-commerce.

• By Component

  • Hardware captured 75.0% of the Warehouse Robotics Market in 2025, covering robotic arms, autonomous vehicles, and sensor arrays.
  • Software is forecast to register a 16.9% CAGR as fleet-orchestration and warehouse-execution platforms gain traction.

• By End-User Industry

  • Retail and e-commerce accounted for 30.4% of the Warehouse Robotics Market revenue in 2025.
  • Automotive shows the highest projected CAGR at 19.2% through 2035, linked to just-in-time parts-kitting robotics.

• By Geography

  • Asia-Pacific held 42.5% share of the Warehouse Robotics Market in 2025 and continues to lead shipment volumes.
  • North America remains the second-largest region, with approximately USD 2.61 billion in 2025 revenue.


Warehouse Robotics Market Size and Forecast (2021–2035)

Market sizing approach includes a bottom-up revenue study of robot OEMs, integrators and software platform providers, cross-referenced with top-down industry shipment data from the International Federation of Robotics and proprietary primary interviews. Historical statistics (2021-2024) are checked using company filings and customs trade databases. Forecast numbers (2026-2035) are based on the calibrated 16.1% CAGR and adjusted for the maturation of adoption curves after 2031.
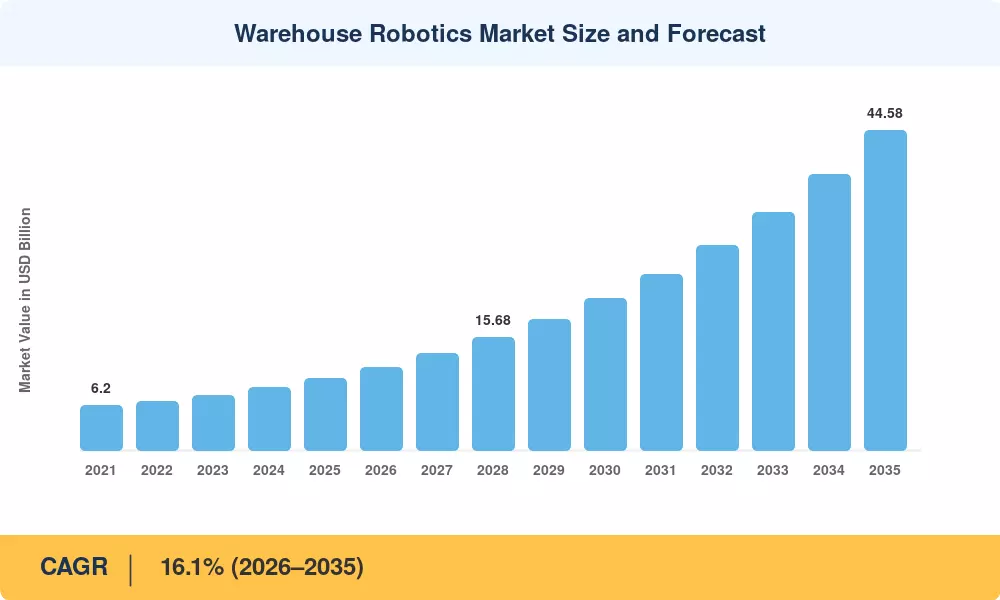
Warehouse Robotics Market Size and Forecast
Our Impact
Enabled $4.3B Revenue Impact for Fortune 500 and Leading Multinationals
Partnering with 2000+ Global Organizations Each Year
30K+ Citations by Top-Tier Firms in the Industry

Driver Impact Analysis

Driver ~% Impact on CAGR Geographic Relevance Impact Timeline
Labor shortages in the OECD warehouse sector 22% North America, Europe Short-term (≤2 yr)
Same-day / next-day delivery expansion 20% Global Medium-term (2–4 yr)
Computer-vision & AI grasping breakthroughs 18% Global Medium-term (2–4 yr)
SKU proliferation in omnichannel retail 14% North America, Asia-Pacific Short-term (≤2 yr)
Declining AMR unit costs 12% Asia-Pacific Long-term (≥4 yr)
Government automation subsidies (China, India) 8% Asia-Pacific Medium-term (2–4 yr)
Cold-chain pharmaceutical compliance mandates 6% Europe, North America Long-term (≥4 yr)


Labor Shortages Across Warehouse Operations

The U.S. Bureau of Labor Statistics reported a persistent 400,000+ unfilled warehouse and transportation positions annually between 2022 and 2024, with average hourly wages rising 18% in that window [4]. European markets face comparable strain: Germany's logistics sector vacancy rate hit 5.4% in late 2024, its highest on record. These shortages erode throughput reliability, giving warehouse operators a direct ROI case for robotic substitution that payback models increasingly close within 18 months.

Same-Day and Next-Day Delivery Commitments

Retail giants and third-party logistics providers have locked in delivery promises that compress order-to-ship windows below four hours in major metro areas. Amazon, Walmart, and JD.com collectively invested over USD 12 billion in fulfillment automation during 2024 [7]. Within the Warehouse Robotics Market, this driver disproportionately benefits mobile robot and goods-to-person system vendors, whose solutions can dynamically re-sequence pick paths in real time.

Computer Vision and AI-Enabled Grasping

Until 2021, robotic picking was limited to rigid, uniform objects. Advances in depth-sensing cameras and reinforcement-learning grasp planners have pushed pick-success rates above 98% for irregular items, including polybags and blister packs [2]. Siemens projects that by 2030, vision-guided manipulation will be standard across 60% of new warehouse robotic cells globally, unlocking categories previously considered automation-proof [2].

SKU Proliferation in Omnichannel Retail

The average distribution center now manages 2.5 times more SKUs than it did in 2018, according to MWPVL International data [13]. Manual picking at that density drives error rates above 1.5%, a threshold where returns-processing costs erode margins. The Warehouse Robotics Market directly benefits as operators deploy sortation systems and pick-assist cobots to maintain accuracy without proportional headcount increases.

Restraints Impact Analysis

The restraint percentages below are directional estimates that indicate relative drag on the growth trajectory. They should not be subtracted directly from the headline CAGR.

Restraint ~% Impact on CAGR Geographic Relevance Impact Timeline
High upfront integration costs with legacy WMS –18% Global Short-term (≤2 yr)
Interoperability gaps between multi-vendor fleets –16% North America, Europe Medium-term (2–4 yr)
Cybersecurity risks in connected robotic fleets –14% Global Long-term (≥4 yr)
Skilled robotics workforce deficit –12% Global Medium-term (2–4 yr)
Facility redesign costs for brownfield warehouses –10% Europe, South America Short-term (≤2 yr)


High Integration Costs with Existing Warehouse Management Systems

Deploying a fleet of autonomous mobile robots into a brownfield facility typically adds 25–40% to the base hardware cost in systems-integration fees, covering WMS middleware, sensor calibration, and workflow re-engineering [15]. For mid-sized 3PL operators running annual revenues below USD 200 million, that premium can push payback periods beyond three years, stalling purchase decisions. The Warehouse Robotics Market growth in the small-to-mid enterprise tier hinges on integrators simplifying this layer.

Interoperability Gaps Between Multi-Vendor Fleets

Warehouse operators increasingly source robots from multiple OEMs — one vendor for mobile transport, another for robotic arms, a third for sortation. Yet, no widely adopted open-fleet orchestration standard exists today. MassRobotics released the AMR Interoperability Standard 2.0 in 2024, but adoption remains voluntary [12]. Until fleet-agnostic control planes mature, operators face vendor lock-in risks that slow incremental automation purchases.

Cybersecurity Risks in Connected Robotic Operations

Each networked robot in a warehouse is a potential attack surface. A 2024 Claroty report identified over 1,200 vulnerabilities in industrial robotic firmware across 15 major OEMs [16]. Ransomware incidents targeting warehouse operations doubled between 2022 and 2024 in North America. Insurance premiums for robotic-intensive facilities have risen accordingly, creating a hidden cost layer that restrains adoption among risk-averse operators.


Warehouse Robotics Market Opportunities

Robotics-as-a-Service (RaaS) for Mid-Market Penetration

Capital-light subscription models are dissolving the upfront-cost barrier that has historically limited the Warehouse Robotics Market to enterprise buyers. Locus Robotics and 6 River Systems now offer per-unit-per-month pricing that converts capex into opex, targeting 3PL operators with fewer than 50,000 square feet of floor space.

Emerging-Market Warehouse Modernization

India's production-linked incentive scheme allocated USD 2.1 billion toward electronics and automotive manufacturing logistics between 2023 and 2025, directly funding warehouse automation projects [8]. Southeast Asian e-commerce gross merchandise value surpassed USD 230 billion in 2024, creating greenfield distribution-center demand that skips the brownfield integration penalty entirely.

Data Monetization Through Fleet Analytics

Every autonomous mobile robot generates approximately 1.5 terabytes of operational data per year — movement patterns, pick-error logs, congestion heat maps. Vendors that package these analytics into demand-forecasting and slotting-optimization SaaS products can unlock recurring revenue streams that the Warehouse Robotics Market has largely left untapped.

Cold-Chain and Pharmaceutical Automation

EU GDP (Good Distribution Practice) and FDA Drug Supply Chain Security Act mandates are tightening serialization and temperature-compliance requirements in pharmaceutical warehousing [11]. Robotic solutions that combine autonomous transport with integrated environmental monitoring represent a high-margin niche within the broader Warehouse Robotics Market.

Micro-Fulfillment Center Proliferation

Urban micro-fulfillment centers — typically 5,000 to 15,000 square feet embedded inside or adjacent to retail stores — require compact, high-density automation that traditional conveyor systems cannot deliver. Grocery chains such as Kroger, Carrefour, and Woolworths have collectively committed over USD 3 billion to micro-fulfillment buildouts through 2027, generating concentrated demand for cube-storage robotic systems [7].


Warehouse Robotics Market Future Outlook

AI-Native Fleet Orchestration

The next generation of warehouse management will replace rules-based routing with reinforcement-learning agents that continuously optimize task allocation across mixed robot fleets. By 2030, projects that 45% of large-scale distribution centers will deploy AI-native orchestration layers that reduce idle time by 30% or more [19]. Within the Warehouse Robotics Market, this shift will accelerate software's share of total spend from 25% today toward 35% by 2035.

Energy-Efficient Robotic Architectures

Lithium-iron-phosphate batteries and solid-state cells are extending robot uptime from 8 hours to 14+ hours per charge cycle, reducing the fleet size needed to maintain throughput [20]. Simultaneously, regenerative braking on heavy-payload AMRs is cutting per-unit energy consumption by 22%. The Warehouse Robotics Market will increasingly reward vendors that deliver TCO advantages through energy efficiency, particularly as ESG reporting frameworks require Scope 2 emissions disclosure from logistics operators.

Humanoid and Multi-Modal Robot Integration

General-purpose humanoid robots — from companies such as Figure AI, Agility Robotics, and Tesla Optimus — are targeting warehouse tasks that remain difficult for single-purpose machines: bin-diving, shelf-stocking, and exception handling [21]. While commercial-scale deployment is unlikely before 2029, pilot programs are already underway at BMW and Amazon facilities. The Warehouse Robotics Market could see humanoid platforms capture 5–8% of new installations by 2034.

Sustainability and Circular Supply-Chain Automation

Reverse logistics and product-refurbishment operations are emerging as a new automation frontier. The EU Circular Economy Action Plan mandates extended producer responsibility across electronics and textiles, requiring return-processing capabilities that manual operations struggle to scale [22]. Warehouse operators that embed robotic disassembly, inspection, and re-kitting into their facilities will capture value from a circular economy that the Ellen MacArthur Foundation estimates at USD 4.5 trillion by 2030.


Warehouse Robotics Market Segmentation

By Product Type

Segment Key Metric (2025) Primary Demand Driver
Industrial Robots 36.3% share Palletizing, depalletizing, heavy-goods handling
Sortation Systems USD 2.11 Billion High-throughput parcel and package sorting
Mobile Robots 19.4% CAGR (2026–2035) Flexible goods-to-person transport
Others (Drones, Cobots) USD 0.78 Billion Inventory scanning, collaborative picking


Industrial robots remain the backbone of the Warehouse Robotics Market by product type, embedded in palletizing lines and heavy-payload transfer stations where cycle-time consistency is paramount. These installations benefit from decades of proven reliability, and brownfield warehouses that already run six-axis arms tend to expand with the same architecture. Mobile robots, however, are reshaping greenfield facility design. Their ability to navigate dynamically without fixed infrastructure lets operators reconfigure floor plans seasonally — a decisive advantage for fashion and consumer-electronics distributors managing volatile demand curves.

By Function

Segment Key Metric (2025) Primary Demand Driver
Storage 41.0% share AS/RS and cube-storage system rollouts
Packaging USD 1.45 Billion Automated box-erecting and void-fill systems
Picking and Sorting 19.5% CAGR (2026–2035) SKU proliferation and error-rate reduction
Others (Loading, Inspection) 11.8% share Dock-to-stock and quality-control automation


Storage automation dominates the Warehouse Robotics Market by function because automated storage and retrieval systems deliver the highest density per square foot, a critical metric in land-constrained urban fulfillment centers. Picking and sorting, while smaller in current revenue, is growing faster as vision-guided robotic arms close the accuracy gap with human pickers on irregularly shaped items.

By Component

Segment Key Metric (2025) Primary Demand Driver
Hardware 75.0% share Robot chassis, arms, sensors, conveyors
Software 16.9% CAGR (2026–2035) Fleet orchestration, WES, analytics platforms
Support and Services USD 0.95 Billion Installation, maintenance, training


Hardware's dominance in the Warehouse Robotics Market reflects the capital-intensive nature of initial deployments. Yet software's growth trajectory tells the more interesting story: edge-enabled fleet-orchestration platforms are the fastest-growing component layer as operators pursue real-time optimization that lifts asset utilization beyond 85% [2].

By End-User Industry

Segment Key Metric (2025) Primary Demand Driver
Retail and E-Commerce 30.4% share Order-fulfillment speed and accuracy
Automotive 19.2% CAGR (2026–2035) Just-in-time parts kitting and sequencing
Food and Beverage USD 1.32 Billion Cold-chain handling and perishable routing
Electrical and Electronics 17.0% CAGR (2026–2035) High-value component tracking
Pharmaceutical USD 0.71 Billion Serialization and temperature compliance
3PL 18.1% CAGR (2026–2035) Multi-client warehouse flexibility
Others 7.2% share Textiles, chemicals, building materials


Retail and e-commerce anchors the Warehouse Robotics Market by end user, driven by fulfillment windows that have compressed from two days to same-day in major metros. Automotive is the fastest-growing vertical as OEMs and Tier-1 suppliers automate sequencing lines that feed mixed-model assembly plants, reducing buffer-stock requirements by up to 40% [10].


Regional Market Share Analysis

Region Key Metric (2025) Primary Investment Themes
Asia-Pacific 42.5% share Manufacturing logistics, e-commerce DC expansion, government subsidies
North America USD 2.61 Billion Retailer fulfillment automation, 3PL fleet upgrades, labor substitution
Europe 22.0% share Cold-chain compliance, brownfield retrofits, Industry 4.0 programs
South America 5.0% share E-commerce growth in Brazil, greenfield DC builds
Middle East & Africa USD 0.45 Billion Free-zone logistics hubs, oil-to-digital diversification
Total USD 10.02 Billion

The regional structure of the Warehouse Robotics Market reflects the concentration of e-commerce fulfillment infrastructure and manufacturing logistics networks. Asia-Pacific leads both in absolute size and growth velocity, while North America and Europe compete closely for second position.


North America

Country Key Metric Key Driver
United States 78% of regional share Retailer capex in fulfillment automation
Canada 14.2% CAGR (2026–2035) Grocery and pharmaceutical DC modernization
Mexico USD 0.13 Billion (2025) Nearshoring-driven logistics expansion


The United States dominates North America's Warehouse Robotics Market contribution, with Amazon, Walmart, and Target collectively operating over 2,500 automated or semi-automated fulfillment nodes as of 2025 [7]. Canada is investing heavily in cold-chain pharmaceutical robotics following Health Canada's updated GMP automation guidance. At the same time, Mexico benefits from nearshoring trends that are pulling manufacturing logistics south of the U.S. border [8].

Europe

Country Key Metric Key Driver
Germany 28% of regional share Automotive parts logistics and Industry 4.0
United Kingdom 15.8% CAGR (2026–2035) Grocery and retail e-commerce fulfillment
France USD 0.27 Billion (2025) La Poste and Carrefour DC automation
Italy 12.5% CAGR (2026–2035) Food and beverage sector automation
Spain USD 0.16 Billion (2025) Third-party logistics hub build-outs
Nordic Countries 16.0% CAGR (2026–2035) High labor costs are driving early adoption
Russia USD 0.09 Billion (2025) Domestic manufacturing self-sufficiency push
Rest of Europe 11% of regional share Mixed adoption across smaller economies


Germany anchors European demand within the Warehouse Robotics Market, with its Plattform Industrie 4.0 initiative channeling over EUR 1.5 billion toward smart-factory and logistics digitization between 2023 and 2026 [9]. The United Kingdom has seen accelerated adoption post-Brexit as labor mobility restrictions intensified warehouse staffing challenges, particularly in grocery fulfillment.

Asia-Pacific

Country Key Metric Key Driver
China 55% of regional share Government "Made in China 2025" robotics targets
India 20.3% CAGR (2026–2035) E-commerce and production-linked incentives
Japan USD 0.58 Billion (2025) An aging workforce and advanced manufacturing
South Korea 17.5% CAGR (2026–2035) Semiconductor and electronics logistics
ASEAN USD 0.39 Billion (2025) Greenfield DC investments in Vietnam, Thailand
Rest of Asia-Pacific 13.8% CAGR (2026–2035) Emerging digital commerce infrastructure


China's 44% year-over-year increase in new warehouse robot installations during 2024 cemented Asia-Pacific's dominance in the Warehouse Robotics Market [1]. India is the region's fastest-growing country market, propelled by Flipkart and Reliance Retail building automated mega-distribution centers across six states. Japan's demographic trajectory — with over 28% of its population above 65 — creates structural demand for automation in logistics and manufacturing warehousing [8].

South America

Country Key Metric Key Driver
Brazil 62% of regional share Mercado Libre and Magazine Luiza DC automation
Argentina 13.5% CAGR (2026–2035) Agricultural export logistics modernization
Rest of South America USD 0.07 Billion (2025) Early-stage adoption in Chile, Colombia


Brazil leads South America's Warehouse Robotics Market contribution as Mercado Libre invested over USD 900 million in logistics infrastructure during 2024, with robotic sortation a growing share of that spend [14]. Argentina and Chile remain early-stage adopters, though rising e-commerce penetration rates are building the demand base for initial deployments.

Middle East & Africa

Country Key Metric Key Driver
Saudi Arabia 35% of regional share Vision 2030 logistics hub ambitions
UAE 17.2% CAGR (2026–2035) Free-zone warehouse automation
South Africa USD 0.05 Billion (2025) Retail chain DC modernization
Egypt 14.0% CAGR (2026–2035) Suez Canal Economic Zone logistics
Rest of MEA 18% of regional share Scattered early-stage projects


Saudi Arabia's Vision 2030 program is channeling USD 1.3 billion into logistics infrastructure, including automated bonded warehouses at NEOM and the Riyadh Logistics Hub [18]. The UAE's Jebel Ali and Khalifa Industrial Zone free-trade areas are attracting robotics-equipped 3PL operators targeting cross-border e-commerce flows across the Gulf Cooperation Council.


Warehouse Robotics Market By Region, 2025-2035

Competitive Benchmarking

The Warehouse Robotics Market is moderately concentrated, with the top five vendors contributing an estimated 35-42% of global revenues. The competitive arena is wide and deep, with traditional industrial-robot OEMs, material-handling conglomerates and venture-backed AMR specialists, with M&A the dominant means of capability consolidation. The Herfindahl-Hirschman Index is between 800 and 1,200, reflecting a fairly fragmented structure.

Company Est. Revenue Share Range Key Offerings for Warehouse Robotics Market Strategic Positioning
KUKA AG ~7–10% Six-axis palletizing arms, mobile platforms Full-stack industrial automation, Midea-backed scale
Fanuc Corporation ~6–9% Picking robots, vision-integrated arms Reliability-focused, high-uptime manufacturing pedigree
ABB Ltd ~5–8% FlexPicker, autonomous mobile robots Broad industrial portfolio, strong European channel
Daifuku Co., Ltd. ~5–8% AS/RS, conveyor systems, sorting solutions Vertically integrated material-handling leader
Yaskawa Electric ~4–7% Motoman arms, collaborative robot lines Cost-competitive servo-motor integration advantage
Dematic (KION Group) ~4–7% Goods-to-person systems, shuttle AS/RS End-to-end intralogistics design and integration
Honeywell Intelligrated ~3–6% Sortation, robotic depalletization, WES Connected-enterprise software tie-in
Zebra Technologies ~3–5% Fetch AMRs, 3-D vision (Photoneo acquisition) Vision-plus-mobility convergence strategy
Locus Robotics ~2–4% Collaborative AMRs, RaaS subscription model Mid-market 3PL penetration via RaaS
Geek+ ~2–4% Goods-to-person AMRs, sorting bots China-origin scale with global expansion

Recent News & Developments

  • ABB Ltd (August 2023): Introduced the Visual SLAM navigation module for its AMR fleet, eliminating the need for fixed infrastructure markers and reducing deployment timelines by 40% [12].
  • MassRobotics (May 2023): Released AMR Interoperability Standard 2.0, establishing communication protocols that allow multi-vendor robot fleets to operate under a single orchestration layer [12].

Warehouse Robotics Market Report Scope

Parameter Detail
Market Scope Global Warehouse Robotics Market covering hardware, software, and services
Study Period 2021–2035
CAGR (Forecast Period) 16.1% (2026–2035)
Market Size (2025) USD 10.02 Billion
Market Size (2035) USD 44.58 Billion
Fastest Growing Segment Mobile Robots (by type); Picking and Sorting (by function)
Companies Profiled 10 (KUKA, Fanuc, ABB, Daifuku, Yaskawa, Dematic, Honeywell, Zebra, Locus, Geek+)
Valuation Currency USD Billion


FAQs

What is the typical payback period for a warehouse robotics deployment?
Most AMR deployments in facilities processing over 10,000 orders per day achieve payback within 14–22 months, depending on labor-cost geography and shift count [15]. Smaller facilities often see longer payback unless they adopt RaaS subscription models.
How does the Warehouse Robotics Market differentiate between AMRs and traditional AGVs?
AMRs navigate dynamically using onboard sensors and SLAM algorithms, while AGVs follow fixed paths via magnetic tape or wires. AMRs command a price premium of 30–50% but offer faster redeployment [12].
Which Warehouse Robotics Market segments face the highest cybersecurity exposure?
Cloud-connected fleet-orchestration software carries the greatest risk surface, as centralized control planes can halt entire operations if compromised [16]. Hardware-only installations with air-gapped controllers face minimal exposure.
What interoperability standards should buyers evaluate before procurement?
The MassRobotics AMR Interoperability Standard 2.0 and VDA 5050 (Europe) are the two leading protocols enabling multi-vendor fleet coordination [12]. Buyers should confirm vendor compliance before committing to mixed-fleet architectures.
How does the Warehouse Robotics Market address seasonal demand variability?
RaaS models let operators scale robot counts up or down monthly, aligning automation capacity with peak seasons like Black Friday or Chinese Singles' Day [6]. This flexibility is a primary driver of 3PL adoption.
What role do digital twins play in warehouse robotics deployment?
Digital twins simulate robot traffic flow, pick-path optimization, and throughput before physical installation, reducing commissioning time by up to 35% [19]. They are becoming a standard pre-deployment step for facilities exceeding 200,000 square feet.
How will the Warehouse Robotics Market be affected by tariff policies on Chinese-made robots?
U.S. Section 301 tariffs currently add 25% to Chinese-origin industrial robot imports, incentivizing sourcing shifts toward Japanese, European, and domestic OEMs [4]. Geek+ and other China-based vendors are mitigating this through regional manufacturing in Southeast Asia.    
Author
Author
Author Profile
Nirmit Biswas LinkedIn
Senior Research Analyst
With 5+ years of expertise in Market Intelligence and Strategic Research, Nirmit Biswas specializes in ICT, Semiconductors, and BFSI. Backed by an MBA in Financial Services and a Computer Science foundation, Nirmit blends technical depth with business acumen. He has successfully led 100+ projects for global enterprises and startups, including Amazon, Cisco, L&T and Huawei, delivering market estimations, competitive benchmarking, and GTM strategies. His focus lies in transforming complex data into clear, actionable insights that drive growth, innovation, and investment decisions. Recognized for bridging engineering innovation with executive strategy, Nirmit helps businesses navigate dynamic markets with confidence.
Co-Author
Co-Author Profile
Aarti Dhapte LinkedIn
AVP - Research
A consulting professional focused on helping businesses navigate complex markets through structured research and strategic insights. I partner with clients to solve high-impact business problems across market entry strategy, competitive intelligence, and opportunity assessment. Over the course of my experience, I have led and contributed to 100+ market research and consulting engagements, delivering insights across multiple industries and geographies, and supporting strategic decisions linked to $500M+ market opportunities. My core expertise lies in building robust market sizing, forecasting, and commercial models (top-down and bottom-up), alongside deep-dive competitive and industry analysis. I have played a key role in shaping go-to-market strategies, investment cases, and growth roadmaps, enabling clients to make confident, data-backed decisions in dynamic markets.

Research Approach


Secondary Research

The secondary research process involved comprehensive analysis of regulatory databases, industry standards repositories, peer-reviewed engineering journals, automation publications, and authoritative logistics organizations. Key sources included the US Occupational Safety and Health Administration (OSHA), European Agency for Safety and Health at Work (EU-OSHA), National Institute of Standards and Technology (NIST), American National Standards Institute (ANSI), International Organization for Standardization (ISO 10218 for industrial robots), International Federation of Robotics (IFR), Robotics Industries Association (RIA), Material Handling Institute (MHI), Bureau of Labor Statistics (BLS) Warehouse and Storage Employment Data, EU Eurostat Industrial Production Statistics, IEEE Xplore Digital Library, MIT Technology Review, Logistics Management Magazine, ARC Advisory Group, and national logistics ministry reports from key markets. These sources were used to collect automation adoption statistics, safety compliance data, warehouse automation deployment figures, labor cost trends, and market landscape analysis for mobile robots, SCARA systems, articulated robotic arms, and warehouse management software technologies.


Primary Research

Qualitative and quantitative insights were obtained by interviewing supply-side and demand-side stakeholders during the primary research process. The supply-side sources consisted of CEOs, CTOs, VPs of Engineering, leaders of Product Development, and commercial directors from warehouse robotics manufacturers, autonomous mobile robot (AMR) developers, and warehouse management software providers. Chief Supply Chain Officers, Vice Presidents of Warehouse Operations, logistics directors, and procurement leads from e-commerce fulfillment centers, third-party logistics (3PL) providers, retail distribution centers, and manufacturing warehouses constituted demand-side sources. Market segmentation was validated across robot types and software systems, product development timelines were confirmed, and insights on automation adoption patterns, total cost of ownership (TCO) dynamics, and integration challenges with legacy warehouse infrastructure were gathered using primary research.

Primary Respondent Breakdown:

By Designation: C-level Primaries (32%), Director Level (31%), Others (37%)

By Region: North America (40%), Europe (25%), Asia-Pacific (28%), Rest of World (7%)


Market Size Estimation

Global market valuation was derived through revenue mapping and unit deployment analysis. The methodology included:

Identification of 50+ key robotics manufacturers and software providers across North America, Europe, Asia-Pacific, and Latin America

Product mapping across mobile robots (AMRs/AGVs), SCARA robots, articulated robots, cylindrical robots, parallel robots, Cartesian robots, and software categories (WMS, WCS, WES)

Analysis of reported and modeled annual revenues specific to warehouse robotics and automation portfolios

Coverage of manufacturers representing 75-80% of global market share in 2024

Extrapolation using bottom-up (robot deployment volume × ASP by country/region) and top-down (manufacturer revenue validation) approaches to derive segment-specific valuations for hardware and software components

Download Free Sample

Kindly complete the form below to receive a free sample of this Report

Download PDF ×

We do not share your information with anyone. However, we may send you emails based on your report interest from time to time. You may contact us at any time to opt-out.

















