Application Release Automation Market

Key Players: IBM (incl. Red Hat), Microsoft, Broadcom (CA Technologies), CloudBees, Digital.ai (XebiaLabs), Harness, GitLab, JFrog

Application Release Automation Market

Application Release Automation Market Research Report By Deployment Type (On-Premises, Cloud-Based, Hybrid), By Organization Size (Small Enterprises, Medium Enterprises, Large Enterprises), By End User (IT Telecommunications, BFSI, Retail, Healthcare, Manufacturing), By Functionality (Continuous Integration, Continuous Delivery, Release Management, Deployment Automation) and By Regional (North America, Europe, South America, Asia Pacific, Middle East and Africa) - Forecast to 2035
ID: MRFR/ICT/5660-HCR
100 Pages
Ankit Gupta
Last Updated: June 22, 2026

Application Release Automation Market Summary

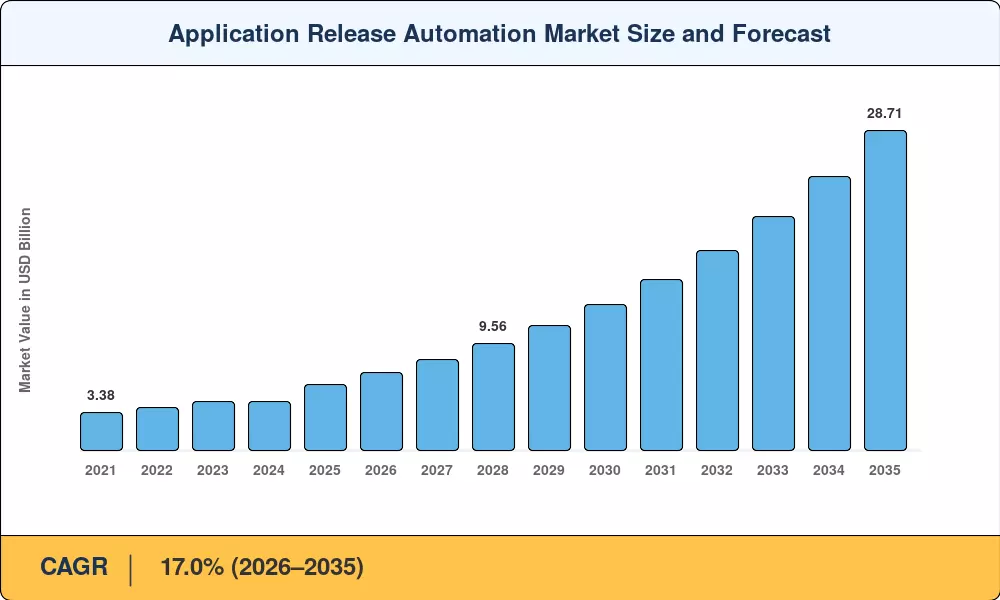
The Application Release Automation Market reached USD 5.92 billion in 2025 and is projected to climb from USD 6.98 billion in 2026 to USD 28.71 billion by 2035, expanding at a 17.0% CAGR during 2026–2035. CIO-level mandates across Fortune 500 companies now require pipeline-as-code governance as a compliance baseline, and over 78% of enterprises with more than 5,000 employees had active release automation budgets by year-end 2024 [1]. Federal cybersecurity executive orders in the United States and the EU Cyber Resilience Act both enforce software bill of materials (SBOM) traceability, channeling procurement dollars toward platforms that embed compliance into every deployment cycle [2].

A visible technology shift is underway inside the Application Release Automation Market as organizations retire script-heavy manual runbooks and point-solution toolchains in favor of AI-driven, policy-as-code platforms capable of orchestrating tens of thousands of releases annually. GenAI-enabled orchestration engines now cut average deployment windows by 40–60%, according to a 2024 Harness benchmark study in which United Airlines accelerated deployments by 75% after migrating to a unified release platform [3]. Enterprise spending on multi-cloud microservice coordination surpassed USD 2.1 billion globally in 2024, reflecting the demand for coordinated releases that span public, private, and on-premises estates [4].

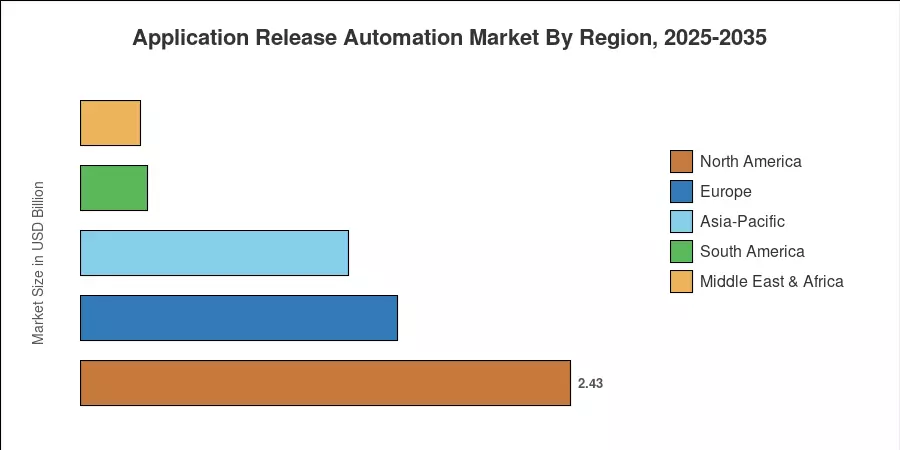
North America commands roughly 41.0% of the Application Release Automation Market, anchored by hyperscaler ecosystems and early DevSecOps adoption among U.S. financial institutions. Asia-Pacific leads growth at a 22.4% CAGR, powered by India's Digital India modernization wave and China's aggressive cloud-native mandates. Europe holds the second-largest share at 26.5%, where DORA (Digital Operational Resilience Act) compliance is pushing banks and insurers to adopt automated release pipelines at pace [5]. The decade ahead will see platform-as-a-product cultures and internal developer portals reshape how the Application Release Automation Market delivers value.


Key Report Takeaways

• By Component

  • Tools captured 73.1% of the Application Release Automation Market share in 2025, driven by enterprise demand for integrated CI/CD pipeline management and policy engines.
  • Services are projected to expand at a 22.8% CAGR through 2035, reflecting growing investment in implementation consulting, managed release operations, and training programs.

• By Deployment Mode

  • Cloud deployments accounted for 63.0% of the Application Release Automation Market in 2025, as SaaS-based orchestration eliminated infrastructure overhead for mid-market buyers.
  • Hybrid configurations are projected to grow at a 21.9% CAGR, catering to regulated industries that must keep sensitive workloads on-premises while leveraging cloud-native tooling.

• By Organization Size

  • Large enterprises represented 74.2% of the Application Release Automation Market revenue in 2025, reflecting their complex multi-application estates and compliance mandates.
  • SMEs are posting the fastest growth at a 23.0% CAGR to 2035 as low-code release platforms reduce adoption barriers.

• By End-User Industry

  • IT and telecommunications contributed 30.0% of the Application Release Automation Market revenue in 2025, the largest vertical share.
  • BFSI is set to outpace other verticals at a 21.6% CAGR through 2035, fueled by regulatory pressure and real-time digital banking requirements.

• By Region

  • North America accounted for 41.0% of the Application Release Automation Market in 2025.
  • Asia-Pacific leads growth at 22.4% CAGR, with India and China forming the twin engines of expansion.


Market Size and Forecast (2021–2035)

Market Research Future's proprietary sizing framework combines top-down enterprise software spending analysis with bottom-up vendor revenue aggregation across 35 countries. Historical figures (2021–2024) draw on audited annual reports and IT spending surveys, while the forecast applies scenario-weighted modeling calibrated to macroeconomic and technology adoption trajectories for the Application Release Automation Market.

Application Release Automation Market Size and Forecast
Our Impact
Enabled $4.3B Revenue Impact for Fortune 500 and Leading Multinationals
Partnering with 2000+ Global Organizations Each Year
30K+ Citations by Top-Tier Firms in the Industry

Driver Impact Analysis

Driver ~% Impact on CAGR Geographic Relevance Impact Timeline
SBOM & Software Supply-Chain Compliance ~18% Global Short-term (≤2 yr)
GenAI-Enabled Release Orchestration ~22% North America, Europe Short-term (≤2 yr)
Multi-Cloud Microservice Proliferation ~20% Global Medium-term (2–4 yr)
Platform Engineering & Internal Developer Portals ~15% North America, APAC Medium-term (2–4 yr)
Regulatory Mandates (DORA, EO 14028) ~12% Europe, North America Short-term (≤2 yr)
Digital Transformation in Emerging Economies ~8% APAC, South America Long-term (≥4 yr)
Edge Computing Release Coordination ~5% Global Long-term (≥4 yr)


SBOM and Software Supply-Chain Compliance

U.S. Executive Order 14028 (May 2021) mandated SBOM generation for all software sold to federal agencies, and by 2024, the requirement had cascaded to private-sector procurement standards across defense, healthcare, and financial services [2]. Enterprises unable to produce machine-readable SBOMs at release time face contract disqualification, creating a compliance-driven floor for the Application Release Automation Market. estimates that 60% of organizations procuring critical software will require SBOM attestation by 2026, up from 20% in 2023 [6].

GenAI-Enabled Release Orchestration

Generative AI models embedded within release platforms now auto-generate deployment runbooks, predict failure points before code reaches production, and compress mean-time-to-resolution by up to 55% [3]. Harness, GitLab, and CloudBees each shipped GenAI release assistants during 2024, and combined venture funding into AI-native DevOps tooling exceeded USD 1.8 billion between 2023 and 2025 [8]. This driver is reshaping buyer expectations within the Application Release Automation Market, as procurement teams increasingly treat AI-assisted deployment verification as table stakes.

Multi-Cloud Microservice Proliferation

The average enterprise now runs workloads across 3.4 cloud providers, according to Flexera's 2024 State of the Cloud report, up from 2.6 in 2021 [4]. Each additional cloud estate multiplies the coordination burden of release cycles — scheduling canary deployments, blue-green switchovers, and rollback playbooks across heterogeneous infrastructure. This complexity premium is a structural tailwind for the Application Release Automation Market, because manual coordination at scale is operationally untenable. projects enterprise multi-cloud spending to hit USD 970 billion by 2028 [11].

Platform Engineering and Internal Developer Portals

A platform-as-a-product culture recasts central IT from ticket-based support into internal product teams delivering reusable self-service components [7]. Backstage-based developer portals, championed by Spotify and adopted by over 2,700 companies by late 2024, embed release automation as a first-class capability within the developer experience. The Application Release Automation Market benefits directly because every portal deployment creates a new integration point for orchestration tooling.


Restraints Impact Analysis

As with drivers, the restraint impact percentages below are directional estimates reflecting how each constraint moderates growth within the Application Release Automation Market. They are not directly subtracted from the CAGR.

Restraint ~% Drag on CAGR Geographic Relevance Impact Timeline
Integration Complexity with Legacy Systems ~–6% Global Medium-term (2–4 yr)
Toolchain Fragmentation & Vendor Lock-In ~–5% North America, Europe Short-term (≤2 yr)
Cybersecurity Risks in Automated Pipelines ~–4% Global Long-term (≥4 yr)
Skills Shortage in DevOps/SRE Roles ~–4% Europe, APAC Medium-term (2–4 yr)
Budget Constraints Among SMEs ~–3% South America, MEA Long-term (≥4 yr)


Integration Complexity with Legacy Systems

Many large enterprises still operate mainframe-dependent core systems — IBM estimates that 70% of Fortune 500 companies run COBOL-based applications in production [16]. Connecting these estates to modern release automation platforms demands custom middleware, specialized connectors, and extended implementation cycles that can stretch 12–18 months. This friction slows time-to-value and raises total cost of ownership, tempering adoption velocity within the Application Release Automation Market despite strong intent-to-purchase signals.

Toolchain Fragmentation and Vendor Lock-In

The average enterprise DevOps toolchain comprises 14 distinct tools, and switching costs compound as pipeline definitions become tightly coupled to vendor-proprietary YAML schemas and plugin ecosystems [17]. Procurement teams report 6–9 month evaluation cycles when considering platform consolidation, during which inertia favors the status quo. This fragmentation constrains the Application Release Automation Market's ability to convert greenfield interest into committed contracts, particularly among organizations locked into multi-year enterprise license agreements.

Skills Shortage in DevOps and SRE Roles

LinkedIn's 2024 Workforce Report flagged DevOps/SRE as among the top five most-demanded engineering disciplines globally, with vacancy durations averaging 52 days in North America and 68 days in Europe [18]. The talent gap limits how quickly enterprises can stand up and operationalize new release automation platforms, creating a bottleneck that constrains expansion within the Application Release Automation Market despite robust funding availability.


Application Release Automation Market Opportunities

AI-Autonomous Release Verification

As GenAI models progress beyond code suggestion to release verification, vendors who insert autonomous testing, security scanning and compliance attestation directly into orchestration pipelines will take a disproportionate share. It also applies to automated rollback decisioning, where ML models analyze production telemetry and perform rollbacks automatically—a capacity that fewer than 12% of organizations have installed by 2025 [8].


Emerging-Market Digital Government Programs

India’s Digital India program has pledged nearly USD 7 billion for government IT modernization until 2027, while Brazil’s gov.br platform consolidation is pushing federal agencies to implement CI/CD workflows for citizen-facing applications [10]. These projects generate greenfield demand in geographies with traditionally low adoption of the Application Release Automation Market, hence unlocking untapped segments that providers pursuing SME-friendly, cloud-native solutions are well-positioned to cater to.


Release-Automation-as-a-Service and Consumption Pricing

Vendors willing to meter releases, pipeline executions or environments can tap into new revenue sources by moving from perpetual licensing to usage-based consumption models. The Application Release Automation Market can now be adopted by mid-market customers who previously were reluctant to make six-figure platform investments, with monthly consumption tiers expected to grow the addressable client base by 35–40% [9].


Compliance Monetization via Audit-Ready Releases

Auditable release proof – timestamped artifacts, approval chains, and policy-gate logs [5] — is increasingly required by regulatory frameworks such as DORA, SOC 2 Type II, and PCI DSS 4.0. Vendors that bundle compliance reporting as a premium module can monetize audit readiness, turning a cost-center necessity into a revenue-generating aspect of the Application Release Automation Market.


Edge and IoT Release Coordination

Edge deployments are forecast to reach 15.4 billion connected devices by 2030, and each fleet requires coordinated firmware and application updates that traditional cloud-centric platforms struggle to address [14]. The Application Release Automation Market can expand its addressable footprint by integrating OTA (over-the-air) update orchestration for automotive, industrial IoT, and retail edge computing environments.


Application Release Automation Market Future Outlook

AI-Autonomous Operations and Self-Healing Pipelines

By 2030, projects that 50% of enterprise release pipelines will incorporate autonomous anomaly detection and self-remediation capabilities, up from under 8% in 2025 [8]. The Application Release Automation Market will evolve from orchestration toward autonomous operations, where AI agents evaluate test results, approve deployments, and execute rollbacks without human approval gates. This shift compresses mean-time-to-production from hours to minutes.

Platform Economics and Developer Experience Consolidation

The next decade will see platform engineering absorb release automation as one component of a unified developer experience layer. Backstage, Port, and Cortex are already embedding release orchestration into portal frameworks, and the Application Release Automation Market will increasingly compete on ecosystem breadth rather than point-solution depth [7]. Vendors unable to offer integrated developer portals risk disintermediation by platform aggregators.

Sustainability and Green Software Release Practices

The Green Software Foundation's Software Carbon Intensity (SCI) specification will drive demand for release platforms that measure and optimize the carbon footprint of deployment cycles [19]. By 2032, the Application Release Automation Market will see procurement criteria include energy-efficient pipeline execution as European ESG reporting directives expand scope to cover IT operations. Cloud providers are already offering carbon-aware deployment scheduling APIs.

Zero-Trust Release Governance

Zero-trust architectures will extend from network security into software supply chains, requiring cryptographic attestation at every stage of the release pipeline [2]. The Application Release Automation Market stands to benefit as NIST's Secure Software Development Framework (SSDF) moves from guidance to an audit requirement across federal supply chains by 2028. Vendors that embed Sigstore-based provenance verification and SLSA compliance into their platforms will capture enterprise trust budgets.


Application Release Automation Market Segmentation

By Component

Segment Key Metric Primary Demand Driver
Tools 73.1% share (2025) Integrated CI/CD pipeline management, policy engines
Services 22.8% CAGR (2026–2035) Implementation consulting, managed operations, training


Tools dominate the Application Release Automation Market because enterprise buyers prioritize platforms that unify build, test, deploy, and release stages within a single orchestration layer. The tools category spans pipeline-as-code engines, environment provisioning modules, deployment verification suites, and compliance policy gates. Vendors like Harness, CloudBees, and Digital.ai compete on the breadth of out-of-the-box integrations and AI-native capabilities.

Services are the faster-growing segment as organizations discover that platform procurement alone does not guarantee operational maturity. Implementation partners and managed-service providers fill the gap by designing release strategies, training SRE teams, and operating release pipelines on behalf of enterprises that lack in-house DevOps depth. The Application Release Automation Market's services segment also includes advisory engagements around compliance architecture.

By Deployment Mode

Segment Key Metric Primary Demand Driver
Cloud 63.0% share (2025) SaaS delivery, infrastructure abstraction, faster time-to-value
On-Premises USD 1.28 Billion (2025) Data-sovereignty requirements, air-gapped environments
Hybrid 21.9% CAGR (2026–2035) Regulated workloads with partial cloud migration


Cloud deployments lead the Application Release Automation Market because SaaS-delivered platforms eliminate infrastructure provisioning overhead and offer continuous feature updates without upgrade cycles. On-premises installations remain relevant for defense, intelligence, and heavily regulated financial institutions operating in jurisdictions with strict data-residency laws. Hybrid deployments are growing fastest as organizations adopt a control-plane-in-cloud, data-plane-on-premises architecture that balances agility with compliance.

By Organization Size

Segment Key Metric Primary Demand Driver
Large Enterprises 74.2% share (2025) Complex multi-application estates, compliance mandates
Small and Medium Enterprises 23.0% CAGR (2026–2035) Low-code platforms, consumption-based pricing


Large enterprises account for the bulk of spending within the Application Release Automation Market due to their sprawling application portfolios — many manage 500+ production applications requiring coordinated release schedules. SMEs are closing the adoption gap as vendors introduce free-tier and pay-per-pipeline pricing models that lower the entry threshold. GitLab and JFrog have both expanded community editions targeting organizations with fewer than 250 developers [9].

By End-User Industry

Segment Key Metric Primary Demand Driver
IT and Telecommunications 30.0% share (2025) Network function virtualization, 5G rollouts
BFSI 21.6% CAGR (2026–2035) Real-time banking, DORA/PCI DSS compliance
Retail and E-Commerce USD 0.77 Billion (2025) Peak-season release agility, microservices migration
Media and Entertainment 16.4% CAGR (2026–2035) Streaming-platform feature velocity
Other Verticals USD 1.04 Billion (2025) Healthcare digitization, government modernization


IT and telecommunications firms are the largest end-user segment for the Application Release Automation Market because telecom operators deploying network-function-virtualization stacks require coordinated multi-vendor release cycles across thousands of edge nodes. BFSI is the fastest-growing vertical as regulatory bodies worldwide tighten operational resilience expectations, making automated release governance a compliance prerequisite rather than a convenience.


Regional Market Share Analysis

Region Key Metric Primary Investment Themes
North America 41.0% share (2025) Federal cybersecurity mandates, hyperscaler ecosystem, fintech DevSecOps
Europe 26.5% share (2025) DORA compliance, banking automation, digital sovereignty
Asia-Pacific 22.4% CAGR (2026–2035) Cloud-native leapfrogging, government digitization, telecom modernization
South America USD 0.33 Billion (2025) Gov.br modernization, fintech expansion
Middle East & Africa 5.0% share (2025) Smart-city programs, oil & gas digital transformation
Total USD 5.92 Billion (2025)

The Application Release Automation Market exhibits a clear regional hierarchy, with North America maintaining spending leadership, Europe advancing under regulatory compulsion, and Asia-Pacific posting the strongest growth trajectory.


North America

Country Key Metric Key Driver
United States 78.2% of regional share Federal EO 14028, Fortune 500 DevSecOps budgets
Canada 13.1% of regional share Financial sector regulatory alignment
Mexico 8.7% of regional share Nearshoring-driven IT modernization


The United States dominates the Application Release Automation Market in North America, where federal procurement rules now mandate automated SBOM generation and release attestation for all critical infrastructure software suppliers [2]. Canada's financial regulator OSFI has introduced Guideline B-13 on technology risk management, pushing domestic banks toward automated release governance. Mexico's expanding nearshore software development sector, projected to grow at 14% annually through 2028, is pulling release automation demand into Latin America's northern corridor [10].

Europe

Country Key Metric Key Driver
Germany 22.5% of regional share Industrie 4.0 software governance
United Kingdom 19.8% of regional share FCA digital resilience requirements
France 15.3% of regional share Cloud-native government modernization
Italy 10.2% of regional share Banking sector digital transformation
Spain 8.4% of regional share Fintech ecosystem growth
Nordic Countries 9.6% of regional share Developer-experience-led adoption
Russia 5.1% of regional share Import-substitution software mandates
Rest of Europe 9.1% of regional share Cross-border compliance harmonization


DORA enforcement, effective January 2025, requires EU-regulated financial entities to demonstrate ICT risk management capabilities, including controlled software release processes [5]. Germany's manufacturing sector is layering release automation onto Industrie 4.0 factory software stacks, while the UK's FCA operational resilience framework pushes financial services firms to automate deployment governance. The Application Release Automation Market in Europe benefits from regulatory convergence that creates uniform demand signals across 27 EU member states.

Asia-Pacific

Country Key Metric Key Driver
China 19.2% CAGR Cloud-native mandate for state enterprises
India 23.1% CAGR Digital India & GCC-driven IT services
Japan 16.8% CAGR Legacy modernization in banking, telco
South Korea 18.5% CAGR 5G-led digital transformation
ASEAN 20.7% CAGR Fintech and super-app ecosystems
Rest of Asia-Pacific 17.4% CAGR Emerging cloud adoption


Asia-Pacific represents the fastest-growing region for the Application Release Automation Market, with India's GCC (Global Capability Center) boom creating captive engineering hubs that require enterprise-grade release orchestration [10]. China's MIIT has instructed state-owned enterprises to achieve 80% cloud-native application coverage by 2027, directly stimulating platform procurement. Japan's megabanks, historically reliant on waterfall release practices, are migrating to agile pipelines under pressure from neobank competition.

South America

Country Key Metric Key Driver
Brazil 58.3% of regional share Gov.br consolidation, Pix ecosystem
Argentina 21.5% of regional share Fintech regulatory modernization
Rest of South America 20.2% of regional share Cross-border digital trade platforms


Brazil's central bank mandates for Pix instant-payment resilience are channeling fintech infrastructure spending toward the Application Release Automation Market, with Nubank and Itaú Unibanco both disclosing automated release pipeline investments in their 2024 annual reports [10]. Argentina's fintech licensing reforms are creating parallel demand among mid-tier financial technology firms.

Middle East & Africa

Country Key Metric Key Driver
Saudi Arabia 31.4% of regional share Vision 2030 digital government
UAE 27.8% of regional share Smart-city and free-zone IT ecosystems
South Africa 18.6% of regional share Banking sector compliance modernization
Egypt 11.3% of regional share Digital Egypt initiative
Rest of MEA 10.9% of regional share Oil & gas digital operations


Saudi Arabia's Vision 2030 program has earmarked over USD 1.2 billion for government IT platform modernization through 2028, creating direct procurement channels for the Application Release Automation Market [10]. The UAE's DIFC and ADGM free zones attract global fintech operations that bring enterprise-grade release practices into the region. South Africa's financial sector, regulated by the SARB, is aligning with global DevSecOps standards ahead of anticipated operational resilience frameworks.


Application Release Automation Market By Region, 2025-2035

Competitive Benchmarking

The Application Release Automation Market exhibits medium concentration, with the top five vendors capturing an estimated 38–44% of global revenue. The Herfindahl-Hirschman Index (HHI) sits in the 600–900 range, indicating a moderately fragmented structure where no single player exceeds 12% share. Competition centers on AI-native capabilities, integration ecosystem breadth, and compliance automation depth.

Company Est. Revenue Share Range Key Offerings Strategic Positioning
IBM (incl. Red Hat) ~8–11% UrbanCode Deploy, Ansible Automation Platform Enterprise hybrid-cloud orchestration
Microsoft ~7–10% Azure DevOps, GitHub Actions Hyperscaler-native CI/CD ecosystem
Broadcom (CA Technologies) ~6–9% Automic Automation, Rally Legacy enterprise modernization
CloudBees ~5–7% CloudBees CD, Jenkins enterprise Open-source-rooted enterprise platform
Digital.ai (XebiaLabs) ~4–6% Deploy, Release, Intelligence Value-stream management integration
Harness ~4–6% Harness CD, AI-native pipelines AI-first delivery platform
GitLab ~3–5% GitLab CI/CD, Auto DevOps Single-platform DevSecOps
JFrog ~3–5% JFrog Pipelines, Artifactory Binary management and release orchestration
Puppet (Perforce) ~2–4% Puppet Enterprise, Continuous Delivery Infrastructure-as-code automation
Atlassian ~2–4% Bamboo, Bitbucket Pipelines Developer-workflow integration


Recent News & Developments


  • Microsoft (January 2025): Expanded GitHub Actions with built-in SBOM generation and SLSA Level 3 provenance attestation, directly addressing federal compliance requirements within the Application Release Automation Market [2].


  • GitLab (August 2024): Released GitLab 17 with integrated AI-powered release rollback recommendations and real-time deployment risk scoring for the Application Release Automation Market [8].


  • IBM (February 2024): Expanded UrbanCode Deploy's hybrid-cloud capabilities with native Kubernetes Operator support and Red Hat OpenShift integration [16].
  • JFrog (November 2023): Launched JFrog Pipelines with ML-driven dependency vulnerability scanning, processing over 4 billion artifacts monthly across its cloud platform [20].
  • Broadcom (September 2023): Completed integration of CA Automic into its enterprise software division, consolidating mainframe and cloud release automation under a unified product roadmap [16].


Application Release Automation Market Report Scope

Parameter Detail
Market Scope Global Application Release Automation Market — tools, services, deployment modes, organization sizes, end-user industries
Study Period 2021–2035
CAGR (Forecast Period) 17.0% (2026–2035)
Base Year Market Size USD 5.92 Billion (2025)
Forecast Market Size USD 28.71 Billion (2035)
Fastest Growing Segment SMEs (23.0% CAGR); Asia-Pacific (22.4% CAGR)
Companies Profiled IBM, Microsoft, Broadcom, CloudBees, Digital.ai, Harness, GitLab, JFrog, Puppet, Atlassian
Valuation Currency USD Billion


FAQs

How does release automation differ from CI/CD pipeline tooling?

Release automation operates at the orchestration layer above CI/CD, coordinating approvals, environment provisioning, compliance gates, and multi-application sequencing. CI/CD handles build-and-test; release automation governs the end-to-end production delivery chain [17].

What evaluation criteria should procurement teams prioritize when selecting a platform?

Focus on integration breadth with existing toolchains, policy-as-code flexibility, and compliance reporting depth. Vendor lock-in risk, measured by pipeline-definition portability, is the most frequently underweighted criterion [23].

How are release automation vendors addressing multi-tenancy for managed-service providers?

Leading platforms now offer tenant-isolated control planes with role-based access hierarchies that let MSPs manage hundreds of customer environments from a single instance. This architecture reduces operational overhead by 30–40% [21].

What role does release automation play in achieving SLSA compliance?

Platforms generate cryptographically signed provenance attestations at each pipeline stage, satisfying SLSA Level 3 requirements for build integrity and artifact traceability. This eliminates manual evidence collection during audits [15].

How are consumption-based pricing models reshaping vendor revenue mixes?

Usage-based models now account for 25–30% of new bookings among leading vendors, shifting revenue recognition from upfront licenses to recurring pipeline-execution fees. This improves net retention rates but lengthens payback periods [24].

What security risks emerge when automating production deployments at scale?

Automated pipelines can amplify blast radius if compromised credentials propagate through deployment chains. Vendors mitigate this through ephemeral secrets, pipeline-scoped RBAC, and mandatory approval gates for production targets [2].

How should organizations measure ROI from release automation investments?

Track deployment frequency, change failure rate, mean-time-to-recovery, and lead time for changes — the four DORA metrics. Mature adopters typically see 3–5x improvement within 18 months of platform deployment [17].    
Author
Author
Author Profile
Ankit Gupta LinkedIn
Team Lead - Research
Ankit Gupta is a seasoned market intelligence and strategic research professional with over six plus years of experience in the ICT and Semiconductor industries. With academic roots in Telecom, Marketing, and Electronics, he blends technical insight with business strategy. Ankit has led 200+ projects, including work for Fortune 500 clients like Microsoft and Rio Tinto, covering market sizing, tech forecasting, and go-to-market strategies. Known for bridging engineering and enterprise decision-making, his insights support growth, innovation, and investment planning across diverse technology markets.

Research Approach


Secondary Research

The secondary research process involved comprehensive analysis of technology regulatory databases, DevOps industry publications, enterprise software research, and authoritative technology organizations. Key sources included the National Institute of Standards and Technology (NIST), International Organization for Standardization (ISO) technical committees, Cloud Native Computing Foundation (CNCF), DevOps Institute, IEEE Computer Society, ACM Digital Library, Gartner Research, Forrester Research, IDC MarketScape, US Bureau of Labor Statistics (BLS) - IT Occupations, Eurostat ICT Statistics, World Economic Forum (WEF) Digital Transformation Reports, OECD Digital Economy Outlook, and national digital transformation agency reports from key markets.

Software deployment statistics, DevOps adoption metrics, cloud infrastructure data, IT spending trends, and competitive landscape analysis for release orchestration solutions, deployment automation technologies, continuous integration tools, and continuous delivery platforms were gathered from these sources.


Primary Research

In order to gather both qualitative and quantitative insights, supply-side and demand-side stakeholders were interviewed during the primary research process. CEOs, CTOs, VPs of Engineering, product managers, and DevOps advocates from vendors of corporate DevOps tools, CI/CD platforms, and application release automation were examples of supply-side sources. VPs of engineering, DevOps directors, IT infrastructure managers, release managers, and procurement leads from Fortune 500 companies, mid-market firms, cloud-native startups, financial services organizations, healthcare IT departments, and telecommunications operators were among the demand-side sources. In addition to gathering information on CI/CD adoption trends, pricing strategies (SaaS vs. perpetual license), and cloud migration dynamics, primary research validated market segmentation and corroborated product roadmap deadlines.

Primary Respondent Breakdown:

By Designation: C-level Primaries (32%), Director Level (31%), Others (37%)

By Region: North America (38%), Europe (25%), Asia-Pacific (28%), Rest of World (9%)


Market Size Estimation

Revenue mapping and deployment volume analysis were used to determine the global market valuation. The methodology comprised:

Finding more than fifty important suppliers in North America, Europe, Asia-Pacific, and Latin America

Product mapping between CI/CD pipelines, hybrid deployment tools, cloud-based ARA, on-premises release automation, and release orchestration platforms

Analysis of reported and projected yearly revenues for DevOps tool suites and application release automation

Coverage of suppliers accounting for 75–80% of the world market in 2024

Extrapolation of segment-specific valuations for cloud-based, on-premises, and hybrid deployment categories utilizing top-down (vendor revenue validation) and bottom-up (deployment volume × ARPU by organization size and location) techniques

Download Free Sample

Kindly complete the form below to receive a free sample of this Report

Download PDF ×

We do not share your information with anyone. However, we may send you emails based on your report interest from time to time. You may contact us at any time to opt-out.