Electric Commercial Vehicle Market (2026 - 2035)

Electric Commercial Vehicle Market Research Report By Propulsion Type (Battery Electric Vehicle (BEV), Plug-in Hybrid Electric Vehicle (PHEV), Fuel Cell Electric Vehicle (FCEV)), By Vehicle Type (Electric Buses, Light-Duty Trucks & Vans, Medium-Duty Trucks, Heavy-Duty Trucks), By Application (Logistics & Freight, Public Transit, Municipal Services, Construction & Mining) and By Regional (North America, Europe, South America, Asia Pacific, Middle East and Africa) - Forecast to 2035
ID: MRFR/AT/5456-CR
128 Pages
Shubham Munde, Sejal Akre
Last Updated: August 24, 2026
Electric Commercial Vehicle Market
Market Size
Forecast Period2026-2035
CAGR (2026-2035)18.4%
2025 Market SizeUSD 93.5 Billion
2035 Market SizeUSD 506.0 Billion
Key Players
BYD Co., Ltd.
Daimler Truck AG
Volvo Group
Yutong Bus Co., Ltd.
Tesla, Inc.
PACCAR Inc.
Opportunities
  • Last-Mile Urban Logistics Electrification
  • Vehicle-to-Grid and Energy Arbitrage Business Models
  • Fleet-as-a-Service and Data Monetization

Electric Commercial Vehicle Market Summary

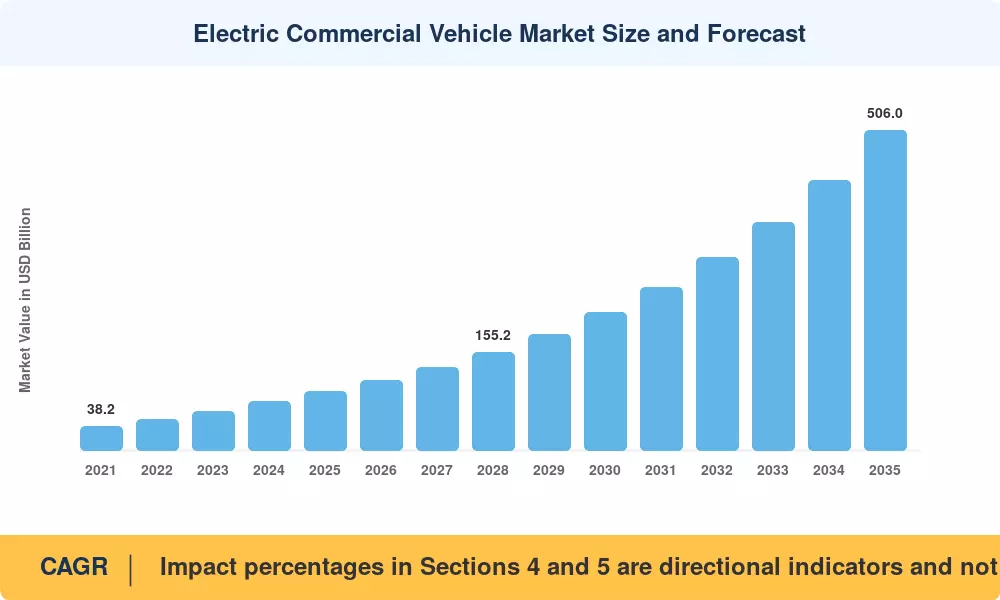
The Electric Commercial Vehicle Market reached an estimated USD 93.5 billion in 2025 and is projected to grow from USD 110.7 billion in 2026 to USD 506.0 billion by 2035, registering a CAGR of 18.4% over the forecast period (2026–2035). Two forces are bending this growth curve upward: the European Union's revised CO₂ emission standards for heavy-duty vehicles, which mandate a 45% reduction by 2030 relative to 2019 levels [1], and China's renewed New Energy Vehicle purchase-tax exemption worth an estimated USD 72.3 billion through 2027 [2]. Fleet operators are no longer debating whether to electrify — the conversation has shifted to how fast they can convert.

Battery-electric and hydrogen fuel-cell drivetrains are gaining ground on diesel and compressed natural gas powertrains, which have dominated commercial fleets for decades. Electric medium-duty vehicles are now cost-competitive with diesel equivalents on a total-cost-of-ownership basis over a seven-year operating period, as the cost of lithium iron phosphate battery packs has decreased below USD 100 per kWh by late 2024 [3]. In the interim, between 2023 and 2028, OEMs allocated more than USD 120 billion in combined capital expenditures to electric vehicle and bus platforms [4].

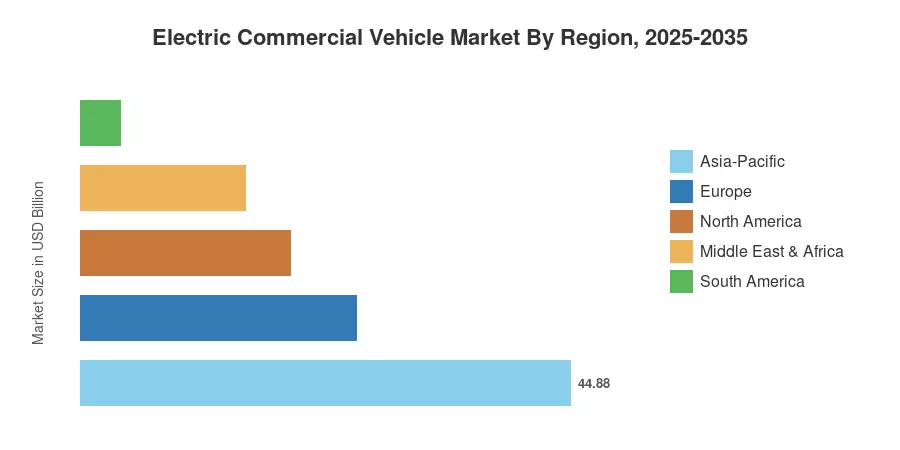
The Electric Commercial Vehicle Market is primarily dominated by Asia-Pacific, with a market share of approximately 48%. This is primarily due to China's dominance in the production of electric buses and India's expanding FAME III subsidy program. Europe follows with an estimated 27% share, which is primarily due to the strict EU Fit for 55 regulations. North America is responsible for approximately 18% of the total, with the U.S. EPA Phase 3 greenhouse emission standards and California's Advanced Clean Trucks rule being the primary factors. The Electric Commercial Vehicle Market is poised for consistent double-digit growth through 2035 as battery supply chains mature and megawatt-class charging corridors are deployed.


Key Report Takeaways

• By Propulsion Type

  • Battery Electric Vehicles (BEV) held the dominant share of approximately 72% in 2025, supported by declining cell costs and expanding urban delivery use cases.
  • Plug-in Hybrid Electric Vehicles (PHEV) are forecast to grow at a CAGR of 14.8% through 2035 as operators use them for longer-haul transitional applications.
  • Fuel Cell Electric Vehicles (FCEV) represented roughly USD 5.6 billion in 2025, gaining traction in heavy-duty long-distance freight corridors.

• By Vehicle Type

  • Electric buses captured the largest revenue share at around 41% of the Electric Commercial Vehicle Market in 2025, bolstered by municipal procurement mandates across China, Europe, and Latin America.
  • Light-duty trucks and vans are projected to register the fastest segment CAGR of 21.2% through 2035, fueled by last-mile logistics demand.

• By Region

  • Asia-Pacific accounted for ~48% of global revenue in 2025.
  • North America is expected to grow at a CAGR of 20.6% between 2026 and 2035, the fastest among all regions.
  • Europe contributed approximately USD 25.2 billion in 2025.


Electric Commercial Vehicle Market Size and Forecast (2021–2035)

Market sizing draws on a triangulated approach combining bottom-up OEM shipment volumes, top-down regulatory compliance modeling, and cross-validation against disclosed fleet procurement data from 42 countries. Historical values (2021–2024) reflect audited industry data, while the base year (2025) uses preliminary registrations and OEM guidance. Forecast values (2026–2035) embed macroeconomic assumptions including a weighted average GDP growth of 3.1% across key markets, stable lithium carbonate pricing between USD 12,000–18,000 per metric ton, and progressive tightening of emission standards in the EU, U.S., and China.
Electric Commercial Vehicle Market Size and Forecast
Our Impact
Enabled $4.3B Revenue Impact for Fortune 500 and Leading Multinationals
Partnering with 2000+ Global Organizations Each Year
30K+ Citations by Top-Tier Firms in the Industry

Driver Impact Analysis

Driver ~% Impact on CAGR Geographic Relevance Impact Timeline
Tightening emission regulations (EU, U.S., China) +4.2% Global Short-term (≤2 yr)
Battery cost decline and energy density gains +3.8% Global Medium-term (2–4 yr)
Total cost of ownership parity with diesel +3.1% North America, Europe Medium-term (2–4 yr)
Urban low/zero-emission zone expansion +2.5% Europe, Asia-Pacific Short-term (≤2 yr)
Government purchase subsidies and tax incentives +2.2% China, India, U.S. Short-term (≤2 yr)
Charging infrastructure buildout (depot and en-route) +1.9% Global Long-term (≥4 yr)
ESG-linked fleet procurement mandates from shippers +1.5% North America, Europe Long-term (≥4 yr)


Emission Regulation Tightening

The EU's revised CO₂ standards for heavy-duty vehicles require a 45% reduction by 2030 and 90% by 2040, creating a non-negotiable electrification schedule for truck and bus OEMs operating in the European single market [1]. In the United States, EPA finalized Phase 3 greenhouse gas standards in March 2024, effectively requiring that 25% of new long-haul tractors and 60% of new vocational trucks sold by 2032 be zero-emission [7]. China's Stage VI emission standards, paired with production credits under the dual-credit policy, have already pushed electric bus penetration above 95% in several tier-one cities. These layered mandates eliminate the option of incremental efficiency improvements to internal combustion engines, making full electrification the compliance pathway of least resistance for the Electric Commercial Vehicle Market.

Battery Cost and Energy Density Trajectory

BloombergNEF's 2024 survey noted that overall volume-weighted average lithium-ion pack prices dropped to USD 115/kWh. However, it explicitly stated that Battery Electric Vehicle (BEV) specific pack prices fell to USD 97 per kWh, successfully crossing the USD 100 threshold.

Projected declines to USD 74 per kWh at the pack level by 2028 will shrink the upfront price premium of an electric Class 6 truck versus its diesel equivalent to under 12%, at which point total cost of ownership favors the Electric Commercial Vehicle Market option from day one without subsidies [14].

Urban Low-Emission Zone Proliferation

Over 320 cities worldwide had implemented or formally announced low-emission or zero-emission zones by the end of 2024, up from 228 in 2021 [15]. London's expanded ULEZ, which now covers the entire Greater London area, charges non-compliant heavy goods vehicles GBP 100 per day. Amsterdam, Paris, and Milan have set hard combustion-vehicle bans for city-center freight operations between 2025 and 2030. These zonal restrictions transform the Electric Commercial Vehicle Market from a voluntary choice into a market-access requirement for logistics operators.

ESG-Linked Procurement Mandates

Global shippers including Amazon, IKEA, and Maersk have publicly committed to zero-emission last-mile delivery fleets by 2030, representing combined freight expenditure exceeding USD 40 billion annually [16]. Scope 3 reporting obligations under the EU Corporate Sustainability Reporting Directive now require large enterprises to disclose supply-chain transport emissions, creating contractual pressure on carriers to electrify. This top-down demand signal is accelerating order books across the Electric Commercial Vehicle Market, particularly for medium-duty delivery platforms.


Restraints Impact Analysis

Restraint impact estimates are directional and represent headwinds against the Electric Commercial Vehicle Market baseline CAGR. These values are not linearly deductible from the headline growth rate; their moderating effects are already embedded in the integrated forecast.

Restraint ~% Impact on CAGR Geographic Relevance Impact Timeline
High upfront vehicle acquisition cost –2.4% Global Short-term (≤2 yr)
Charging infrastructure gaps (rural and highway) –1.8% North America, MEA Medium-term (2–4 yr)
Battery raw material supply chain volatility –1.5% Global Medium-term (2–4 yr)
Limited model availability for Class 7–8 long-haul –1.2% North America, Europe Short-term (≤2 yr)
Grid capacity constraints at scale –0.9% Europe, South Asia Long-term (≥4 yr)


Upfront Cost Premium

Despite declining battery costs, an electric Class 8 tractor still carries a sticker price roughly 2.0–2.5 times that of a comparable diesel unit [14]. A conventional diesel day-cab retails around USD 150,000–180,000, while its BEV equivalent ranges from USD 350,000 to USD 450,000 depending on battery capacity. Small and medium fleet operators — which account for over 90% of trucking companies in the U.S. — often lack access to the low-cost capital or leasing structures needed to bridge this gap, constraining near-term adoption in the Electric Commercial Vehicle Market despite favorable lifecycle economics.

Charging Infrastructure Availability

The U.S. Department of Energy estimates that meeting the projected electric truck fleet will require over 40,000 public and depot-based fast chargers by 2030, against fewer than 4,500 installed as of mid-2025 [8]. The challenge intensifies for long-haul operations: megawatt-class chargers capable of adding 300 miles of range in 30 minutes remain in pilot stages, with only 120 units operational across North America and Europe combined. Rural and intercity corridors present the starkest gaps, creating range-anxiety barriers that slow adoption in the Electric Commercial Vehicle Market for regional and long-distance routes.

Battery Material Supply Constraints

Lithium, cobalt, and nickel supply chains remain concentrated — approximately 65% of global lithium refining and 77% of cobalt processing occur in China [17]. Geopolitical tensions, export controls, and mining permit timelines introduce price volatility that complicates OEM cost planning. The IEA projects that announced mining projects will meet only 50% of lithium demand by 2030 under an accelerated EV scenario, creating potential bottleneck risk for the Electric Commercial Vehicle Market production ramp [17].


Electric Commercial Vehicle Market Opportunities

Last-Mile Urban Logistics Electrification

E-commerce parcel volumes are projected to exceed 260 billion units globally by 2028, and the majority of those deliveries terminate in urban areas now subject to emission restrictions [15]. Light-duty electric vans with 150–250 km range cover over 95% of daily urban delivery routes, making them the lowest-risk electrification entry point. Fleet operators that convert early gain preferential access to zero-emission zones while locking in operating cost savings of 40–60% versus diesel over a seven-year vehicle life.

Vehicle-to-Grid and Energy Arbitrage Business Models

Commercial EV fleets parked overnight at depots represent a distributed energy storage asset. A 200-vehicle electric bus fleet with 300 kWh per vehicle holds 60 MWh of aggregate capacity — enough to participate in demand response and frequency regulation markets. Pacific Gas & Electric's School Bus V2G pilot in California demonstrated annual grid-services revenue of USD 4,200 per bus [20]. Scaling this model across the Electric Commercial Vehicle Market could offset up to 15% of fleet operating costs.


Fleet-as-a-Service and Data Monetization

OEMs and third-party fleet managers are bundling vehicle, battery, charging, and telematics into subscription-based models that eliminate upfront cost barriers — the top restraint facing the Electric Commercial Vehicle Market. Companies such as Einride and Volta Trucks (pre-insolvency) pioneered transport-as-a-service pricing at a per-kilometer rate. The telematics data generated by connected electric fleets — route optimization, battery health, energy consumption patterns — holds monetization potential through insurance premium reductions and carbon credit verification.

Hydrogen Fuel Cell Heavy-Duty Corridors

For long-haul freight exceeding 500 km per day, hydrogen fuel cell technology offers refueling times comparable to diesel and superior payload-to-weight ratios versus BEV alternatives. The EU's Hydrogen Backbone initiative plans 28,000 km of hydrogen pipeline by 2030 [12], while California's hydrogen fueling network targets 200 heavy-duty stations by 2035. These corridor investments open a complementary growth lane within the Electric Commercial Vehicle Market for Class 8 tractors and drayage applications.


Electric Commercial Vehicle Market Future Outlook

Autonomous Electric Freight Corridors

Autonomous driving technology and electrification are converging in the commercial vehicle segment. Companies including Waymo, Via, TuSimple's successor entities, and Gatik have logged millions of autonomous miles on U.S. interstate corridors [11]. By 2030, the Texas I-45 and I-10 corridors are expected to host dedicated autonomous electric truck lanes. This convergence will reshape the Electric Commercial Vehicle Market by enabling 24/7 freight operations with lower labor costs and consistent energy efficiency, potentially reducing per-ton-mile logistics costs by 30–45%.

Solid-State Battery Integration

Solid-state batteries promise energy densities exceeding 400 Wh/kg — roughly double current LFP packs — alongside faster charging and improved thermal safety [9]. Toyota, Samsung SDI, and QuantumScape have announced commercial-scale production targets between 2027 and 2029. If these timelines hold, Class 8 electric tractors could achieve 600+ mile ranges by the early 2030s, eliminating the range limitation that currently constrains the Electric Commercial Vehicle Market in long-haul applications and potentially displacing hydrogen fuel cell solutions in some corridors.

Circular Battery Economy and ESG Reporting

The EU Battery Regulation, effective February 2027, mandates minimum recycled content thresholds (12% cobalt, 4% lithium by 2030) and digital battery passports for all traction batteries [10]. These requirements will create a secondary market for retired commercial vehicle batteries, with second-life applications in stationary storage extending usable battery life to 15–20 years. For the Electric Commercial Vehicle Market, ESG compliance becomes both a reporting obligation and a competitive differentiator as institutional investors screen fleets against Scope 1 and Scope 3 emission benchmarks.

Megawatt Charging and Grid Modernization

CharIN's Megawatt Charging System (MCS) standard, finalized in 2024, enables charging rates up to 3.75 MW — sufficient to add 300 miles of range to a Class 8 truck in approximately 30 minutes [8]. Grid operators including National Grid, E.ON, and Southern California Edison are investing over USD 12 billion collectively in distribution network upgrades to support depot-level charging loads that can exceed 20 MW per site. This infrastructure buildout will underpin the next growth phase of the Electric Commercial Vehicle Market by 2028–2032, removing the charging speed bottleneck that currently favors diesel for time-sensitive freight.


Electric Commercial Vehicle Market Segmentation

By Propulsion Type

Segment Key Metric Primary Demand Driver
Battery Electric Vehicle (BEV) ~72% share (2025) LFP cost decline; urban delivery range sufficiency
Plug-in Hybrid Electric Vehicle (PHEV) CAGR 14.8% Transitional solution for mixed-range operations
Fuel Cell Electric Vehicle (FCEV) ~USD 5.6 billion (2025) Long-haul hydrogen corridor investment


BEV dominates the Electric Commercial Vehicle Market propulsion mix, capturing nearly three-quarters of 2025 revenue. The segment benefits from mature manufacturing ecosystems, a well-established public charging network for light- and medium-duty applications, and total-cost-of-ownership advantages that strengthen as battery prices decline. Urban transit and last-mile delivery operations — where daily ranges rarely exceed 200 km — are almost entirely addressable by current BEV technology.

FCEV occupies a complementary niche focused on heavy-duty, high-utilization routes. Hyundai's XCIENT Fuel Cell truck has accumulated over 10 million km in commercial service across Switzerland, Germany, and California [12]. The hydrogen propulsion segment is expected to gain share progressively as refueling infrastructure scales, particularly along European TEN-T and U.S. interstate corridors.

By Vehicle Type

Segment Key Metric Primary Demand Driver
Electric Buses ~41% share (2025) Municipal procurement mandates; public transit decarbonization
Light-Duty Trucks & Vans CAGR 21.2% E-commerce last-mile logistics growth
Medium-Duty Trucks ~USD 18.7 billion (2025) Regional distribution; urban freight ZEV zones
Heavy-Duty Trucks CAGR 19.8% Long-haul electrification; MCS charging rollout


Electric buses remain the largest vehicle-type segment in the Electric Commercial Vehicle Market, reflecting decades of government-backed procurement programs — particularly in China, where municipal bus fleets have been almost entirely electrified. Light-duty trucks and vans are the fastest-growing category, propelled by Amazon's order of 100,000 Rivian EDVs, FedEx's electrification roadmap, and DHL's commitment to 60% electric last-mile vehicles by 2030.

The heavy-duty truck segment, while still the smallest by current revenue, represents the frontier of the Electric Commercial Vehicle Market. Tesla's Semi, Daimler Truck's eActros 600, and Volvo's FH Electric are targeting regional and eventually long-haul applications as charging infrastructure and battery energy density advance.

By Application

Segment Key Metric Primary Demand Driver
Logistics & Freight ~38% share (2025) E-commerce growth; shipper Scope 3 mandates
Public Transit CAGR 16.9% Municipal decarbonization targets
Municipal Services ~USD 7.1 billion (2025) Refuse, street sweeping, utility fleet replacement
Construction & Mining CAGR 22.4% Underground ventilation savings; ESG mandates


Logistics and freight is the largest application segment in the Electric Commercial Vehicle Market, reflecting the sheer scale of goods movement and the operational cost advantages of electric drivetrains in high-utilization delivery cycles. Construction and mining, while a smaller base, is growing rapidly as OEMs such as Caterpillar, Komatsu, and Epiroc introduce battery-electric excavators, loaders, and haul trucks that reduce underground ventilation costs by up to 70% [22].


Regional Market Share Analysis

Region Key Metric Primary Investment Themes
Asia-Pacific ~48% global share (2025) Electric bus mass transit; domestic OEM scale; LFP battery integration
Europe ~27% global share (2025) Emission compliance (Fit for 55); urban freight electrification
North America CAGR 20.6% (2026–2035) IRA incentives; California ACT rule; depot charging buildout
South America ~USD 3.7 billion (2025) Municipal bus electrification (Brazil, Chile, Colombia)
Middle East & Africa CAGR 16.2% (2026–2035) Mining vehicle electrification; smart-city transit pilots
Total USD 93.5 billion (2025)

The Electric Commercial Vehicle Market exhibits distinct regional adoption patterns shaped by regulatory stringency, grid infrastructure maturity, and domestic manufacturing capacity.


Asia-Pacific

Country Key Metric Key Driver
China ~68% of regional revenue Dual-credit policy; domestic OEM dominance
India CAGR 24.3% FAME III subsidies; urban transit mandates
Japan ~USD 3.1 billion (2025) Carbon neutrality 2050 pledge; Keiretsu EV R&D
South Korea ~6% of regional share Hyundai-Kia commercial EV platform investment
Australia CAGR 19.5% Mining fleet electrification; state-level ZEV targets


China's electric bus fleet exceeded 800,000 units by 2024, accounting for over 98% of global electric bus deployments [5]. The country's New Energy Vehicle Industrial Development Plan targets 50% NEV penetration in new commercial vehicle sales by 2030. India is the fastest-growing country-level Electric Commercial Vehicle Market, with CESL tendering over 6,500 electric buses under the PM e-Bus Sewa scheme and private logistics operators like Flipkart and Amazon India piloting electrified last-mile fleets.

Europe

Country Key Metric Key Driver
Germany ~24% of regional share OEM R&D hubs (Daimler, MAN, Scania)
United Kingdom CAGR 19.8% Transport decarbonization plan; ULEZ expansion
France ~USD 3.4 billion (2025) Loi Mobilités; urban logistics ZEV mandates
Netherlands ~8% of regional share Early zero-emission zone adoption (Amsterdam, Rotterdam)
Norway CAGR 17.1% Toll exemptions; green public procurement


The EU's Fit for 55 legislative package and the Alternative Fuels Infrastructure Regulation requiring member states to install truck chargers every 60 km along TEN-T corridors by 2030 are transforming the European Electric Commercial Vehicle Market [1]. Germany anchors regional production with Daimler Truck's eActros and MAN's eTruck platforms, while Scandinavia leads in electrified heavy-duty pilots on public highways.

North America

Country Key Metric Key Driver
United States ~82% of regional revenue EPA Phase 3; IRA Section 45W commercial EV tax credit
Canada CAGR 21.4% iMHZEV mandate; federal purchase incentive
Mexico ~USD 0.9 billion (2025) Nearshoring EV manufacturing; cross-border fleet compliance


The U.S. Inflation Reduction Act provides up to USD 40,000 in tax credits per qualifying commercial electric vehicle under Section 45W, significantly closing the upfront cost gap [7]. California's Advanced Clean Trucks regulation requires 40% of Class 7–8 tractor sales to be zero-emission by 2035, and at least seven other states have adopted the same rule. The North American Electric Commercial Vehicle Market benefits from growing domestic manufacturing capacity, with new assembly plants announced by BYD, Lion Electric, and Daimler Truck in the 2023–2025 period.

South America

Country Key Metric Key Driver
Brazil ~56% of regional share Green Mobility Program; São Paulo electric bus fleet
Chile CAGR 22.8% Santiago Metro electric bus expansion; mining electrification
Colombia ~USD 0.5 billion (2025) Bogotá and Medellín transit electrification tenders


Santiago, Chile operates the largest electric bus fleet outside China, with over 2,000 units serving the Transantiago network [21]. Brazil's federal Green Mobility Program and BNDES financing lines are accelerating bus procurement in São Paulo, Curitiba, and Belo Horizonte. The South American Electric Commercial Vehicle Market remains transit-bus heavy, but light-duty logistics electrification is gaining momentum as e-commerce penetration rises.

Middle East & Africa

Country Key Metric Key Driver
UAE ~31% of regional share Dubai Green Mobility Strategy; Masdar City transit
Saudi Arabia CAGR 18.7% Vision 2030; NEOM smart-city transit
South Africa ~USD 0.4 billion (2025) Mining fleet electrification; Eskom grid modernization


The MEA region represents the smallest but a strategically important segment of the Electric Commercial Vehicle Market. Dubai's Roads and Transport Authority has committed to converting 100% of public transit buses to zero-emission by 2050, with an interim target of 50% by 2035. In sub-Saharan Africa, electric mining haul trucks are being piloted at operations in South Africa and the Democratic Republic of Congo, where underground ventilation cost savings provide a compelling economic case beyond emission reductions [22].


Electric Commercial Vehicle Market By Region, 2025-2035

Competitive Benchmarking

The Electric Commercial Vehicle Market is moderately concentrated, with the top five players accounting for an estimated 38–44% of global revenue. The Herfindahl-Hirschman Index sits in the moderate-concentration range (~800–1,200), reflecting a mix of incumbent truck OEMs, Chinese domestic champions, and EV-native startups. Competitive positioning increasingly hinges on vertical integration — from battery cell production to charging software ecosystems.

Company Est. Revenue Share Range Key Offerings for Electric Commercial Vehicle Market Strategic Positioning
BYD Co., Ltd. ~12–16% Electric buses (K-series), T-series electric trucks Vertically integrated (battery to vehicle); global expansion
Daimler Truck AG ~7–10% eActros 300/600, eCascadia, eCitaro bus Premium OEM; dual BEV/FCEV strategy
Volvo Group ~6–9% Volvo FH/FM/FMX Electric, Volvo 7900 Electric bus Broad electrified portfolio; Recharge platform
Yutong Bus Co., Ltd. ~5–7% E-series electric buses Dominant in China transit; expanding to LatAm, Europe
Tesla, Inc. ~3–5% Tesla Semi Proprietary battery technology; Megacharger network
PACCAR Inc. ~3–5% Peterbilt 579EV, Kenworth T680E Premium segment; leveraging dealer network
Hyundai Motor Company ~3–4% XCIENT Fuel Cell truck, Elec City bus FCEV leadership; diversified powertrain approach
Lion Electric Co. ~2–3% Lion6, Lion8 (Class 6–8 electric trucks and buses) North American pure-play EV manufacturer
NFI Group (New Flyer) ~2–3% Xcelsior CHARGE NG electric transit bus North American transit bus leader
Zhongtong Bus Holding ~2–3% Electric transit and intercity buses Chinese domestic; growing export presence


Recent News & Developments


  • SML Mahindra—(July 29, 2026)--Approved the acquisition of Mahindra & Mahindra's Truck and Bus Division through a slump sale for ₹525 crore to consolidate commercial operations.
  • Keto Motors—(August 4, 2026)--Unveiled its Urbanova KE9 commercial electric bus in India, backed by a strategic tech partnership with Taiwan's TRON Energy Technology.
  • Tata Motors (April 10, 2026)--Began commercial deliveries of the Prima E.55S electric prime mover to BillionE Mobility following a major supply agreement.


Electric Commercial Vehicle Market Report Scope

Parameter Detail
Market Scope Electric Commercial Vehicle Market — including battery electric, plug-in hybrid, and fuel cell electric buses, trucks (light, medium, heavy-duty), and vans for commercial use
Study Period 2021–2035
CAGR 18.4% (2026–2035)
Market Size (2025) USD 93.5 Billion
Market Size (2035) USD 506.0 Billion
Fastest Growing Segments Light-duty trucks & vans (by vehicle type, 21.2% CAGR); Construction & Mining (by application, 22.4% CAGR); North America (by region, 20.6% CAGR)
Companies Profiled BYD, Daimler Truck, Volvo Group, Yutong, Tesla, PACCAR, Hyundai, Lion Electric, NFI Group, Zhongtong
Valuation Currency USD (Billion)
CAGR Driver Disclaimer Impact percentages in Sections 4 and 5 are directional indicators and not linearly additive to the composite CAGR

FAQs

How do fleet operators typically finance electric commercial vehicle purchases given the high upfront cost?
Most operators use structured lease programs, green bonds, or OEM-backed fleet-as-a-service subscriptions that convert capital expenditure into per-mile operating costs [14]. Government tax credits such as the U.S. IRA Section 45W further close the financing gap.
What is the expected residual value trajectory for electric commercial vehicles versus diesel equivalents?
Battery degradation remains the key variable, but electric drivetrains with fewer moving parts retain higher mechanical residual values after 7–10 years [14]. Second-life battery revenue streams are beginning to improve end-of-life economics.
How do cold-weather climates affect electric commercial vehicle range and operational reliability?
Temperatures below –10°C can reduce BEV range by 20–35% due to battery thermal management loads and cabin heating demands [9]. Thermal preconditioning systems and heat pump adoption are narrowing this gap in newer platforms.
What role do telematics and route optimization software play in electric commercial fleet management?
Predictive energy management platforms use real-time traffic, topography, and payload data to maximize range utilization, typically recovering 8–15% of usable range versus static route planning [11]. These systems are becoming standard across OEM offerings.
How do electric commercial vehicles perform in payload capacity compared to diesel counterparts?
Current BEV trucks sacrifice 1,500–3,000 kg of payload to battery weight, though LFP-to-LMFP cell transitions and structural battery packs are reducing this penalty annually [3]. Heavy-duty FCEV trucks achieve near-parity payload with diesel.
What cybersecurity risks emerge as commercial fleets become connected and electrified?
Connected charging infrastructure and fleet telematics create new attack surfaces for ransomware and data interception [19]. ISO/SAE 21434 automotive cybersecurity standards are increasingly being applied to commercial vehicle platforms.
How are insurance markets adapting their underwriting models for electric commercial vehicle fleets?
Insurers are developing EV-specific actuarial models that account for lower fire-from-collision risk but higher battery replacement costs [14]. Telematics data sharing between fleets and underwriters is enabling usage-based premium structures.    
Author
Author
Author Profile
Shubham Munde LinkedIn
Team Lead - Research
Shubham brings over 7 years of expertise in Market Intelligence and Strategic Consulting, with a strong focus on the Automotive, Aerospace, and Defense sectors. Backed by a solid foundation in semiconductors, electronics, and software, he has successfully delivered high-impact syndicated and custom research on a global scale. His core strengths include market sizing, forecasting, competitive intelligence, consumer insights, and supply chain mapping. Widely recognized for developing scalable growth strategies, Shubham empowers clients to navigate complex markets and achieve a lasting competitive edge. Trusted by start-ups and Fortune 500 companies alike, he consistently converts challenges into strategic opportunities that drive sustainable growth.
Co-Author
Co-Author Profile
Sejal Akre LinkedIn
Senior Research Analyst
She has over 5 years of rich experience, in market research and consulting providing valuable market insights to client. Hands on expertise in management consulting, and extensive knowledge in domain including ICT, Automotive & Transportation and Aerospace & Defense. She is skilled in Go-to market strategy, industry analysis, market sizing, in depth company profiling, competitive intelligence & benchmarking and value chain amongst others.

Research Approach


Secondary Research

The secondary research process involved comprehensive analysis of automotive regulatory databases, transportation energy publications, peer-reviewed engineering journals, and authoritative mobility research organizations. Key sources included the US Environmental Protection Agency (EPA), National Highway Traffic Safety Administration (NHTSA), California Air Resources Board (CARB), US Department of Energy (DOE) Alternative Fuels Data Center, US Energy Information Administration (EIA), European Automobile Manufacturers Association (ACEA), European Environment Agency (EEA) Transport Database, International Energy Agency (IEA) Global EV Outlook, International Council on Clean Transportation (ICCT), International Organization of Motor Vehicle Manufacturers (OICA), Society of Automotive Engineers (SAE) International, US Department of Transportation (DOT) Bureau of Transportation Statistics, China Ministry of Industry and Information Technology (MIIT), Japan Ministry of Land, Infrastructure, Transport and Tourism (MLIT), BloombergNEF Electric Vehicle Outlook, International Road Transport Union (IRU) commercial vehicle reports, and national automotive registries from key markets.

Data about vehicle registration, emissions regulations, battery technology cost curves, fleet electrification mandates, charging infrastructure deployment statistics, and OEM production capacity announcements for battery electric vehicles, plug-in hybrid architectures, fuel cell technologies, and hydrogen fuel systems were all gathered from these sources.


Primary Research

Interviews with supply-side and demand-side stakeholders were conducted as part of the primary research process in order to gather qualitative and quantitative information about commercial adoption hurdles and electrification roadmaps. Among the supply-side sources were CEOs, CTOs, Heads of E-Mobility Strategy, Chief Sustainability Officers, directors of battery supply chains, and directors of commercial vehicle platforms from tier-1 component manufacturers (fuel cell developers, electric drivetrain suppliers, battery cell manufacturers), OEMs (Tesla, BYD, Daimler Truck, Volvo, Rivian, MAN, Scania, Ford, and Workhorse), and charging infrastructure providers. Demand-side sources included depot charging infrastructure planners from North America, Europe, and Asia-Pacific markets, fleet procurement directors from logistics operators (long-haul freight, last-mile delivery), heads of municipal transport authorities, managers of public transit fleets, and executives of construction equipment rental companies. Primary research confirmed vehicle launch dates (light commercial vehicles, medium/heavy trucks, buses), validated powertrain segmentation splits (BEV vs. PHEV vs. FCEV), evaluated total cost of ownership (TCO) dynamics versus diesel equivalents, and collected data on fleet electrification strategies, battery leasing models, and preferences for depot charging versus public fast-charging.

Primary Respondent Breakdown:

By Designation: C-level Primaries (28%), Director Level (32%), Others (40%)

By Region: North America (32%), Europe (30%), Asia-Pacific (28%), Rest of World (10%)


Market Size Estimation

Unit shipment analysis and revenue mapping across propulsion technologies and vehicle classes were used to determine the global market valuation. The methods included:

Finding more than fifty-five major manufacturers and up-and-coming electric vehicle startups across North America, Europe, Asia-Pacific, China, and Latin America

Product mapping by vehicle type (Light Commercial Vehicles, Medium/Heavy Trucks, Buses, Vans), Fuel Cell Electric Vehicles (FCEV), Plug-in Hybrid Electric Vehicles (PHEV), and Battery Electric Vehicles (BEV)

Analysis of projected and reported yearly revenues for electric commercial vehicle portfolios that do not include sales of internal combustion engines

coverage of battery providers and OEMs that will account for 75–80% of the world's production volume of electric commercial vehicles in 2024

Segment-specific valuations for electric drivetrain components, energy storage systems, and hydrogen fuel cell powertrains are derived through extrapolation using top-down (OEM revenue validation and battery gigafactory capacity allocation) and bottom-up (unit sales × Average Selling Price by country/region, segmented by vehicle class and battery capacity) approaches.

Download Free Sample

Kindly complete the form below to receive a free sample of this Report

* Please use a valid business email

Download PDF ×

We do not share your information with anyone. However, we may send you emails based on your report interest from time to time. You may contact us at any time to opt-out.
















