Intraoral Scanner Market (2026 - 2035)

Intraoral Scanner Market Research Report: Size, Share, Trend Analysis By Technology (3D Digital Scanners, Optical Scanners, Laser Scanners, Electromagnetic Scanners), By Applications (Orthodontics, Restorative Dentistry, Implantology, Periodontics), By End Use (Dental Clinics, Dental Laboratories, Hospitals), By Product Type (Handheld Scanners, Stationary Scanners) and By Regional (North America, Europe, South America, Asia-Pacific, Middle East and Africa) - Growth Outlook & Industry Forecast 2025 To 2035
ID: MRFR/HC/30911-HCR
128 Pages
Rahul Gotadki, Kinjoll Dey
Last Updated: July 03, 2026
Intraoral Scanner Market
Market Size
Forecast Period2026-2035
CAGR (2026-2035)11.8%
2025 Market SizeUSD 0.87 Billion
2035 Market SizeUSD 2.62 Billion
Key Players
Align Technology
Dentsply Sirona
3Shape
Medit Corp
Planmeca
Carestream Dental
Opportunities
  • Emerging-Market Penetration in South and Southeast Asia
  • Subscription and Scanner-as-a-Service Models
  • Integration with Chairside 3D Printing

Intraoral Scanner Market Summary

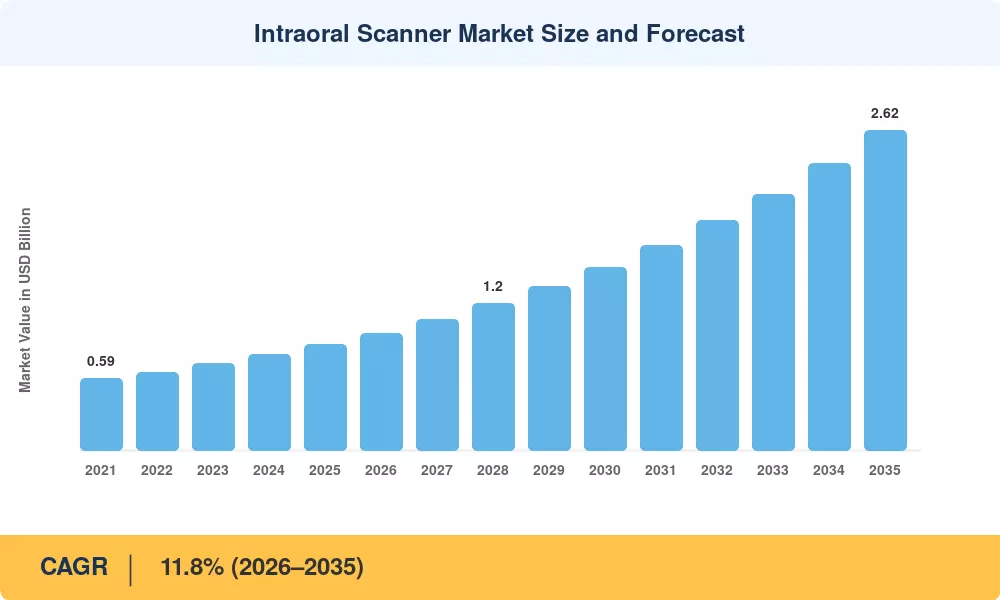
The Intraoral Scanner Market size was valued at USD 0.87 Billion in 2025, and the market is projected to grow from USD 0.96 Billion in 2026 to USD 2.62 Billion by 2035, registering a CAGR of 11.8% during the forecast period 2026–2035. Two catalysts are accelerating this trajectory: rising global expenditure on cosmetic and restorative dentistry — the American Dental Association estimates that U.S. dental spending crossed USD 185 Billion in 2024 [1] — and a wave of insurance-reimbursement reforms in North America and Western Europe that increasingly recognize digital impression codes as standard-of-care procedures [2].

A sweeping technology shift is reshaping how dental professionals capture patient data. Traditional alginate and polyvinyl siloxane impression trays, long criticized for patient discomfort and dimensional instability, are giving way to compact optical wands that generate real-time 3D meshes within seconds. Major device makers invested a combined USD 1.2 Billion in scanner R&D between 2022 and 2024, racing to integrate AI-driven stitching, shade matching, and caries detection directly into the scanning workflow. This convergence of hardware miniaturization and software intelligence is creating a category of chairside dental scanning devices that function as diagnostic hubs rather than simple impression substitutes.

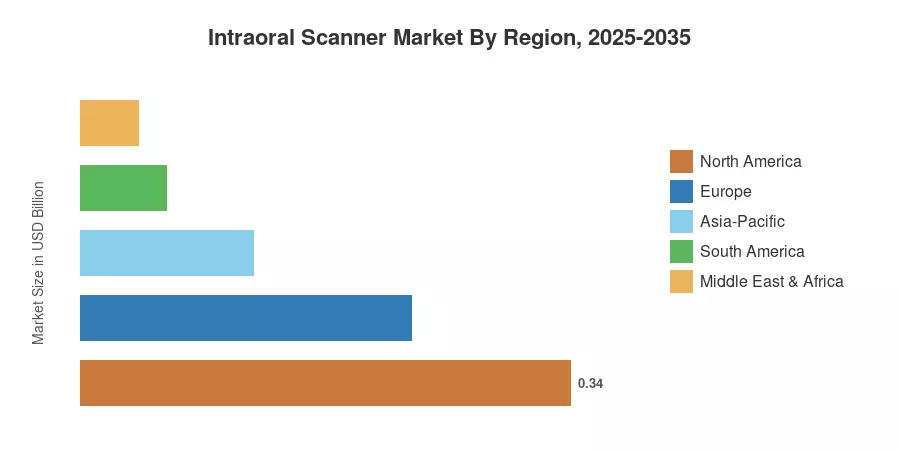
North America commands roughly 39% of the Intraoral Scanner Market, supported by high per-capita dental spending and favorable CDT code reimbursement. Asia-Pacific represents the fastest-growing region at a projected 13.6% CAGR, driven by government-backed digital-health mandates in China and India [4]. Europe holds the second-largest share at approximately 27%, anchored by Germany's strong dental-lab ecosystem. As tele-dentistry platforms expand and scanner price points drop below USD 20,000, adoption among solo practitioners and mobile clinics should intensify through the end of the decade.


Key Report Takeaways

• By Type

  • Powder-free scanners captured approximately 80% of the intraoral scanner market revenue in 2025, reflecting clinician preference for streamlined, powder-free capture.
  • Powder-based models with approximately 11.5% CAGR persist in budget-sensitive segments and dental-education settings where the lower hardware cost


• By Modality

  • Portable handheld units are projected to expand at a 14.0% CAGR through 2035, outpacing cart-based systems as wireless connectivity matures.
  • Cart-based scanners remain the workhorse 14.0% 2026-2035 of the Intraoral Scanner Market in hospital and large-practice settings, where a single unit serves multiple operatories via a mobile cart.

• By Application

  • Orthodontics accounted for roughly 46% of the Intraoral Scanner Market by application in 2025, driven by direct-to-consumer aligner demand.


• By End User

  • Dental clinics are expected to register the fastest end-user CAGR of 14.8% as mid-tier scanners become affordable.

• By Region

  • North America retained a 39% share, supported by reimbursement clarity and early technology adoption.
  • Asia-Pacific is forecast to grow at a 13.6% CAGR, led by China's Healthy China 2030 digital dentistry allocation.


Market Size and Forecast (2021–2035)

Market Research Future's proprietary sizing framework combines bottom-up revenue tracking from scanner OEMs, dental distributor sell-through data, and top-down cross-referencing with national dental expenditure databases. Historical figures (2021–2024) reflect actual shipment volumes, while the forecast (2026–2035) incorporates regression-adjusted inputs for procedure volume growth, average selling price erosion, and regional adoption curves.
Intraoral Scanner Market Size and Forecast
Our Impact
Enabled $4.3B Revenue Impact for Fortune 500 and Leading Multinationals
Partnering with 2000+ Global Organizations Each Year
30K+ Citations by Top-Tier Firms in the Industry

Driver Impact Analysis

Driver ~% Impact on CAGR Geographic Relevance Impact Timeline
Clear-aligner therapy adoption surge +2.5% Global Short-term (≤2 yr)
AI-enhanced scan accuracy & diagnostics +2.0% North America, Europe Medium-term (2–4 yr)
Reimbursement code recognition for digital impressions +1.8% North America, Europe Short-term (≤2 yr)
Government digital-health mandates (Asia-Pacific) +1.5% Asia-Pacific Medium-term (2–4 yr)
Declining scanner average selling prices +1.3% Global Long-term (≥4 yr)
Wireless/portable form-factor innovation +1.2% Global Medium-term (2–4 yr)
Dental tourism growth in emerging economies +0.8% South America, MEA Long-term (≥4 yr)


Clear-Aligner Therapy Adoption Surge

The clear-aligner market is expected to grow at a rate of about 18% annually, reaching an estimated USD 6.8 billion in 2024 [11]. A digital scan is the first step in every aligner case, establishing a structural connection between aligner volume and scanner demand. By Q3 2024, iTero scan submissions surpassed 23 million cumulative cases, according to Align Technology, a 27% increase over the same quarter the previous year [17]. Physical impressions are completely eliminated by this direct-to-production route, making scanner ownership a financial requirement for practices looking to increase aligner revenue.


AI-Enhanced Scan Accuracy and Diagnostics

Modern scanners are equipped with machine-learning algorithms that can identify sub-millimeter margin differences, identify early-stage cavities, and automatically categorize the quality of tooth preparation. These features turn a basic impression device into a diagnostic tool. AI-assisted scan verification decreased remake rates for crowns and bridges by 34% over a 1,200-case cohort, according to a 2024 peer-reviewed study published in the Journal of Dental Research [13]. In order to generate a recurring revenue layer on top of hardware sales, scanner OEMs are monetizing these features through software subscription tiers that cost between $200 and $400 per month.


Reimbursement Code Recognition

The ADA's 2024 update to CDT coding officially separated digital-impression capture (D0470) from conventional impression codes, enabling practices to bill insurers directly for scanner-based workflows [2]. Germany's KZBV followed with analogous BEMA code revisions effective January 2025 [8]. These policy shifts remove a longstanding adoption barrier: practices that previously absorbed scanner costs as overhead can now recover a portion through per-case reimbursement, improving the return-on-investment calculus for mid-tier clinics.

Government Digital-Health Mandates in Asia-Pacific

China's Healthy China 2030 initiative earmarked approximately USD 4.5 Billion for hospital-level digital diagnostic equipment upgrades, explicitly listing intraoral scanners among eligible device categories [4]. India's Ayushman Bharat Digital Mission is onboarding dental providers onto a unified health-record platform, incentivizing practices that submit digitally captured impressions with faster claim settlements. These policy frameworks are compressing what would have been a 10–15-year organic adoption cycle into roughly five to seven years.


Restraints Impact Analysis

Impact percentages below represent estimated drag effects on the market's growth trajectory and are not directly subtracted from the CAGR figure. They reflect structural headwinds identified through primary interviews and regulatory scanning.

Restraint ~% Impact on CAGR Geographic Relevance Impact Timeline
High upfront equipment cost (USD 25,000–55,000) −1.5% Global Short-term (≤2 yr)
Clinician learning curve and workflow disruption −1.0% Global Medium-term (2–4 yr)
Limited interoperability between proprietary ecosystems −0.8% Global Long-term (≥4 yr)
Reimbursement gaps in emerging markets −0.7% South America, MEA, parts of APAC Medium-term (2–4 yr)
Data privacy and cloud-storage concerns −0.5% Europe, North America Long-term (≥4 yr)


High Upfront Equipment Cost

Premium cart-based systems with integrated milling can cost more than USD 55,000, while entry-level powder-free scanners start at about USD 25,000 [7]. Adoption outside of high-volume offices is discouraged by the payback period, which might exceed 30 months for solo practitioners producing less than 15 impression cases per week. Although interest-rate sensitivity in 2024–2025 has delayed finance penetration in North America and Europe, leasing and subscription models are lowering this hurdle.


Clinician Learning Curve

According to a 2023 study of 800 general dentists published in Clinical Oral Investigations [18], switching from analog trays to digital scanning necessitates 40–60 hours of practical instruction before scan times settle at competitive levels. Chair time per patient rises by an average of 8 minutes during this ramp-up, undermining the very efficiency improvements that make the investment worthwhile. This is being addressed by vendor-sponsored certification programs and continuing education requirements, although uptake among older practitioners is still slow.


Limited Interoperability

Most scanner OEMs use proprietary mesh formats that lock clinicians into a single vendor's software and milling ecosystem [19]. While open STL and PLY export is available on several platforms, advanced features — AI diagnostics, shade libraries, treatment-planning modules — often require the vendor's native format. The absence of a universal interoperability standard (analogous to DICOM in medical imaging) fragments the Intraoral Scanner Market and raises switching costs, particularly for multi-location dental service organizations evaluating fleet purchases.


Intraoral Scanner Market Opportunities

Emerging-Market Penetration in South and Southeast Asia

India alone adds approximately 30,000 new dental graduates annually, yet scanner penetration among private dental clinics remains below 4% [12]. Government-subsidized equipment financing under the Mudra Loan scheme and digital-health accreditation incentives create a favorable entry point for mid-tier scanner brands. The Intraoral Scanner Market stands to gain significantly as these graduates establish digitally native practices rather than retrofitting analog workflows.

Subscription and Scanner-as-a-Service Models

Several OEMs are piloting zero-upfront-cost models in which clinics pay USD 500–800 per month for hardware access, software updates, and AI feature unlocks [10]. This SaaS approach converts a capital expenditure into an operating expense, lowering the adoption threshold for cost-sensitive practices and generating predictable recurring revenue for manufacturers. The model mirrors the managed-print paradigm that accelerated digital radiography adoption a decade ago.

Integration with Chairside 3D Printing

Rapid-prototyping printers capable of producing surgical guides, temporary crowns, and night guards in under 20 minutes are entering the sub-USD 10,000 price band [14]. When paired with an intraoral scanner, these printers close the design-to-delivery loop within a single appointment — a value proposition that resonates strongly with patient-experience-focused practices.

AI-Powered Diagnostic Monetization

Beyond impression capture, scanner hardware is becoming a platform for subscription-based diagnostic services: automated caries detection, periodontal charting, and longitudinal tooth-wear monitoring [13]. Practices that activate these modules report a 12–18% increase in treatment-plan acceptance rates because patients can visualize pathology in real time. This data-layer monetization opportunity could add an estimated USD 0.35 Billion in incremental software revenue to the Intraoral Scanner Market by 2033.

Tele-Dentistry and Remote Scanning Workflows

Cloud-connected scanners enable a general practitioner to capture a scan and transmit it instantly to a remote specialist for treatment planning [15]. Rural and underserved communities — where specialist access is limited — stand to benefit most. The WHO estimates that 3.5 Billion people globally suffer from untreated oral diseases [21], making remote-scanning workflows a scalable public-health intervention as well as a commercial opportunity.


Intraoral Scanner Market Future Outlook

AI-Driven Autonomous Scanning (2026–2029)

Next-generation scanners will increasingly operate with minimal clinician intervention. Real-time AI guidance — instructing the operator where to aim the wand, flagging incomplete scan zones, and auto-correcting motion artifacts — will reduce per-scan time from today's 3–5 minutes to under 90 seconds [13]. This speed gain directly expands the addressable patient volume per chair per day, strengthening the ROI argument for fence-sitting practices within the Intraoral Scanner Market.

Platform Economics and Ecosystem Lock-In (2028–2031)

Scanner OEMs are pivoting from hardware-margin to platform-margin business models. By embedding proprietary treatment-planning, shade-matching, and patient-communication tools into their software stacks, vendors create high switching costs. Practices that adopt a full-stack ecosystem — scanner, design software, and milling unit — reduce per-case fabrication costs by an estimated 22%, but sacrifice vendor flexibility [19]. The Intraoral Scanner Market will likely consolidate around three to four dominant platforms by the early 2030s.

Multi-Spectral and Diagnostic Expansion (2030–2033)

Prototype scanners incorporating near-infrared transillumination and fluorescence imaging can detect proximal caries, enamel demineralization, and soft-tissue anomalies during a routine impression scan [14]. If regulatory bodies approve these diagnostic claims, the scanner transitions from an impression tool to a comprehensive screening device — a shift that could unlock reimbursement pathways currently reserved for dedicated diagnostic imaging.

Sustainability and Circular-Economy Pressures (2032–2035)

Single-use impression materials generate an estimated 28,000 tonnes of clinical waste annually in the EU alone [23]. Digital scanning eliminates this waste stream entirely, aligning with tightening European medical-waste regulations and ESG reporting mandates. As sustainability metrics become procurement criteria for hospital groups and DSOs, the environmental case for scanners will reinforce the clinical and economic arguments within the Intraoral Scanner Market.


Intraoral Scanner Market Segmentation

By Type

Segment Key Metric Primary Demand Driver
Powder-Free 80% revenue share (2025) Patient comfort; faster scan times
Powder-Based 11.5% CAGR (2026–2035) Lower device cost; niche lab applications


Powder-free systems dominate the Intraoral Scanner Market because they eliminate the titanium-dioxide coating step that adds 2–3 minutes per scan and can cause patient gagging. Virtually every major OEM — Align Technology, Dentsply Sirona, 3Shape, and Medit — has shifted its flagship lineup to powder-free optics. Powder-based models persist in budget-sensitive segments and dental-education settings where the lower hardware cost (often 30–40% less than powder-free equivalents) outweighs workflow efficiency.

By Modality

Segment Key Metric Primary Demand Driver
Stand-Alone (Cart-Based) 56% revenue share (2025) High throughput; multi-operatory use
Portable (Handheld) 14.0% CAGR (2026–2035) Mobility; solo-practitioner adoption


Cart-based scanners remain the workhorse of the Intraoral Scanner Market in hospital and large-practice settings, where a single unit serves multiple operatories via a mobile cart. Portable handheld units, however, are closing the performance gap. Recent models weigh under 250 grams and connect wirelessly to tablets, making them attractive for mobile-dentistry programs and practices with limited operatory space.

By Connectivity

Segment Key Metric Primary Demand Driver
Wired 62% revenue share (2025) Stable data transfer; lower latency
Wireless 14.5% CAGR (2026–2035) Clinical ergonomics; mobile workflows


Wired scanners still lead in revenue terms because established installed bases and high-bandwidth USB-C connections deliver zero-latency scan rendering. Wireless units are gaining share rapidly as Wi-Fi 6E and Bluetooth 5.3 protocols close the throughput gap. The Intraoral Scanner Market will likely reach a wired–wireless equilibrium near 50:50 by the early 2030s.

By Application

Segment Key Metric Primary Demand Driver
Orthodontics 46% revenue share (2025) Clear-aligner production pipeline
Restorative Dentistry USD 0.21 Billion (2025) Crown-and-bridge digital workflows
Implantology 13.2% CAGR (2026–2035) Guided-surgery planning
Prosthodontics 9% revenue share (2025) Full-arch digital dentures
Others 5% revenue share (2025) Forensic dentistry; education


Orthodontics dominates because every clear-aligner case requires a baseline scan, a mid-treatment verification scan, and often a refinement scan — multiplying scanner utilization per patient episode. Implantology is the fastest-growing application; digital scan data feeds directly into surgical-guide design software, reducing implant-placement error margins from ~1.2 mm to ~0.4 mm according to a 2024 systematic review [6].

By End User

Segment Key Metric Primary Demand Driver
Hospitals 52% revenue share (2025) Bulk procurement; multi-department use
Dental Clinics 14.8% CAGR (2026–2035) Price-point compression; ROI visibility
Other End Users USD 0.07 Billion (2025) Academic institutions; mobile units


Hospitals command the largest share of the Intraoral Scanner Market by end user because centralized procurement budgets and multi-specialty departments (orthodontics, prosthodontics, oral surgery) maximize device utilization. Dental clinics, however, represent the fastest-growing channel as scanner prices fall and subscription models reduce the capital commitment. Solo and two-dentist practices that previously deferred adoption are now entering the market, particularly in suburban and semi-urban geographies.


Regional Market Share Analysis

Region Key Metric Primary Investment Themes
North America 39% revenue share (2025) Reimbursement expansion; DSO fleet upgrades
Europe 27% revenue share (2025) Lab-to-clinic digital integration; regulatory harmonization
Asia-Pacific 13.6% CAGR (2026–2035) Government digital-health mandates; rising middle-class dental spend
South America USD 0.06 Billion (2025) Dental tourism; urban clinic modernization
Middle East & Africa 5% revenue share (2025) Medical-city developments; public-health digitization
Total USD 0.87 Billion (2025)

The Intraoral Scanner Market exhibits distinct regional dynamics shaped by reimbursement structures, dental-workforce density, and digital-infrastructure maturity.


North America

Country Key Metric Key Driver
United States 72% of regional revenue CDT digital-impression code; DSO consolidation
Canada 11.5% CAGR Provincial dental-benefit expansion (2025)
Mexico USD 0.02 Billion Dental-tourism inflows from U.S. patients


The United States dominates the North American Intraoral Scanner Market, underpinned by over 200,000 practicing dentists and a well-established reimbursement framework. The 2024 CDT code update directly incentivizes scanner use, while large DSOs — managing 15% of U.S. practices — are standardizing digital-impression protocols across their networks [1]. Canada's federal dental-benefit program, fully operational since 2025, is expected to drive scanner purchases among newly eligible family-practice clinics [2].

Europe

Country Key Metric Key Driver
Germany 24% of regional revenue BEMA code reform; dense dental-lab network
United Kingdom 12.3% CAGR NHS digital-dentistry pilots
France 16% of regional revenue Social-security orthodontic coverage
Italy 12% of regional revenue Aesthetic-dentistry demand
Spain 11.8% CAGR Dental-tourism growth
Nordic Countries 8% of regional revenue Public dental-service digitization
Russia USD 0.01 Billion Limited current adoption
Rest of Europe 10% of regional revenue Varied regulatory environments


Germany's 55,000-strong dental-lab sector provides a natural downstream market for digitally captured impressions, accelerating scanner ROI for practices that outsource fabrication. The UK's NHS has piloted digital-impression pathways in 40 community dental clinics since 2024, with full rollout planned by 2027 [8]. Southern European markets — Italy and Spain — benefit from cosmetic-dentistry and dental-tourism tailwinds that justify premium scanner investments.

Asia-Pacific

Country Key Metric Key Driver
China 35% of regional revenue Healthy China 2030; urban hospital upgrades
India 14.2% CAGR New dental graduates; Mudra Loan financing
Japan 25% of regional revenue Aging population; high per-capita dental spend
South Korea 13.5% CAGR K-beauty-driven cosmetic dentistry
ASEAN 8% of regional revenue Medical-tourism hubs (Thailand, Vietnam)
Rest of Asia-Pacific 7% of regional revenue Emerging digital infrastructure


China's hospital procurement cycle is a primary growth engine: the National Health Commission's 2024 equipment-refresh directive allocated digital scanners as priority-tier devices for provincial hospitals with over 500 beds [4]. India's dental-technology landscape is shifting rapidly as private equity-backed chain clinics deploy scanners to differentiate service offerings in competitive urban corridors such as Delhi-NCR and Bengaluru.

South America

Country Key Metric Key Driver
Brazil 52% of regional revenue Largest dental workforce in Latin America
Argentina 12.6% CAGR Growing cosmetic-dentistry segment
Rest of South America 25% of regional revenue Gradual digital-workflow adoption


Brazil employs over 370,000 registered dentists — one of the highest per-capita ratios globally — yet scanner penetration remains in the low single digits, signaling substantial runway for the Intraoral Scanner Market [12]. Currency volatility and import tariffs on medical devices remain headwinds, though São Paulo-based distributor networks are expanding leasing options to offset capital barriers.

Middle East & Africa

Country Key Metric Key Driver
Saudi Arabia 28% of regional revenue Vision 2030 healthcare investment
UAE 13.2% CAGR Dubai/Abu Dhabi medical-city expansions
South Africa 18% of regional revenue Private-sector dental modernization
Egypt 12.8% CAGR Growing urban middle class
Rest of MEA 24% of regional revenue NGO-supported oral-health programs


Saudi Arabia's Vision 2030 has channeled over USD 65 billion into healthcare infrastructure, with dental digitization forming a core pillar of the Kingdom's smart-hospital strategy [22]. The UAE benefits from medical-tourism inflows and a regulatory environment that fast-tracks device approvals, making it a regional showcase for advanced scanner technology.


Intraoral Scanner Market By Region, 2025-2035

Competitive Benchmarking

The Intraoral Scanner Market exhibits medium concentration, with the top five companies accounting for an estimated 65–72% of global revenue. The Herfindahl-Hirschman Index sits in the 1,200–1,600 range, indicating a moderately competitive landscape where established medtech incumbents compete alongside agile scanner-specialist challengers. Product differentiation hinges on scan speed, AI software capabilities, and ecosystem breadth (scanner-to-mill-to-lab integration).

Company Est. Revenue Share Range Key Offerings Strategic Positioning
Align Technology ~18–22% iTero Element 5D, iTero Lumina Vertically integrated aligner-scanner ecosystem
Dentsply Sirona ~15–19% CEREC Primescan 2, Omnicam Full chairside CAD/CAM workflow leader
3Shape ~13–16% TRIOS 5, TRIOS Move+ Open-architecture platform; lab partnerships
Medit Corp ~8–11% i700, i900 Price-disruptor; open STL export
Planmeca ~5–8% Emerald S Integrated imaging-suite strategy
Carestream Dental ~4–6% CS 3800 Mid-market value positioning
Envista Holdings ~3–5% DEXIS IS ScanFlow DSO-focused bundled solutions
Straumann Group ~3–5% Virtuo Vivo Implant-workflow integration
Midmark Corporation ~2–4% IQvitals, dental-integration modules Operatory-ecosystem approach
Shining 3D ~2–3% Aoralscan 3 Cost-effective Asia-Pacific challenger


Recent News & Developments

  • November 2025: Shining 3D Dental introduced the Aoralscan Elf, highlighting that it weighs only 106 grams, making it one of the lightest intraoral scanners. With a price range of about USD 12,000, this new model targets a different market niche while building on the technologies of the earlier Aoralscan Elite series. With this launch, Shining 3D hopes to increase its market share in the dental scanning sector.
  • October 2025: The Dandy Vision intraoral scanner was unveiled by Dandy, a completely computerized dentistry office in New York City. The device uses sophisticated optics and AI-powered analysis to improve scanning speed, accuracy, and clarity. The goal of this innovation is to increase dental workflows' accuracy and efficiency.
  • In July 2025, Medit unveiled the i900 Mobility, a new intraoral scanner that may be used in a variety of therapeutic contexts. Chairside, mobile care, and multi-chair practices can all benefit from the device's wireless scanning capabilities and simple setup. This development improves dental workflows' efficiency and flexibility.


Intraoral Scanner Market Report Scope

Parameter Detail
Market Scope Global Intraoral Scanner Market — hardware, software, and services
Study Period 2021–2035
CAGR (Forecast Period) 11.8% (2026–2035)
Base Year Market Size USD 0.87 Billion (2025)
Forecast Endpoint USD 2.62 Billion (2035)
Fastest Growing Segment Portable scanners (by modality); Dental Clinics (by end user)
Companies Profiled 10+ (Align Technology, Dentsply Sirona, 3Shape, Medit, Planmeca, and others)
Valuation Currency USD Billion


FAQs

What is the typical payback period for a mid-range intraoral scanner in a general-practice setting?
Most mid-range scanners (USD 25,000–35,000) reach payback within 14–20 months when a practice performs at least 12 digital-impression cases per week, factoring in material savings and reduced remakes [7].
How does scanner accuracy compare between powder-free and powder-based systems for full-arch impressions?
Independent studies show comparable trueness (±30 µm) for both types in single-arch scans, but powder-free units maintain accuracy more consistently across full-arch cases due to uninterrupted scan paths [6].
Which Intraoral Scanner Market segment offers the strongest near-term investment upside?
Portable wireless scanners targeting solo practitioners represent the highest-growth niche, combining hardware sales with recurring software-subscription revenue [9].
Are open-architecture scanners gaining ground against closed-ecosystem models in the Intraoral Scanner Market?
Open-format exporters like Medit are pressuring incumbents, but closed ecosystems retain loyalty through integrated AI diagnostics and faster lab turnaround [19].
What regulatory hurdles remain for AI-diagnostic claims embedded in intraoral scanners?
OEMs must secure separate FDA clearance for each diagnostic indication (caries, periodontal, soft-tissue), a process averaging 12–18 months per claim [13].
How is the Intraoral Scanner Market adapting to tele-dentistry workflows?
Cloud-connected scanners now support real-time scan sharing with remote specialists, enabling treatment planning for underserved communities without on-site specialty coverage [15].
What role does 3D printing integration play in scanner purchasing decisions?
Practices evaluating scanners increasingly prioritize compatibility with sub-USD 10,000 chairside printers, seeking same-day delivery of surgical guides and provisional restorations [14].    
What is the current size of the intraoral scanner market?
The intraoral scanner market reached USD 0.87 billion in 2025 and is projected to reach USD 2.62 billion by 2035.
What is the CAGR of the intraoral scanner market?
The intraoral scanner market is projected to grow at a CAGR of 11.8% during the forecast period 2026–2035.
Which region leads the intraoral scanner market?
North America holds the largest share at 39%, while Asia-Pacific is the fastest-growing region at 13.6% CAGR.
Author
Author
Author Profile
Rahul Gotadki LinkedIn
Research Manager
He holds an experience of about 9+ years in Market Research and Business Consulting, working under the spectrum of Life Sciences and Healthcare domains. Rahul conceptualizes and implements a scalable business strategy and provides strategic leadership to the clients. His expertise lies in market estimation, competitive intelligence, pipeline analysis, customer assessment, etc.
Co-Author
Co-Author Profile
Kinjoll Dey LinkedIn
Senior Research Analyst
He is an extremely curious individual currently working in Healthcare and Medical Devices Domain. Kinjoll is comfortably versed in data centric research backed by healthcare educational background. He leverages extensive data mining and analytics tools such as Primary and Secondary Research, Statistical Analysis, Machine Learning, Data Modelling. His key role also involves Technical Sales Support, Client Interaction and Project management within the Healthcare team. Lastly, he showcases extensive affinity towards learning new skills and remain fascinated in implementing them.
Download Free Sample

Kindly complete the form below to receive a free sample of this Report

Download PDF ×

We do not share your information with anyone. However, we may send you emails based on your report interest from time to time. You may contact us at any time to opt-out.
















