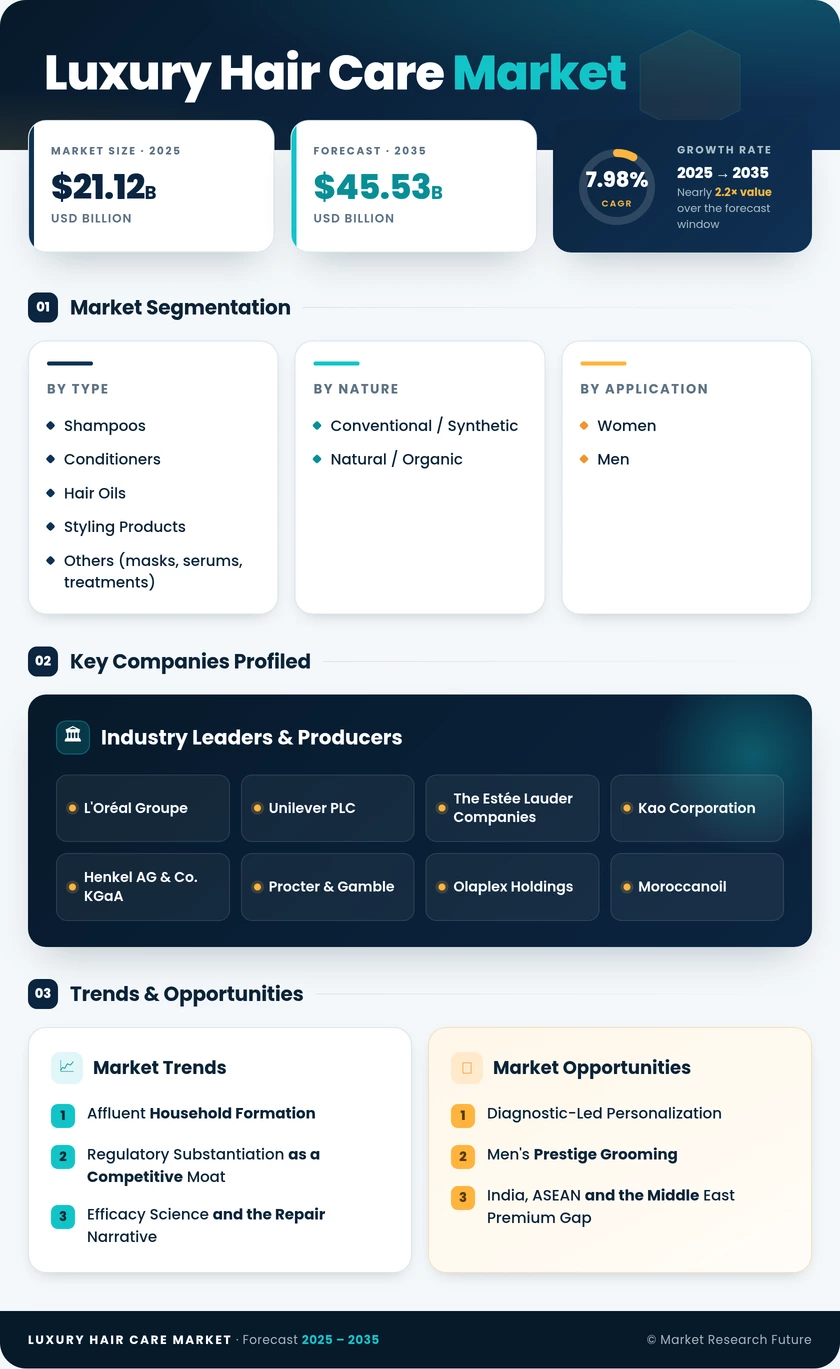
Luxury Hair Care Market (2026 - 2035)

Luxury Hair Care Market Size, Share, Industry Trend & Analysis Research Report Information By Product Type (Shampoos, Conditioners, Hair Oils, Styling Products, Others), By Nature (Conventional / Synthetic, Natural / Organic), By End User (Women, Men), By Distribution Channel (Hypermarkets and Supermarkets, Specialty Stores, Online Retail Stores, Others), By Geography (North America, Europe, Asia-Pacific, South America, Middle East & Africa) – Forecast Till 2035

Forecast Period
2026-2035
CAGR
7.98%
2025 Market Size
USD 21.12 Billion
2035 Market Size
USD 45.53 Billion
Consumer and Retail ● Updated August 2026 Report ID: MRFR/CG/20327-HCR | Pages: 128 | Author: Tejas Chaudhary
  1. 1 Market Summary |
    1. 1.1 Study Assumptions & Market Definition |
    2. 1.2 Scope of the Study |
    3. 1.3 Research Methodology
  2. 2 Key Report Takeaways |
    1. 2.1 By Product Type |
    2. 2.2 By Nature and End User |
    3. 2.3 By Geography
  3. 3 Market Size & Forecast (2021–2035) |
    1. 3.1 Historical Market Size (2021–2025) |
    2. 3.2 Current & Forecast Market Size (2026–2035) |
    3. 3.3 Year-over-Year Growth Analysis
  4. 4 Driver Impact Analysis |
    1. 4.1 Affluent Household Formation |
    2. 4.2 Regulatory Substantiation as a Competitive Moat |
    3. 4.3 Efficacy Science and the Repair Narrative |
    4. 4.4 Creator Commerce and Conversion Compression
  5. 5 Restraints Impact Analysis |
    1. 5.1 Trade-Down Behaviour in Soft Consumption Cycles |
    2. 5.2 Counterfeits and Channel Leakage |
    3. 5.3 Claim Risk Under Tightening Disclosure Rules
  6. 6 Opportunity Analysis |
    1. 6.1 Diagnostic-Led Personalization |
    2. 6.2 Men's Prestige Grooming |
    3. 6.3 India, ASEAN and the Middle East Premium Gap |
    4. 6.4 Refill Systems and Circular Packaging |
    5. 6.5 First-Party Data Monetization |
    6. 6.6 Industry Value Chain Analysis |
    7. 6.7 Porter's Five Forces Analysis
  7. 7 Regional Market Share & Country-Level Analysis |
    1. 7.1 North America | |
      1. 7.1.1 US | |
      2. 7.1.2 Canada | |
      3. 7.1.3 Mexico |
    2. 7.2 Europe | |
      1. 7.2.1 Germany | |
      2. 7.2.2 UK | |
      3. 7.2.3 France | |
      4. 7.2.4 Italy | |
      5. 7.2.5 Spain | |
      6. 7.2.6 Nordic Countries | |
      7. 7.2.7 Russia | |
      8. 7.2.8 Rest of Europe |
    3. 7.3 Asia-Pacific | |
      1. 7.3.1 China | |
      2. 7.3.2 India | |
      3. 7.3.3 Japan | |
      4. 7.3.4 South Korea | |
      5. 7.3.5 ASEAN | |
      6. 7.3.6 Rest of Asia-Pacific |
    4. 7.4 South America | |
      1. 7.4.1 Brazil | |
      2. 7.4.2 Argentina | |
      3. 7.4.3 Rest of South America |
    5. 7.5 Middle East & Africa | |
      1. 7.5.1 Saudi Arabia | |
      2. 7.5.2 UAE | |
      3. 7.5.3 South Africa | |
      4. 7.5.4 Egypt | |
      5. 7.5.5 Rest of Middle East & Africa
  8. 8 Future Outlook (2026–2035) |
    1. 8.1 Diagnostics and Algorithmic Regimen Design |
    2. 8.2 Platform Economics and Retail Media |
    3. 8.3 Biotech Actives and Ingredient Supply |
    4. 8.4 Sustainability Disclosure and Circularity
  9. 9 Market Segmentation Analysis |
    1. 9.1 By Product Type | |
      1. 9.1.1 Shampoos | |
      2. 9.1.2 Conditioners | |
      3. 9.1.3 Hair Oils | |
      4. 9.1.4 Styling Products | |
      5. 9.1.5 Others (Masks, Serums, Treatments) |
    2. 9.2 By Nature | |
      1. 9.2.1 Conventional / Synthetic | |
      2. 9.2.2 Natural / Organic |
    3. 9.3 By End User | |
      1. 9.3.1 Women | |
      2. 9.3.2 Men |
    4. 9.4 By Distribution Channel | |
      1. 9.4.1 Hypermarkets and Supermarkets | |
      2. 9.4.2 Specialty Stores | |
      3. 9.4.3 Online Retail Stores | |
      4. 9.4.4 Others (Salons, Travel Retail, Pharmacies)
  10. 10 Competitive Landscape |
    1. 10.1 Market Concentration Analysis (2026) |
    2. 10.2 Competitive Benchmarking Matrix |
    3. 10.3 Company Profiles | |
      1. 10.3.1 L'Oréal Groupe | |
      2. 10.3.2 Unilever PLC | |
      3. 10.3.3 The Estée Lauder Companies | |
      4. 10.3.4 Kao Corporation | |
      5. 10.3.5 Henkel AG & Co. KGaA | |
      6. 10.3.6 Shiseido Company | |
      7. 10.3.7 Wella Company | |
      8. 10.3.8 Procter & Gamble | |
      9. 10.3.9 Olaplex Holdings | |
      10. 10.3.10 Moroccanoil | |
      11. 10.3.11 Amorepacific Corporation | |
      12. 10.3.12 Davines Group
  11. 11 Recent News & Developments
  12. 12 Report Scope & Methodology |
    1. 12.1 Study Period & Base Year |
    2. 12.2 Data Sources & Estimation Framework |
    3. 12.3 Abbreviations
  13. 13 Detailed Sources & Citations
  14. 14 Frequently Asked Questions
  15. 15 LIST OF TABLES |
  16. TABLE 1 Global Luxury Hair Care Market Size & Forecast, by Revenue (USD Billion), 2021–2035 |
  17. TABLE 2 Global Luxury Hair Care Market – Year-over-Year Growth Analysis, 2021–2035 |
  18. TABLE 3 Driver Impact Analysis Matrix, 2026–2035 |
  19. TABLE 4 Restraint Impact Analysis Matrix, 2026–2035 |
  20. TABLE 5 Global Market Size, by Region, 2021–2035 (USD Billion) |
  21. TABLE 6 North America Market Size, by Country, 2021–2035 (USD Billion) |
  22. TABLE 7 Europe Market Size, by Country, 2021–2035 (USD Billion) |
  23. TABLE 8 Asia-Pacific Market Size, by Country, 2021–2035 (USD Billion) |
  24. TABLE 9 South America Market Size, by Country, 2021–2035 (USD Billion) |
  25. TABLE 10 Middle East & Africa Market Size, by Country, 2021–2035 (USD Billion) |
  26. TABLE 11 Global Market Size, by Product Type, 2021–2035 (USD Billion) |
  27. TABLE 12 Global Market Size, by Nature, 2021–2035 (USD Billion) |
  28. TABLE 13 Global Market Size, by End User, 2021–2035 (USD Billion) |
  29. TABLE 14 Global Market Size, by Distribution Channel, 2021–2035 (USD Billion) |
  30. TABLE 15 North America Market Size, by Product Type and Distribution Channel, 2021–2035 (USD Billion) |
  31. TABLE 16 Europe Market Size, by Product Type and Distribution Channel, 2021–2035 (USD Billion) |
  32. TABLE 17 Asia-Pacific Market Size, by Product Type and Distribution Channel, 2021–2035 (USD Billion) |
  33. TABLE 18 South America Market Size, by Product Type and Distribution Channel, 2021–2035 (USD Billion) |
  34. TABLE 19 Middle East & Africa Market Size, by Product Type and Distribution Channel, 2021–2035 (USD Billion) |
  35. TABLE 20 Competitive Benchmarking Matrix, 2026 |
  36. TABLE 21 Company Profiles – Key Players |
  37. TABLE 22 Recent Developments & Strategic Announcements, 2023–2025 |
  38. TABLE 23 Report Scope & Methodology Summary |
  39. TABLE 24 Detailed Sources & Citations Index
  40. 16 LIST OF FIGURES |
  41. FIGURE 1 Market Dynamics – Drivers, Restraints and Opportunities Overview |
  42. FIGURE 2 Industry Value Chain Analysis – Luxury Hair Care |
  43. FIGURE 3 Porter's Five Forces Assessment |
  44. FIGURE 4 Global Market Size Trend, 2021–2035 (USD Billion) |
  45. FIGURE 5 Year-over-Year Growth Trajectory, 2022–2035 (%) |
  46. FIGURE 6 Market Share by Product Type, 2025 vs 2035 (%) |
  47. FIGURE 7 Market Share by Nature, 2025 vs 2035 (%) |
  48. FIGURE 8 Market Share by End User, 2025 vs 2035 (%) |
  49. FIGURE 9 Market Share by Distribution Channel, 2025 vs 2035 (%) |
  50. FIGURE 10 Regional Market Share, 2025 (%) |
  51. FIGURE 11 Regional CAGR Comparison, 2026–2035 (%) |
  52. FIGURE 12 Country-Level Contribution Heatmap, 2025 |
  53. FIGURE 13 Competitive Landscape – Estimated Revenue Share Bands, 2026 |
  54. FIGURE 14 Strategic Positioning Matrix – Innovation vs Distribution Reach |
  55. FIGURE 15 Pricing Tier Architecture Across Prestige Haircare
Share::
Request Free Sample

Segmentation Quick Reference

DimensionSub-SegmentsDominant SegmentFastest Growing Segment
By Product TypeShampoos; Conditioners; Hair Oils; Styling Products; Others (Masks, Serums, Treatments)ShampoosHair Oils
By NatureConventional / Synthetic; Natural / OrganicConventional / SyntheticNatural / Organic
By End UserWomen; MenWomenMen
By Distribution ChannelHypermarkets and Supermarkets; Specialty Stores; Online Retail Stores; OthersSpecialty StoresOnline Retail Stores
By GeographyNorth America; Europe; Asia-Pacific; South America; Middle East & AfricaEuropeAsia-Pacific


Market Segmentation Overview

By Product Type

Sub-SegmentKey Trend
ShampoosConcentrated and sulphate-free formats lift per-millilitre value without raising shelf price.
ConditionersLeave-in and hybrid treatment formats blur the line with weekly masks.
Hair OilsHeritage ritual formats repositioned as pre-wash and finishing steps for global audiences.
Styling ProductsHeat-protection and flexible-hold formulations replace legacy fixative chemistry.
Others (Masks, Serums, Treatments)Scalp-focused serums and microbiome propositions drive the fastest occasion expansion.


By Nature

Sub-SegmentKey Trend
Conventional / SyntheticPerformance chemistry retains majority share on proven efficacy and cost-efficient scale.
Natural / OrganicBiotech-derived actives and third-party certification close the historical efficacy gap


Certification has become the deciding variable. Where consumers once accepted "natural" as a marketing adjective, verifiable standards now carry the persuasion, and brands without third-party validation increasingly lose the argument at shelf.

By End User

Sub-SegmentKey Trend
WomenColour-treated maintenance and multi-step regimens sustain the highest basket values.
MenThinning management and scalp health drive routine expansion from one product to three


Male adoption follows a predictable ladder: shampoo first, then a scalp product, then a styling finisher. Brands that map their assortment to that sequence convert far better than those presenting a full regimen at once.

By Distribution Channel

Sub-SegmentKey Trend
Hypermarkets and SupermarketsPrestige shop-in-shop formats bring premium tiers into weekly shopping trips.
Specialty StoresTrained advisory staff and assortment authority anchor discovery for high-ticket regimens
Online Retail StoresSubscription replenishment and creator conversion compress the path from awareness to purchase.
Others (Salons, Travel Retail, Pharmacies)Stylist endorsement and duty-free trial function as high-credibility acquisition channels


Channel economics now determine brand strategy more than product portfolio does. Owning the replenishment relationship — wherever discovery happened — is the structural advantage that will separate winners over the forecast decade.


Share::
Request Free Sample
Download PDF ×

We do not share your information with anyone. However, we may send you emails based on your report interest from time to time. You may contact us at any time to opt-out.