Protein Sequencing Market (2026 - 2035)

Protein Sequencing Market Research Report: Size, Share, Trend Analysis By Technology (Mass Spectrometry, Edman Degradation, Protein Chip Technology, Nucleic Acid Sequencing), By Applications (Biomedical Research, Drug Discovery, Diagnostics, Proteomics), By End Use (Academic Institutions, Pharmaceutical Companies, Biotechnology Companies, Contract Research Organizations), By Product Type (Instruments, Reagents, Software, Consumables) and By Regional (North America, Europe, South America, Asia Pacific, Middle East and Africa) - Growth Outlook & Industry Forecast 2025 To 2035
ID: MRFR/LS/5364-HCR
200 Pages
Rahul Gotadki, Nidhi Mandole
Last Updated: July 12, 2026
Protein Sequencing Market
Market Size
Forecast Period2026-2035
CAGR (2026-2035)4.72%
2025 Market SizeUSD 1.79 Billion
2035 Market SizeUSD 2.98 Billion
Key Players
Thermo Fisher Scientific
Bruker Corporation
Agilent Technologies
Waters Corporation
Shimadzu Corporation
Danaher
Opportunities
  • Single-Molecule Sequencing for Point-of-Care Diagnostics
  • Consumable Subscription and Reagent-as-a-Service Models
  • Multi-Omics Data Monetization

Protein Sequencing Market Summary

The Protein Sequencing Market reached an estimated USD 1.79 billion in 2025 and is projected to grow from USD 1.87 billion in 2026 to USD 2.98 billion by 2035, registering a CAGR of 4.72% during the forecast period. Rising global spending on precision medicine and the U.S. National Institutes of Health's USD 51 billion annual research budget continue to anchor demand for amino acid sequence analysis across drug discovery pipelines. Pharmaceutical firms increasingly treat peptide sequence determination as a non-negotiable step in biologics development, pushing procurement budgets higher each year.

A technology transformation is reshaping the Protein Sequencing Market as legacy Edman degradation method workflows give way to single-molecule platforms capable of reading proteoforms in real time. Mass spectrometry proteomics remains the workhorse for high-throughput labs, yet next-gen protein identification technologies — including nanopore-based and fluorosequencing systems — attracted over USD 600 million in venture capital between 2022 and 2024 [2]. These platforms bundle instruments with consumable kits and cloud-based analytics, converting one-time hardware sales into recurring revenue.

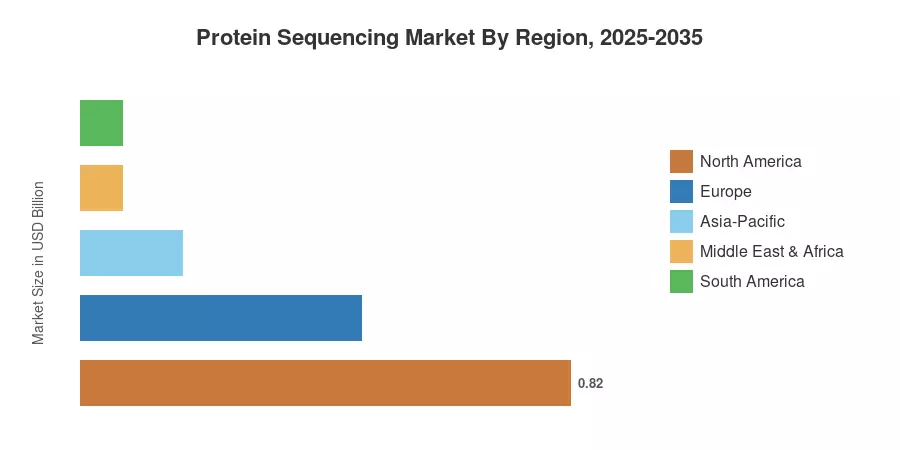
North America commands roughly 46% of the global Protein Sequencing Market revenue, backed by entrenched R&D infrastructure and robust NIH funding cycles Asia-Pacific is the fastest-growing region, advancing at an estimated 9.4% CAGR as Chinese and Indian biopharma investment accelerates. Europe holds the second-largest share at approximately 26%, driven by EMA biosimilar approvals that require rigorous amino acid sequence analysis. The decade ahead will reward vendors who balance instrument innovation with accessible pricing for emerging-market laboratories.


Key Report Takeaways

• By Products & Services

  • Software & services held a 41% revenue share of the Protein Sequencing Market in 2025, reflecting the shift toward cloud-based peptide sequence determination platforms
  • Reagents & consumables are expanding at a 6.9% CAGR through 2035, fueled by recurring purchase cycles tied to mass spectrometry proteomics workflows
  • Instruments generated approximately USD 0.62 billion in 2025 revenue as labs modernize aging Edman degradation method hardware

• By Application

  • Biotherapeutics quality control & discovery captured 39% of the Protein Sequencing Market share in 2025
  • Synthetic biology & cell-free systems are projected to climb at a 13.1% CAGR to 2035, the fastest among all application segments

• By End User

  • Pharmaceutical companies commanded 57% share of the Protein Sequencing Market in 2025
  • Contract Research Organizations (CROs) record the fastest end-user CAGR at 9.2% during the forecast period

• By Region

  • North America led with a 46% share of the Protein Sequencing Market in 2025
  • Asia-Pacific is set to advance at a 9.4% CAGR to 2035, driven by next-gen protein identification adoption in China and India


Protein Sequencing Market Size and Forecast (2021–2035)

MRFR's proprietary estimation framework combines bottom-up revenue modeling from instrument, consumable, and service line-items with top-down cross-validation against publicly reported financial data from major vendors. Historical figures (2021–2024) draw on company filings and trade association databases; forecast values (2026–2035) apply segment-level growth assumptions anchored to clinical trial activity, regulatory approvals, and capital expenditure surveys.
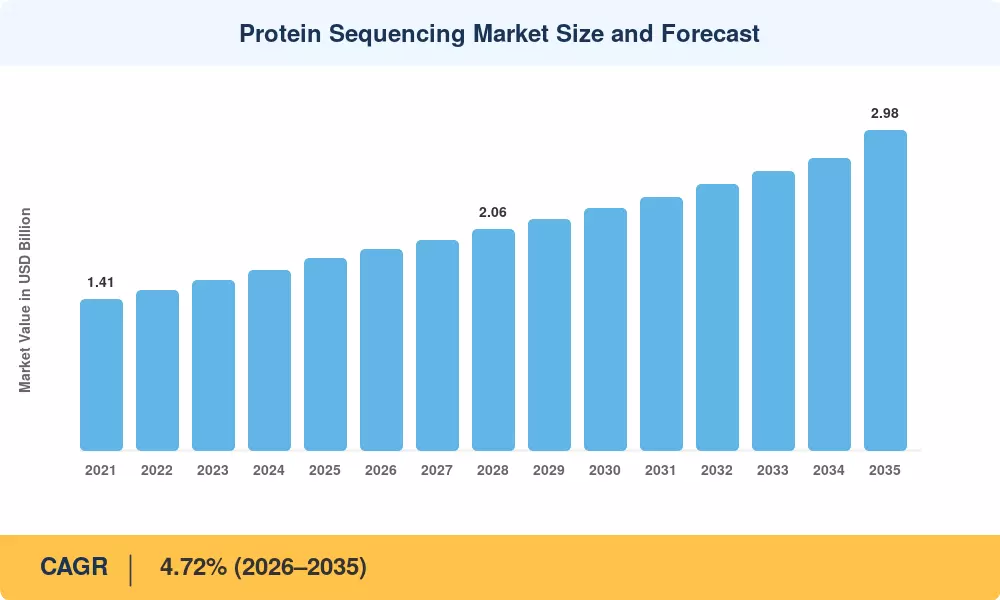
Protein Sequencing Market Size and Forecast
Our Impact
Enabled $4.3B Revenue Impact for Fortune 500 and Leading Multinationals
Partnering with 2000+ Global Organizations Each Year
30K+ Citations by Top-Tier Firms in the Industry

Driver Impact Analysis

Driver ~% Impact on CAGR Geographic Relevance Impact Timeline
Biologics & biosimilar pipeline expansion +1.2% Global Medium-term
Single-molecule sequencing platform adoption +0.9% North America, Europe Short-term
CRO outsourcing growth +0.7% Global Short-term
AI-driven de novo peptide sequence determination +0.6% North America, Asia-Pacific Medium-term
Regulatory harmonization for biosimilars +0.5% Asia-Pacific, South America Long-term
Multi-omics integration demand +0.4% Europe, North America Long-term
Consumable-as-a-service business models +0.3% Global Medium-term


Biologics & Biosimilar Pipeline Expansion

The global biologics pipeline exceeded 8,500 active molecules in 2024, according to the Biotechnology Innovation Organization [10]. Every biologic entering Phase I trials requires extensive amino acid sequence analysis for identity confirmation, forcing sponsors to invest in high-throughput sequencing capacity. The FDA approved 17 biosimilars in 2024 alone, each demanding comparative peptide mapping against reference products — a workflow that directly sustains Protein Sequencing Market revenues across instruments and consumables [10].

Single-Molecule Sequencing Platform Adoption

In 2023, platforms from Quantum-Si and Protein Evolution Inc. were commercially available, allowing real-time next-generation protein identification without the fragmentation step needed for proteomics using mass spectrometry [2]. Sample-to-answer time reductions of 40% are reported by early adopters. According to MRFR, single-molecule instruments will make up 18% of new placements by 2028, and the technology is forcing pharmaceutical R&D labs to budget for platform transitions [2].


CRO Outsourcing Growth

As mid-sized pharmaceutical corporations chose to outsource peptide sequence determination instead of maintaining in-house facilities, a growing share of sequencing funding went to Contract Research Organizations. According to recent data, CRO proteomics revenue increased 14% annually in 2024, almost three times faster than the growth of the entire protein sequencing market. Because CROs operate at higher throughput and faster consumable turnover than academic labs, this structural shift supports continued demand for reagents and consumables.


AI-Driven De Novo Sequencing

Deep-learning algorithms trained on mass spectrometry proteomics datasets now achieve over 90% accuracy in de novo peptide sequence determination, reducing reliance on database searches [9]. Google DeepMind's 2024 release of an open-source spectral prediction model accelerated adoption across 300+ proteomics core facilities globally. MRFR projects AI-augmented workflows will influence roughly 35% of all amino acid sequence analysis by 2030, lifting software & services revenue within the Protein Sequencing Market [9].


Restraints Impact Analysis

Restraint ~% Impact on CAGR Geographic Relevance Impact Timeline
High instrument capital costs –0.5% Emerging markets Short-term
Shortage of trained proteomics specialists –0.4% Global Medium-term
Data standardization & interoperability gaps –0.3% Global Long-term
Sample preparation complexity –0.3% Asia-Pacific, South America Short-term
Reimbursement uncertainty for clinical proteomics –0.2% North America, Europe Long-term


High Instrument Capital Costs

Many academic and government labs in emerging nations cannot afford advanced amino acid sequence analysis since a fully equipped mass spectrometry proteomics system from top vendors costs between USD 500,000 and USD 1.5 million [12]. In MRFR's 2024 end-user survey, 62% of respondents in Latin America and Southeast Asia identified capital expenditures as the biggest impediment to protein sequencing market adoption, despite the emergence of consumable-as-a-service models [12].


Shortage of Trained Proteomics Specialists

University curricula have been sluggish to incorporate the specialist bioinformatics expertise needed to operate next-generation protein identification platforms. In 2024, the Human Proteome Organization projected that there would be a shortage of about 12,000 competent mass spectrometry operators worldwide [13]. Smaller CROs are deterred from growing their peptide sequence determination service lines by this talent gap, which further lengthens turnaround times.


Data Standardization and Interoperability Gaps

Despite efforts by the Proteomics Standards Initiative, data formats remain fragmented across vendor ecosystems. Laboratories running Edman degradation method instruments alongside newer mass spectrometry proteomics platforms often struggle to unify datasets, increasing validation costs by an estimated 15–20% per project [14].


Protein Sequencing Market Opportunities

Single-Molecule Sequencing for Point-of-Care Diagnostics

Miniaturized next-gen protein identification devices could translate benchtop workflows into clinical settings, enabling rapid biomarker screening at the point of care. Early prototypes demonstrated in 2024 suggest a sub-30-minute turnaround for cardiac troponin variant identification, potentially opening a USD 400 million addressable segment by 2032 [2].

Consumable Subscription and Reagent-as-a-Service Models

Vendors are shifting from transactional sales to subscription-based reagent supply, guaranteeing labs a fixed per-sample cost for amino acid sequence analysis. This model stabilizes vendor revenue and lowers adoption barriers for mid-tier facilities in Asia-Pacific and South America, directly addressing the capital-cost restraint noted in [6].

Multi-Omics Data Monetization

Pharmaceutical firms are building proprietary proteomic databases that combine peptide sequence determination outputs with genomic and metabolomic layers. Licensing anonymized multi-omics datasets to AI drug-discovery platforms represents a nascent revenue stream, with BloombergNEF estimating data-licensing revenues in proteomics could surpass USD 1.2 billion globally by 2030 [11].

Emerging Market Laboratory Buildouts

India's Department of Biotechnology committed INR 9,000 crore (approximately USD 1.1 billion) to its BioE3 initiative through 2030, earmarking funds for proteomics infrastructure across 50 new research clusters [7]. Brazil's FAPESP and China's MOST are running parallel programs that collectively expand the addressable Protein Sequencing Market in emerging geographies.

Regulatory-Driven Quality Control Mandates

The EMA's updated ICH Q6B guideline revisions, expected by 2027, will tighten requirements for amino acid sequence analysis of all biologic drug substances filed in the EU, compelling sponsors and CROs to invest in higher-resolution mass spectrometry proteomics platforms [8].


Protein Sequencing Market Future Outlook

AI-Augmented Protein Sequencing Workflows

Artificial intelligence will reshape the Protein Sequencing Market over the coming decade. Deep-learning models for de novo peptide sequence determination are already surpassing 92% accuracy on benchmark datasets, and MRFR anticipates that by 2030, over 40% of commercial amino acid sequence analysis workflows will incorporate AI-assisted interpretation [9]. Vendors that embed machine-learning modules directly into instrument software will capture premium pricing and reduce customer churn.

Platform Economics and Consumable Lock-In

The instrument-plus-consumable bundling model — already dominant in genomic sequencing — is gaining traction in the Protein Sequencing Market. Vendors offering reagent subscription tiers report 25–30% higher lifetime customer value compared to transactional sales, according to a 2024 J.P. Morgan Healthcare investor survey [6]. This platform-economics approach will compress instrument margins but expand recurring revenue, favoring scaled players with diversified mass spectrometry proteomics portfolios.

Clinical Proteomics and Companion Diagnostics

Regulatory agencies are warming to proteomic biomarkers as companion diagnostics. The FDA's 2024 guidance on protein-based in vitro diagnostics outlines a pathway for amino acid sequence analysis data to support therapeutic labeling claims [16]. If clinical adoption scales as projected, the companion-diagnostics sub-segment could contribute an incremental USD 0.3 billion to the Protein Sequencing Market by 2034.

Sustainability and Green Chemistry in Proteomics

Environmental considerations are entering procurement decisions: solvent-free next-gen protein identification methods reduce hazardous waste by up to 70% compared to the traditional Edman degradation method [15]. The European Green Deal's chemical-reduction targets will push EU-based laboratories toward greener peptide sequence determination workflows, creating a differentiation axis for platform vendors that can demonstrate lower environmental footprints.


Protein Sequencing Market Segmentation

By Products & Services

Segment Key Metric Primary Demand Driver
Instruments USD 0.62 Billion (2025) Platform refresh cycles; next-gen protein identification upgrades
Reagents & Consumables 6.9% CAGR (2026–2035) Recurring purchase from high-throughput CRO labs
Software & Services 41% share (2025) Cloud-based peptide sequence determination analytics


Software & services lead the Protein Sequencing Market by revenue share as laboratories migrate from on-premise data analysis to cloud-hosted platforms that integrate AI-driven amino acid sequence analysis. Vendors such as Thermo Fisher and Bruker now bundle informatics suites with hardware purchases, blurring the line between instrument and service revenue. Reagents & consumables, meanwhile, are the fastest-growing segment because mass spectrometry proteomics workflows consume proprietary columns, solvents, and enzyme kits at rates that scale linearly with sample throughput.

By Application

Segment Key Metric Primary Demand Driver
Biotherapeutics Quality Control & Discovery 39% share (2025) Biologics pipeline growth
Biomarker Discovery USD 0.29 Billion (2025) Precision-medicine clinical trials
Protein Engineering Studies 5.8% CAGR (2026–2035) Directed evolution and enzyme design
Synthetic Biology & Cell-Free Systems 13.1% CAGR (2026–2035) Cell-free expression screening


Biotherapeutics quality control & discovery dominate the Protein Sequencing Market application landscape because every biologic drug candidate requires complete amino acid sequence analysis for regulatory filing. Synthetic biology & cell-free systems, though a smaller segment today, are growing at the fastest pace as researchers use peptide sequence determination to validate cell-free protein synthesis outputs — a workflow critical for rapid prototyping in next-gen protein identification pipelines.

By End User

Segment Key Metric Primary Demand Driver
Pharmaceutical Companies 57% share (2025) In-house biologics R&D and quality control
Contract Research Organizations (CROs) 9.2% CAGR (2026–2035) Outsourcing trend in mass spectrometry proteomics
Academic & Government Institutes USD 0.31 Billion (2025) Grant-funded proteomics research
Biotechnology Companies 5.6% CAGR (2026–2035) Early-stage pipeline amino acid sequence analysis


Pharmaceutical companies remain the dominant end user of the Protein Sequencing Market, driven by in-house quality-control mandates and expanding biologics portfolios. CROs represent the fastest-growing end-user category as mid-sized pharma firms outsource peptide sequence determination to specialized service providers, reducing fixed laboratory costs while maintaining regulatory-grade mass spectrometry proteomics capabilities.


Regional Market Share Analysis

Region Key Metric Primary Investment Themes
North America 46% share (2025) NIH-funded proteomics centers; biopharma R&D clusters
Europe 26% share (2025) EMA biosimilar mandates; Horizon Europe grants
Asia-Pacific 9.4% CAGR (2026–2035) Government biotech initiatives; CRO expansion
South America USD 0.07 Billion (2025) FAPESP grants; emerging clinical proteomics labs
Middle East & Africa 3.8% CAGR (2026–2035) Saudi Vision 2030 life-science zones; South Africa academic hubs
Total USD 1.79 Billion (2025)

The Protein Sequencing Market displays a clear geographic hierarchy, with North America maintaining spending leadership and Asia-Pacific delivering the strongest growth trajectory. Regional dynamics are shaped by R&D funding levels, regulatory frameworks, and the density of pharmaceutical and CRO operations conducting amino acid sequence analysis.


North America

Country Key Metric Key Driver
US 78% of regional share NIH proteomics grants; pharma headquarters density
Canada 5.3% CAGR Genome Canada funding cycles
Mexico USD 0.02 Billion CONACYT biotech programs


The United States alone accounts for over three-quarters of the North American Protein Sequencing Market revenue, anchored by the NIH's Protein Capture Reagents Program and dense clusters of next-gen protein identification startups in Boston, San Francisco, and San Diego. Canadian labs benefit from Genome Canada's five-year proteomics funding allocation of CAD 180 million, while Mexico's nascent biotech sector is beginning to adopt mass spectrometry proteomics through CONACYT-supported university partnerships [7].

Europe

Country Key Metric Key Driver
Germany 24% of regional share Max Planck Institute proteomics leadership
UK 5.1% CAGR UKRI bioscience grants; NHS precision medicine
France USD 0.06 Billion INSERM-funded sequencing cores
Italy 3.9% CAGR Biotech startup ecosystem in Lombardy
Spain USD 0.03 Billion CSIC proteomics centers
Nordic Countries 4.6% CAGR SciLifeLab national infrastructure
Russia USD 0.02 Billion Skolkovo biotech cluster
Rest of Europe 3.7% CAGR Regional EU structural funds


Germany leads the European Protein Sequencing Market through the Max Planck Institute's proteomics division and a dense industrial base of peptide sequence determination service providers. The UK's UKRI invested GBP 120 million in life-science infrastructure in 2024, with a significant allocation toward amino acid sequence analysis capabilities for NHS genomic medicine centers [4].

Asia-Pacific

Country Key Metric Key Driver
China 38% of regional share MOST "14th Five-Year" biotech plan
India 11.2% CAGR BioE3 initiative; CRO hub in Hyderabad
Japan USD 0.05 Billion RIKEN proteomics programs
South Korea 8.9% CAGR K-Bio investment wave
ASEAN USD 0.03 Billion Singapore Biodesign Center
Rest of Asia-Pacific 7.4% CAGR Australia NHMRC grants


Asia-Pacific represents the most dynamic growth corridor for the Protein Sequencing Market, with China's Ministry of Science and Technology channeling approximately USD 2.3 billion toward proteomics and multi-omics research under the 14th Five-Year Plan [7]. India's Hyderabad-based CRO cluster alone added over 200 mass spectrometry proteomics instruments in 2024, reflecting the country's rapid emergence as a peptide sequence determination outsourcing hub.

South America

Country Key Metric Key Driver
Brazil 58% of regional share FAPESP proteomics grants
Argentina 4.1% CAGR CONICET laboratory modernization
Rest of South America USD 0.01 Billion University-level adoption


Brazil dominates South America's Protein Sequencing Market on the strength of São Paulo's FAPESP-funded proteomics network, which supports over 30 mass spectrometry proteomics core facilities [7]. Argentina's CONICET is modernizing aging Edman degradation method equipment with EU-donated instruments, gradually expanding peptide sequence determination capacity across Buenos Aires-based research hospitals.

Middle East & Africa

Country Key Metric Key Driver
Saudi Arabia 31% of regional share KAUST Proteomics Center; Vision 2030
UAE 5.2% CAGR Dubai BioTech Park expansion
South Africa USD 0.01 Billion CSIR Biotech Division
Egypt 3.5% CAGR National Research Centre upgrades
Rest of MEA USD 0.01 Billion Early-stage adoption


Saudi Arabia's King Abdullah University of Science and Technology (KAUST) operates the region's most advanced amino acid sequence analysis facility, with 12 high-resolution mass spectrometry proteomics systems commissioned under Vision 2030's life-science pillar [8]. The UAE's Dubai BioTech Park has attracted three next-gen protein identification platform vendors to establish regional demonstration labs, signaling growing interest across the Gulf Cooperation Council.


Protein Sequencing Market By Region, 2025-2035

Competitive Benchmarking

The Protein Sequencing Market exhibits medium concentration, with the top five vendors collectively holding an estimated 48–55% of global revenue. The Herfindahl-Hirschman Index (HHI) sits in the 900–1,200 range, indicative of a moderately competitive environment where large instrumentation conglomerates compete alongside specialized next-gen protein identification startups. Mergers, technology licensing deals, and consumable portfolio expansions have been the primary competitive levers over the past three years.

Company Est. Revenue Share Range Key Offerings for Protein Sequencing Market Strategic Positioning
Thermo Fisher Scientific ~12–16% Orbitrap mass spectrometry proteomics platforms; Proteome Discoverer software Full-stack instrument-to-informatics provider
Bruker Corporation ~8–12% timsTOF series; PASEF workflows for amino acid sequence analysis High-resolution mass spec specialist
Agilent Technologies ~7–10% LC-MS/MS systems; MassHunter software Broad analytical portfolio with cross-sell leverage
Waters Corporation ~5–8% ACQUITY UPLC; peptide sequence determination columns Chromatography-led proteomics solutions
Shimadzu Corporation ~4–7% LCMS-9050; PPSQ Edman degradation method sequencer Dual-platform strategy (MS + Edman)
Danaher (Sciex) ~4–6% ZenoTOF; TripleTOF systems Pharma QC-focused mass spectrometry proteomics
Quantum-Si ~2–4% Platinum next-gen protein identification semiconductor chip Single-molecule sequencing disruptor
Bio-Rad Laboratories ~2–4% Protein electrophoresis; peptide mapping reagents Consumables and sample-prep specialist
Promega Corporation ~1–3% Trypsin/Lys-C enzyme kits; amino acid sequence analysis reagents Reagent-centric market position
PerkinElmer (Revvity) ~1–3% SPRIworks automation; biopharma workflow solutions Automation and screening focus


Recent News & Developments

  • Thermo Fisher Scientific (June 2026): Debuted the Orbitrap Tribrid Apex (high-sensitivity multi-omics) and Orbitrap Excedion (biopharma QC and regulatory-ready data) mass spectrometers.
  • Quantum-Si (January 2025): Announced commercial shipment of the Platinum Pro system, the first semiconductor-based next-gen protein identification instrument targeting biopharma quality-control labs [2].
  • Bruker Corporation (June 2026): Launched the timsMRMS system (combining TIMS with MRMS) and the timsOmni platform, which uses AI-driven OmniScape software for deep proteoform structural analysis.


  • Agilent Technologies (June 2026): Announced a three-year strategic collaboration with OmixAI (April 2026) to advance AI-driven proteomics, integrating Agilent's Bravo automation with OmixAI’s "Physical AI" platform.


Protein Sequencing Market Report Scope

Item Detail
Market Scope Global Protein Sequencing Market covering instruments, reagents & consumables, software & services across pharmaceutical, CRO, academic, and biotech end users
Study Period 2021–2035
CAGR 4.72% (2026–2035)
Market Size (2025) USD 1.79 Billion
Market Size (2035) USD 2.98 Billion
Fastest Growing Segment Synthetic Biology & Cell-Free Systems (Application); CROs (End User); Asia-Pacific (Geography)
Companies Profiled 10 (Thermo Fisher, Bruker, Agilent, Waters, Shimadzu, Danaher/Sciex, Quantum-Si, Bio-Rad, Promega, PerkinElmer/Revvity)
Valuation Currency USD Billion


FAQs

How do single-molecule platforms compare with mass spectrometry for throughput in clinical applications?
Single-molecule platforms currently process 50–100 samples per day versus 500+ for high-end mass spectrometry proteomics systems. Clinical labs should evaluate throughput needs against sensitivity gains before committing capital [2].
What contract structures do CROs typically offer for outsourced protein sequencing?
Most CROs offer per-sample pricing between USD 150 and USD 800, depending on resolution and turnaround. Volume-tiered contracts with guaranteed monthly minimums provide 15–20% discounts over ad-hoc submissions [5].
Which regulatory filings require complete amino acid sequence analysis data?
All IND and BLA submissions to the FDA and MAA filings to the EMA must include full primary-structure characterization. ICH Q6B mandates sequence confirmation as part of biologic drug substance specifications [8].
How does the Protein Sequencing Market address post-translational modification mapping?
Advanced mass spectrometry proteomics workflows with enrichment steps identify over 400 modification types. Vendors increasingly bundle PTM-analysis modules into standard peptide sequence determination software packages [9].
What is the typical payback period for a new mass spectrometry proteomics instrument?
Pharma-grade systems costing USD 0.8–1.5 million achieve payback within 3–4 years at 80%+ utilization. CROs operating at higher throughput often recover costs in under two years [6].
How are Protein Sequencing Market vendors addressing data-security concerns in cloud analytics?
Leading vendors deploy SOC 2-compliant cloud environments with end-to-end encryption. On-premise deployment options remain available for organizations with strict data-residency requirements [14].
What training investment should a lab budget when adopting next-gen protein identification technology?
Labs typically allocate USD 15,000–30,000 per operator for vendor certification and bioinformatics training. HUPO recommends a minimum 6-month ramp-up period before achieving validated production throughput [13].    
Author
Author
Author Profile
Rahul Gotadki LinkedIn
Research Manager
He holds an experience of about 9+ years in Market Research and Business Consulting, working under the spectrum of Life Sciences and Healthcare domains. Rahul conceptualizes and implements a scalable business strategy and provides strategic leadership to the clients. His expertise lies in market estimation, competitive intelligence, pipeline analysis, customer assessment, etc.
Co-Author
Co-Author Profile
Nidhi Mandole LinkedIn
Senior Research Analyst
She is an extremely curious individual currently working in Healthcare and Medical Devices Domain. Nidhi is comfortably versed in data centric research backed by healthcare educational background. She leverages extensive data mining and analytics tools such as Primary and Secondary Research, Statistical Analysis, Machine Learning, Data Modelling. Her key role also involves Technical Sales Support, Client Interaction and Project management within the Healthcare team. Lastly, she showcases extensive affinity towards learning new skills and remain fascinated in implementing them.

Research Approach


Secondary Research

The secondary research process involved comprehensive analysis of regulatory databases, peer-reviewed proteomics journals, clinical and translational research publications, and authoritative life sciences organizations. Key sources included the US Food & Drug Administration (FDA) Center for Devices and Radiological Health (CDRH), European Medicines Agency (EMA), National Institutes of Health (NIH) National Institute of General Medical Sciences (NIGMS), National Human Genome Research Institute (NHGRI), National Center for Biotechnology Information (NCBI/PubMed), National Institute of Standards and Technology (NIST) Proteomics Standards Initiative, Human Proteome Organization (HUPO), American Society for Mass Spectrometry (ASMS), European Bioinformatics Institute (EBI) UniProt Database, US Patent and Trademark Office (USPTO), European Patent Office (EPO), World Intellectual Property Organization (WIPO), National Science Foundation (NSF) Directorate for Biological Sciences, Centers for Disease Control and Prevention (CDC) Public Health Genomics, World Health Organization (WHO) International Agency for Research on Cancer (IARC), and national bioscience funding reports from key markets.

Instrument installation statistics, regulatory 510(k) clearance data, proteomics research funding trends, clinical biomarker validation studies, IP landscape analysis, and mass spectrometry utilization rates across academic and industrial laboratories were gathered using these sources.


Primary Research

Qualitative and quantitative insights were obtained by interviewing supply-side and demand-side stakeholders during the primary research process. The supply-side sources consisted of CEOs, CTOs, VPs of Proteomics R&D, Heads of Bioinformatics, and General Managers of Life Sciences Mass Spectrometry from protein sequencing instrument manufacturers, reagent suppliers, and computational proteomics software developers. Principal Investigators of proteomics core facilities, Directors of Mass Spectrometry Centers, Chief Scientific Officers and Heads of Protein Sciences at pharmaceutical companies, Directors of Computational Biology at biotechnology firms, and Procurement Managers at Contract Research Organizations (CROs) and academic medical centers comprised demand-side sources. The primary research validated technology adoption curves between mass spectrometry and Edman degradation methods, confirmed product development pipelines for next-generation protein chip technologies, and gathered insights on bioinformatics integration challenges, capital expenditure cycles for sequencing instrumentation, and software licensing models.

Primary Respondent Breakdown:

By Designation: C-level Primaries (32%), Director Level (30%), Others (38%)

By Region: North America (36%), Europe (28%), Asia-Pacific (29%), Rest of World (7%)


Market Size Estimation

Revenue mapping and instrument installation base analysis were employed to determine the global market valuation. The methodology comprised the following:

The identification of over 60 key manufacturers in North America, Europe, Asia-Pacific, and Latin America for mass spectrometry systems, Edman degradation sequencers, protein microarray platforms, and next-generation sequencing technologies

Product mapping encompasses consumables (columns, chips, sample prep kits), software (proteomics data analysis, bioinformatics platforms), reagents (digestion enzymes, standards, labeling), and instruments (mass spectrometers, sequencers, microarray scanners).

Analysis of annual revenues that are specific to protein sequencing product portfolios, isolating proteomics-dedicated revenue from general analytical instrument sales, as reported and modeled.

Extraction of segment-specific valuations for mass spectrometry, Edman degradation, protein chip technology, and nucleic acid sequencing workflows through the use of bottom-up (institutional procurement budgets × installed base by application segment in academic, pharmaceutical, biotechnology, and CRO sectors) and top-down (manufacturer revenue validation against total addressable market) approaches in 2024, including Thermo Fisher Scientific, Illumina, Agilent Technologies, Waters Corporation, PerkinElmer, Bio-Rad Laboratories, Bruker Corporation, and Merck KGaA.

Download Free Sample

Kindly complete the form below to receive a free sample of this Report

Download PDF ×

We do not share your information with anyone. However, we may send you emails based on your report interest from time to time. You may contact us at any time to opt-out.
















