Protein Sequencing Market (2026 - 2035)

ID: MRFR/LS/5364-HCR
200 Pages
Rahul Gotadki
Last Updated: July 12, 2026
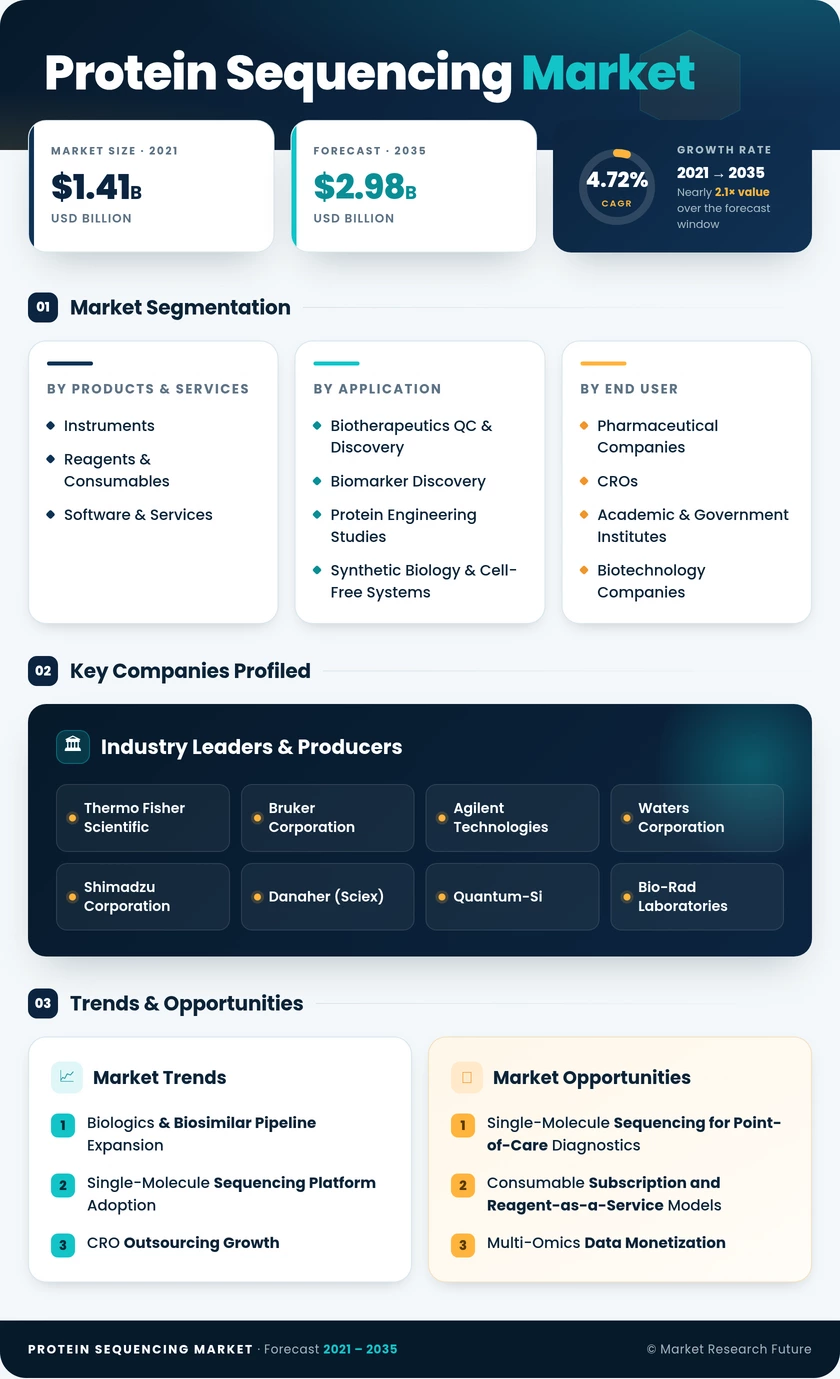
Protein Sequencing Market Research Report: Size, Share, Trend Analysis By Technology (Mass Spectrometry, Edman Degradation, Protein Chip Technology, Nucleic Acid Sequencing), By Applications (Biomedical Research, Drug Discovery, Diagnostics, Proteomics), By End Use (Academic Institutions, Pharmaceutical Companies, Biotechnology Companies, Contract Research Organizations), By Product Type (Instruments, Reagents, Software, Consumables) and By Regional (North America, Europe, South America, Asia Pacific, Middle East and Africa) - Growth Outlook & Industry Forecast 2025 To 2035
Protein Sequencing Market
Market Size
Forecast Period2026-2035
CAGR (2026-2035)4.72%
2025 Market SizeUSD 1.79 Billion
2035 Market SizeUSD 2.98 Billion
Key Players
Thermo Fisher Scientific
Bruker Corporation
Agilent Technologies
Waters Corporation
Shimadzu Corporation
Danaher
Opportunities
  • Single-Molecule Sequencing for Point-of-Care Diagnostics
  • Consumable Subscription and Reagent-as-a-Service Models
  • Multi-Omics Data Monetization
  1. 1 Market Overview |
    1. 1.1 Study Assumptions & Market Definition |
    2. 1.2 Scope of the Study |
    3. 1.3 Research Methodology
  2. 2 Market Summary & Key Takeaways
  3. 3 Market Dynamics |
    1. 3.1 Market Drivers Analysis | |
      1. 3.1.1 Biologics & Biosimilar Pipeline Expansion | |
      2. 3.1.2 Single-Molecule Sequencing Platform Adoption | |
      3. 3.1.3 CRO Outsourcing Growth | |
      4. 3.1.4 AI-Driven De Novo Peptide Sequence Determination | |
      5. 3.1.5 Regulatory Harmonization for Biosimilars | |
      6. 3.1.6 Multi-Omics Integration Demand | |
      7. 3.1.7 Consumable-as-a-Service Business Models |
    2. 3.2 Market Restraints Analysis | |
      1. 3.2.1 High Instrument Capital Costs | |
      2. 3.2.2 Shortage of Trained Proteomics Specialists | |
      3. 3.2.3 Data Standardization & Interoperability Gaps | |
      4. 3.2.4 Sample Preparation Complexity | |
      5. 3.2.5 Reimbursement Uncertainty for Clinical Proteomics |
    3. 3.3 Market Opportunity Analysis | |
      1. 3.3.1 Single-Molecule Sequencing for Point-of-Care Diagnostics | |
      2. 3.3.2 Consumable Subscription and Reagent-as-a-Service Models | |
      3. 3.3.3 Multi-Omics Data Monetization | |
      4. 3.3.4 Emerging Market Laboratory Buildouts | |
      5. 3.3.5 Regulatory-Driven Quality Control Mandates |
    4. 3.4 Industry Value Chain Analysis |
    5. 3.5 Porter's Five Forces Analysis
  4. 4 Global Protein Sequencing Market Size & Forecast (2021–2035) |
    1. 4.1 Historical Market Size (2021–2025) |
    2. 4.2 Current & Forecast Market Size (2026–2035) |
    3. 4.3 Market Size by Revenue (USD Billion) |
    4. 4.4 Year-over-Year Growth Analysis
  5. 5 Segmentation Analysis |
    1. 5.1 By Products & Services | |
      1. 5.1.1 Instruments | |
      2. 5.1.2 Reagents & Consumables | |
      3. 5.1.3 Software & Services |
    2. 5.2 By Application | |
      1. 5.2.1 Biotherapeutics Quality Control & Discovery | |
      2. 5.2.2 Biomarker Discovery | |
      3. 5.2.3 Protein Engineering Studies | |
      4. 5.2.4 Synthetic Biology & Cell-Free Systems |
    3. 5.3 By End User | |
      1. 5.3.1 Pharmaceutical Companies | |
      2. 5.3.2 Contract Research Organizations (CROs) | |
      3. 5.3.3 Academic & Government Institutes | |
      4. 5.3.4 Biotechnology Companies
  6. 6 Regional Analysis |
    1. 6.1 North America | |
      1. 6.1.1 United States | |
      2. 6.1.2 Canada | |
      3. 6.1.3 Mexico |
    2. 6.2 Europe | |
      1. 6.2.1 Germany | |
      2. 6.2.2 United Kingdom | |
      3. 6.2.3 France | |
      4. 6.2.4 Italy | |
      5. 6.2.5 Spain | |
      6. 6.2.6 Nordic Countries | |
      7. 6.2.7 Russia | |
      8. 6.2.8 Rest of Europe |
    3. 6.3 Asia-Pacific | |
      1. 6.3.1 China | |
      2. 6.3.2 India | |
      3. 6.3.3 Japan | |
      4. 6.3.4 South Korea | |
      5. 6.3.5 ASEAN | |
      6. 6.3.6 Rest of Asia-Pacific |
    4. 6.4 South America | |
      1. 6.4.1 Brazil | |
      2. 6.4.2 Argentina | |
      3. 6.4.3 Rest of South America |
    5. 6.5 Middle East & Africa | |
      1. 6.5.1 Saudi Arabia | |
      2. 6.5.2 UAE | |
      3. 6.5.3 South Africa | |
      4. 6.5.4 Egypt | |
      5. 6.5.5 Rest of MEA
  7. 7 Competitive Landscape |
    1. 7.1 Market Share Analysis (2025) |
    2. 7.2 Competitive Benchmarking Matrix |
    3. 7.3 Company Profiles | |
      1. 7.3.1 Thermo Fisher Scientific | |
      2. 7.3.2 Bruker Corporation | |
      3. 7.3.3 Agilent Technologies | |
      4. 7.3.4 Waters Corporation | |
      5. 7.3.5 Shimadzu Corporation | |
      6. 7.3.6 Danaher (Sciex) | |
      7. 7.3.7 Quantum-Si | |
      8. 7.3.8 Bio-Rad Laboratories | |
      9. 7.3.9 Promega Corporation | |
      10. 7.3.10 PerkinElmer (Revvity)
  8. 8 Future Outlook & Strategic Recommendations (2026–2035) |
    1. 8.1 AI-Augmented Protein Sequencing Workflows |
    2. 8.2 Platform Economics and Consumable Lock-In |
    3. 8.3 Clinical Proteomics and Companion Diagnostics |
    4. 8.4 Sustainability and Green Chemistry in Proteomics
  9. 9 Recent Developments & News
  10. 10 Frequently Asked Questions (FAQs)
  11. 11 Report Scope & Methodology |
    1. 11.1 Study Period & Base Year |
    2. 11.2 Data Sources & Citations |
    3. 11.3 Abbreviations
  12. 12 LIST OF TABLES |
  13. TABLE 1 Global Protein Sequencing Market Size & Forecast, by Revenue (USD Billion), 2021–2035 |
  14. TABLE 2 Global Protein Sequencing Market – Year-over-Year Growth Analysis, 2021–2035 |
  15. TABLE 3 Global Protein Sequencing Market – Driver Impact Analysis |
  16. TABLE 4 Global Protein Sequencing Market – Restraint Impact Analysis |
  17. TABLE 5 Global Protein Sequencing Market Size, by Products & Services, 2021–2035 (USD Billion) |
  18. TABLE 6 Global Protein Sequencing Market Size, by Application, 2021–2035 (USD Billion) |
  19. TABLE 7 Global Protein Sequencing Market Size, by End User, 2021–2035 (USD Billion) |
  20. TABLE 8 Global Protein Sequencing Market Size, by Region, 2021–2035 (USD Billion) |
  21. TABLE 9 North America Protein Sequencing Market Size, by Country, 2021–2035 (USD Billion) |
  22. TABLE 10 Europe Protein Sequencing Market Size, by Country, 2021–2035 (USD Billion) |
  23. TABLE 11 Asia-Pacific Protein Sequencing Market Size, by Country, 2021–2035 (USD Billion) |
  24. TABLE 12 South America Protein Sequencing Market Size, by Country, 2021–2035 (USD Billion) |
  25. TABLE 13 Middle East & Africa Protein Sequencing Market Size, by Country, 2021–2035 (USD Billion) |
  26. TABLE 14 Competitive Benchmarking Matrix – Global Protein Sequencing Market, 2025 |
  27. TABLE 15 Company Profiles – Key Players, Global Protein Sequencing Market |
  28. TABLE 16 Recent Developments & Strategic Announcements, 2023–2025 |
  29. TABLE 17 Report Scope & Methodology Summary |
  30. TABLE 18 Detailed Sources and Citations
  31. 13 LIST OF FIGURES |
  32. FIGURE 1 Protein Sequencing Market Dynamics — Drivers, Restraints & Opportunities |
  33. FIGURE 2 Industry Value Chain Analysis — Protein Sequencing Market |
  34. FIGURE 3 Porter's Five Forces Analysis — Protein Sequencing Market |
  35. FIGURE 4 Global Protein Sequencing Market Size Trend (USD Billion), 2021–2035 |
  36. FIGURE 5 Protein Sequencing Market Share, by Products & Services, 2025 |
  37. FIGURE 6 Protein Sequencing Market Share, by Application, 2025 |
  38. FIGURE 7 Protein Sequencing Market Share, by End User, 2025 |
  39. FIGURE 8 Protein Sequencing Market Share, by Region, 2025 |
  40. FIGURE 9 North America Protein Sequencing Market Share, by Country, 2025 |
  41. FIGURE 10 Europe Protein Sequencing Market Share, by Country, 2025 |
  42. FIGURE 11 Asia-Pacific Protein Sequencing Market Share, by Country, 2025 |
  43. FIGURE 12 Competitive Landscape Positioning Map — Protein Sequencing Market, 2025

Segmentation Quick Reference

DimensionSub-SegmentsDominant SegmentFastest Growing Segment
Products & ServicesInstruments; Reagents & Consumables; Software & ServicesSoftware & Services (41% share, 2025)Reagents & Consumables (6.9% CAGR)
ApplicationBiotherapeutics QC & Discovery; Biomarker Discovery; Protein Engineering Studies; Synthetic Biology & Cell-Free SystemsBiotherapeutics QC & Discovery (39% share, 2025)Synthetic Biology & Cell-Free Systems (13.1% CAGR)
End UserPharmaceutical Companies; CROs; Academic & Government Institutes; Biotechnology CompaniesPharmaceutical Companies (57% share, 2025)CROs (9.2% CAGR)
GeographyNorth America; Europe; Asia-Pacific; South America; Middle East & AfricaNorth America (46% share, 2025)Asia-Pacific (9.4% CAGR)


Market Segmentation Overview

By Products & Services

Sub-SegmentKey Trend
InstrumentsPlatform refresh toward single-molecule and high-resolution mass spectrometry systems
Reagents & ConsumablesRecurring revenue from proprietary enzyme kits, columns, and solvent packs
Software & ServicesCloud migration and AI-integrated bioinformatics analytics


The products & services dimension reflects the industry's transition from capital-intensive hardware sales toward a model that emphasizes software subscriptions and consumable annuity streams, mirroring trends seen across the broader life-science instrumentation landscape.

By Application

Sub-SegmentKey Trend
Biotherapeutics Quality Control & DiscoveryMandatory sequence confirmation for biologic and biosimilar regulatory filings
Biomarker DiscoveryGrowing clinical trial demand for proteomic companion diagnostics
Protein Engineering StudiesDirected evolution and computational enzyme design are driving new workflows
Synthetic Biology & Cell-Free SystemsRapid prototyping through cell-free expression coupled with real-time sequencing validation


Application segmentation highlights the dominant role of biotherapeutics quality control, which creates non-discretionary demand, alongside the rapid emergence of synthetic biology workflows that require fast-turnaround sequence verification.

By End User

Sub-SegmentKey Trend
Pharmaceutical CompaniesExpanding in-house biologics R&D and quality-control infrastructure
Contract Research Organizations (CROs)Outsourcing-driven throughput growth and per-sample pricing models
Academic & Government InstitutesGrant-funded proteomics core facilities upgrading aging equipment
Biotechnology CompaniesEarly-pipeline sequence analysis for novel modalities


End-user segmentation underscores the Protein Sequencing Market's reliance on pharmaceutical companies as the primary revenue source, with CROs emerging as the growth engine driven by the broader outsourcing wave in drug development.

By Geography

Sub-SegmentKey Trend
North AmericaNIH funding, dense pharma HQ clusters, startup innovation hubs
EuropeEMA biosimilar mandates, Horizon Europe research grants
Asia-PacificGovernment biotech initiatives in China and India, CRO hub expansion
South AmericaFAPESP-led proteomics investment in Brazil
Middle East & AfricaVision 2030 life-science zones, early-stage market development


Geographic segmentation confirms North America's leadership position, driven by institutional R&D spending, while Asia-Pacific's outsized growth trajectory reflects government-led biotech investment and the rise of India and China as major CRO hubs.


 

Download PDF ×

We do not share your information with anyone. However, we may send you emails based on your report interest from time to time. You may contact us at any time to opt-out.