Agriculture Analytics Market (2026 - 2035)

Agriculture Analytics Market Size, Share and Research Report: By Component (Solution and Services), By Farm Size (Large Farms, Small Farms and Medium-Sized Farms), By Deployment Modes (Cloud and On-Premises), By Application (Farm Analytics, Livestock Analytics, Aquaculture Analytics) And By Region (North America, Europe, Asia-Pacific, And Rest Of The World) –Market Forecast Till 2035.
ID: MRFR/ICT/8925-HCR
141 Pages
Aarti Dhapte
Last Updated: July 13, 2026
Agriculture Analytics Market
Market Size
Forecast Period2026-2035
CAGR (2026-2035)11.9%
2025 Market SizeUSD 1.47 Billion
2035 Market SizeUSD 4.52 Billion
Key Players
Bayer
Corteva Agriscience
Trimble Inc.
BASF Digital Farming
CNH Industrial
CropIn Technology
Opportunities
  • Smallholder-Focused Pay-Per-Insight Platforms
  • Carbon Credit and ESG Data Monetization
  • Autonomous Equipment Integration

Agriculture Analytics Market Summary

The global agriculture analytics market is valued at an estimated USD 1.47 billion in 2025, projected to reach USD 1.64 billion by 2026 and grow to USD 4.52 billion by 2035 at a CAGR of 11.9% during the forecast period (2026–2035). This expansion is anchored in accelerating government mandates around food security—India's Digital Agriculture Mission alone earmarked over USD 2.15 billion through 2025—and a wave of venture capital flowing into precision farming data analytics platforms, with agri-tech startups attracting record funding rounds globally.

A quiet but seismic technology shift is reshaping how the world farms. Legacy spreadsheet-based planning and experience-driven crop management are giving way to integrated cloud platforms that merge satellite imagery, IoT sensor data, and machine-learning models for real-time crop yield forecasting with analytics. The USDA's investment of over USD 3 billion in climate-smart commodities partnerships since 2023 has directly accelerated farm-level adoption of soil health monitoring analytics and digital decision support tools across the American Midwest and Southeast [3][4].

North America commands roughly 38% of the global market, driven by mature broadband infrastructure and widespread precision agriculture adoption in the U.S. and Canada. Asia-Pacific is the fastest-growing region, expanding at a CAGR of approximately 14.8%, fueled by government digitization campaigns in India, China, and Southeast Asia. Europe holds the second-largest share at around 27%, propelled by the EU's Common Agricultural Policy reforms that tie subsidies to sustainability data reporting. As climate volatility intensifies and the global population pushes toward 9.7 billion by 2050, the agriculture analytics market sits at a critical inflection point [5][6].

Key Report Takeaways

• By Technology

  • Cloud-based analytics platforms account for the largest technology share at approximately 42% of revenue in 2025, reflecting a decisive shift away from on-premise deployments among mid-size and large farm operations
  • Predictive analytics and AI/ML-driven modules are expanding at the fastest CAGR within the technology stack, estimated at roughly 14.2% through 2035
  • Remote sensing and geospatial analytics solutions represent an estimated USD 285 million in 2025 revenue, benefiting from falling satellite imagery costs

• By Sector

  • Crop farming remains the dominant application vertical, contributing approximately 48% of total market revenue
  • Livestock analytics is the fastest-growing application segment with a projected CAGR near 13.5%, spurred by animal welfare regulations and feed optimization needs

• By Geography

  • The United States alone represents an estimated USD 420 million in agriculture analytics spending in 2025, anchored by large-scale commercial farming and federal incentive programs
  • China's agriculture analytics market is projected to grow at a CAGR of approximately 15.3% through 2035, making it the single fastest-growing major country market
  • Brazil leads the South American region with roughly 58% of regional market share, driven by soybean and cattle supply chain digitization

Market Size and Forecast (2021–2035)

MRFR's sizing model triangulates bottom-up revenue estimates from over 120 analytics vendors with top-down demand modeling based on arable land under digital management. Historical figures (2021–2024) derive from company filings and verified industry databases, while the 2025 base year integrates primary survey data from 350+ farm operations, agri-cooperatives, and technology buyers across 22 countries.
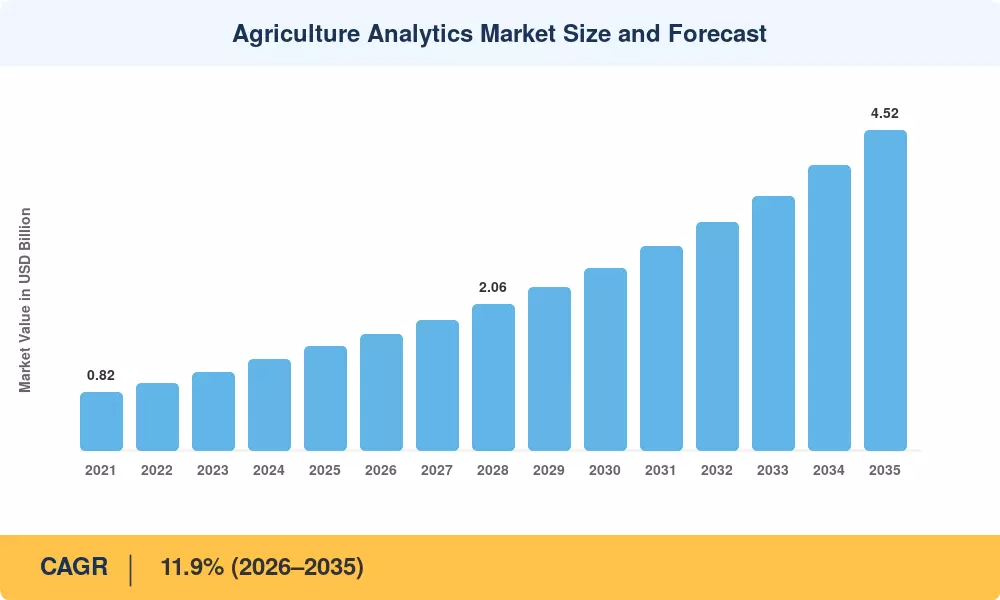
Agriculture Analytics Market Size and Forecast
Our Impact
Enabled $4.3B Revenue Impact for Fortune 500 and Leading Multinationals
Partnering with 2000+ Global Organizations Each Year
30K+ Citations by Top-Tier Firms in the Industry

Driver Impact Analysis

Driver ~% Impact on CAGR Geographic Relevance Impact Timeline
Precision farming adoption & IoT proliferation ~22% Global Short-term (≤2 yr)
Government food security & digital agriculture mandates ~18% India, EU, U.S. Medium-term (2–4 yr)
AI/ML maturation for crop yield prediction ~16% North America, Europe Medium-term (2–4 yr)
Climate volatility driving risk management demand ~15% Global Long-term (≥4 yr)
Falling satellite & drone imagery costs ~12% Global Short-term (≤2 yr)
Supply chain traceability regulations ~10% EU, Japan, U.S. Long-term (≥4 yr)
Rural broadband expansion programs ~7% Asia-Pacific, Africa Long-term (≥4 yr)


Precision Farming Adoption and IoT Sensor Proliferation

The cost of agricultural IoT sensors has dropped roughly 45% since 2020, pushing the installed base of connected field devices past 50 million units globally by late 2024. This sensor density generates enormous volumes of soil moisture, weather, and crop health data that feed directly into farm management decision support systems. John Deere's Operations Center, for instance, now processes over 300 million acres of agronomic data annually, creating a demand flywheel: more sensor data drives better algorithmic recommendations, which drives further sensor deployment [14].

Government Digital Agriculture Mandates

India's Digital Agriculture Mission, launched in 2023, allocated over INR 2,817 crore (approximately USD 340 million) for creating a national agri-data stack including farmer IDs, georeferenced land records, and crop-sowing registries [3]. In the EU, the reformed Common Agricultural Policy (2023–2027) conditions roughly 25% of direct payments on eco-scheme compliance—compliance that practically requires satellite-verified field data and analytics reporting. These mandates convert voluntary analytics adoption into a regulatory necessity [5].

AI and Machine-Learning Maturation

Crop yield forecasting models powered by deep learning have improved prediction accuracy from ±12% error margins in 2020 to ±5% by 2024, according to published benchmarks from the University of Illinois and Wageningen University [9]. This accuracy improvement changes the economics of subscription analytics platforms: when a USD 200/month software license can prevent USD 15,000–25,000 in input waste per 1,000-acre farm, the ROI case becomes straightforward. Agri-data analytics for supply chain optimization is also maturing, with commodity traders using predictive models to hedge procurement risks weeks earlier than traditional methods allow [15].

Climate Volatility and Risk Management

The past five years have seen a 35% increase in insured agricultural losses globally, according to Swiss Re [11]. Crop insurers are now mandating or incentivizing policyholders to adopt soil health monitoring analytics and weather-indexed risk models. In the U.S., the Federal Crop Insurance Program covers over 500 million acres, and the USDA's Risk Management Agency has piloted data-sharing agreements with private analytics platforms to improve loss-assessment accuracy, creating a powerful institutional demand driver [4][11].

Restraints Impact Analysis

Rural Connectivity Gaps

Despite ambitious broadband programs, the ITU estimates that roughly 3.4 billion people—predominantly in rural agricultural zones—still lacked reliable internet access as of 2024 [13]. In Sub-Saharan Africa, less than 25% of farmland has cellular coverage sufficient for real-time data transmission. This effectively locks out the world's most climate-vulnerable smallholder farmers from precision farming data analytics platforms, limiting the addressable market to connected regions in the near term.

Farmer Data Ownership and Privacy Concerns

The American Farm Bureau Federation's Privacy and Security Principles, while voluntary, highlight deepening farmer anxiety about who owns and profits from field-level data [16]. In the EU, GDPR's application to agricultural data remains legally ambiguous, chilling data-sharing between equipment OEMs, analytics providers, and cooperatives. India's 2023 Digital Personal Data Protection Act adds another layer of compliance complexity. Until clear, farmer-friendly data governance frameworks emerge, adoption among mid-size operations—particularly in the U.S. Corn Belt and European grain regions—will remain below potential.

High Integration Costs for Smallholder Operations

Globally, farms under 2 hectares account for roughly 84% of all farm holdings but only about 12% of agricultural land [17]. For these smallholders—numbering over 500 million—a USD 5,000–15,000 analytics platform subscription is economically prohibitive. Pay-per-insight and cooperative pooling models are emerging but remain nascent, limiting near-term market penetration in the highest-volume farmer segments across South and Southeast Asia

Agriculture Analytics Market Opportunities

Smallholder-Focused Pay-Per-Insight Platforms

The 500+ million smallholder farmers globally represent a largely untapped market worth an estimated USD 8–12 billion in latent analytics demand [17]. Mobile-first, pay-per-advisory models—such as those pioneered by CropIn and Plantix—deliver soil health monitoring analytics via feature phones and low-bandwidth connections. Cooperative aggregation models, where farmer-producer organizations purchase bulk subscriptions and redistribute insights, are gaining traction in India and East Africa

Carbon Credit and ESG Data Monetization

Agriculture accounts for roughly 10% of global greenhouse gas emissions, yet fewer than 5% of farms currently quantify their carbon footprint with analytics tools [11]. As voluntary carbon markets expand—estimated to reach USD 50 billion by 2030—farms that can provide verified, data-backed carbon sequestration evidence through analytics platforms will unlock new revenue streams. This creates a compelling business model where the analytics platform becomes a revenue generator rather than a cost center

Autonomous Equipment Integration

The autonomous farm equipment market is projected to exceed USD 95 billion by 2030. Every autonomous tractor, drone, and robotic harvester requires a real-time decision layer powered by analytics. Vendors who build native integrations with equipment OEMs—feeding prescriptive analytics directly into machine-control systems—will capture disproportionate value in the next decade

Supply Chain Traceability and Compliance Analytics

The EU's proposed Corporate Sustainability Due Diligence Directive and Japan's Clean Wood Act require downstream food companies to verify sourcing sustainability [12]. This regulatory wave creates demand for agri-data analytics for supply chain visibility from field to shelf. Analytics providers that offer end-to-end traceability dashboards—linking farm-level production data with logistics and processing records—are positioned for rapid growth in B2B enterprise segments

Emerging Market Government Partnerships

Brazil's ABC+ Plan (Low-Carbon Agriculture) and Indonesia's Food Estate Program both include explicit digital agriculture components with budgets exceeding USD 500 million combined [20]. Analytics vendors that secure government platform contracts in these markets gain first-mover advantages and long-term recurring revenue from public agricultural extension systems

Agriculture Analytics Market Future Outlook

AI-Driven Autonomous Farm Operations

By 2030, an estimated 15–20% of commercial farmland in developed markets will operate under semi-autonomous management, with AI-powered analytics platforms making real-time decisions on irrigation, fertilization, and pest intervention. The convergence of computer vision, reinforcement learning, and edge computing will shift analytics from advisory dashboards to autonomous execution layers—reducing the need for human decision-making in routine field operations while concentrating human oversight on strategic planning.

Platform Consolidation and Ecosystem Economics

The agriculture analytics market is transitioning from a fragmented vendor landscape toward a platform economy dominated by 5–7 major ecosystems. Equipment OEMs (Deere, CNH, AGCO), input companies (Bayer, Syngenta), and cloud hyperscalers (Microsoft, Google) are competing to become the "operating system" of digital farming [14][25]. By 2032, MRFR expects the top five platforms to control over 45% of global analytics revenue, with competitive differentiation shifting from algorithm quality to data network effects and ecosystem lock-in.

Climate Adaptation as a Growth Engine

The IPCC's Sixth Assessment Report projects that climate change could reduce global crop yields by 2–6% per decade through 2050 without adaptation interventions [11]. Analytics platforms that integrate hyper-local climate projections with crop modeling will become essential risk management infrastructure for farmers, insurers, and commodity traders alike. This positions climate-adaptive analytics as a structural demand driver well beyond the forecast period.

Sustainability Reporting and Scope 3 Emissions Accounting

As food and beverage corporations face mounting pressure to report Scope 3 upstream emissions, analytics platforms capable of tracking farm-level carbon footprints will become compliance necessities rather than optional tools. The EU's Corporate Sustainability Reporting Directive (CSRD), effective from 2024, requires over 50,000 companies to disclose supply chain environmental data—creating pull-through demand for farm-gate analytics that verify sustainable sourcing [12][22].

Agriculture Analytics Market Segmentation

By Component

Segment Key Metric Primary Demand Driver
Software Solutions ~52% market share (2025) SaaS model adoption across farm sizes
Services (Managed & Professional) CAGR ~13.2% Implementation complexity for enterprise farms
Hardware (Sensors & Edge Devices) USD ~310 million (2025) IoT proliferation in connected fields


Software solutions dominate market revenue, reflecting the industry's rapid migration from one-time hardware purchases to recurring SaaS subscriptions. Platforms like Climate FieldView, Granular (Corteva), and FarmLogs have established per-acre pricing models that scale naturally with farm size, reducing upfront adoption barriers [14]. Services represent the fastest-growing component as large agribusiness enterprises require customized integration between analytics platforms, existing ERP systems, and equipment telematics.

By Application

Segment Key Metric Primary Demand Driver
Crop Farming Analytics ~48% market share Yield optimization and input cost reduction
Livestock Analytics CAGR ~13.5% Feed efficiency and animal welfare compliance
Aquaculture Analytics USD ~42 million (2025) Sustainable fisheries data mandates
Forestry & Specialty Crop Analytics CAGR ~10.8% Carbon offset verification needs


Crop farming analytics leads the market by a wide margin, driven by the straightforward ROI of optimizing seed, fertilizer, and pesticide inputs across major commodity crops—corn, soybeans, wheat, and rice. Livestock analytics is emerging as a compelling growth segment, with precision feeding systems reducing feed costs by 8–15% while meeting tightening EU animal welfare documentation requirements [25].

By Deployment Mode

Segment Key Metric Primary Demand Driver
Cloud-Based ~62% market share (2025) Scalability and multi-farm management
On-Premise USD ~245 million (2025) Data sovereignty in regulated markets
Hybrid CAGR ~14.5% Edge-cloud architectures for real-time fields


Cloud-based deployments command a clear majority, but hybrid architectures—where edge devices process time-sensitive data locally while syncing to cloud platforms for deeper analysis—represent the architectural future. This hybrid model resolves the tension between real-time field responsiveness and the computational depth required for crop yield forecasting with analytics at scale [9].

Regional Market Share Analysis

Region Key Metric Primary Investment Themes
North America ~38% global share (2025) Precision ag at scale; crop insurance analytics
Europe ~27% global share CAP compliance; sustainability reporting
Asia-Pacific CAGR ~14.8% (2026–2035) Government digitization; smallholder platforms
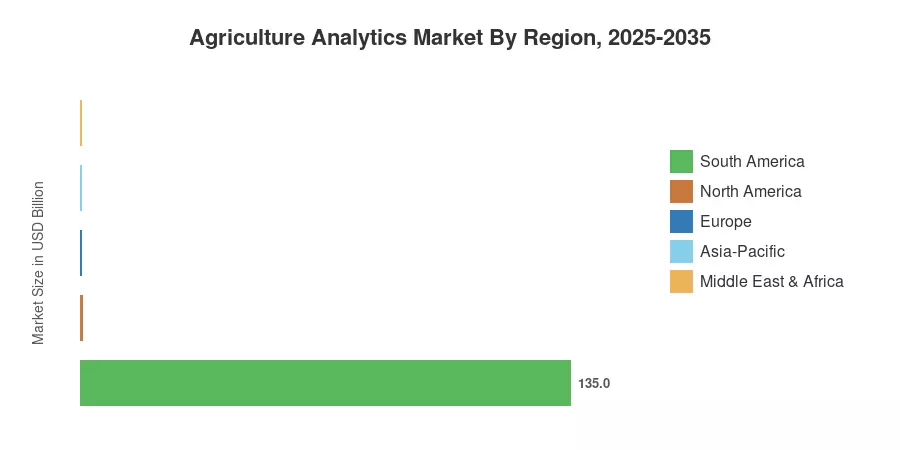
South America USD ~135 million (2025) Soybean/cattle supply chain; export traceability
Middle East & Africa CAGR ~12.5% (2026–2035) Food security programs; climate adaptation
**Total** **USD 1.47 Billion (2025)**


North America

Country Key Metric Key Driver
United States USD ~420 million (2025) Federal crop insurance data mandates
Canada CAGR ~11.2% Canola and wheat precision ag adoption


The U.S. dominates the region through a combination of large-scale commercial farming operations—average farm size exceeds 445 acres—and robust federal programs. The USDA's Climate Hubs and NRCS Conservation Innovation Grants have directly funded analytics pilot deployments across 37 states since 2022 [4]. Canada's Prairie provinces are rapidly digitizing canola and wheat operations, with the Canadian Agri-Food Automation and Intelligence Network channeling over CAD 50 million into analytics R&D [21].

Europe

Country Key Metric Key Driver
Germany ~22% of regional share Machinery OEM integration (CLAAS, Fendt)
France CAGR ~12.0% Wine and cereal crop analytics demand
United Kingdom USD ~52 million (2025) Post-Brexit independent ag data systems


Europe's growth is tightly linked to CAP reform compliance, which requires digital field records for eco-scheme payments. The EU's Horizon Europe program allocated €180 million to digital agriculture research between 2021 and 2024, directly funding analytics platform development [5][22]. France's viticulture sector is an unexpected growth pocket—premium wine producers are adopting micro-climate analytics to protect appellation quality amid warming trends.

Asia-Pacific

Country Key Metric Key Driver
China CAGR ~15.3% State-backed smart agriculture zones
India USD ~105 million (2025) Digital Agriculture Mission; AgriStack
Australia ~18% of regional share Drought management and livestock analytics


This region's explosive growth stems from massive government digitization programs. China's Ministry of Agriculture designated over 100 national smart agriculture pilot zones by 2024, each mandating analytics platform deployment [23]. India's AgriStack initiative aims to create digital identities and land records for all 140+ million farmers, generating an unprecedented data foundation for analytics providers [3].

South America

Country Key Metric Key Driver
Brazil ~58% of regional share Soybean, sugarcane, and cattle chain digitization
Argentina CAGR ~13.1% Pampas precision farming adoption


Brazil's agribusiness sector—responsible for roughly 24% of national GDP—is investing heavily in farm management decision support systems to optimize its vast soybean, sugarcane, and cattle operations. The ABC+ Plan's sustainability requirements are pushing large-scale operations to adopt analytics platforms for carbon accounting and traceability [20].

Middle East & Africa

Country Key Metric Key Driver
South Africa ~32% of regional share Commercial farming analytics adoption
Saudi Arabia CAGR ~14.0% Vision 2030 food security investments
Kenya USD ~18 million (2025) Smallholder mobile advisory platforms


The region starts from a small base but carries strong growth momentum. Saudi Arabia's Vision 2030 has allocated over USD 7 billion to food and agriculture development, with explicit emphasis on controlled-environment agriculture analytics [24]. In East Africa, mobile-based crop advisory services—operating over USSD and SMS channels—are reaching farmers that web-based platforms cannot.

Agriculture Analytics Market By Region, 2025-2035

Competitive Benchmarking

The agriculture analytics market exhibits moderate fragmentation, with an estimated Herfindahl-Hirschman Index (HHI) below 800 and the top five players collectively holding approximately 30–35% of global revenue. Competition spans hardware-centric OEMs, pure-play analytics startups, and diversified agri-input conglomerates—each pursuing distinct platform strategies and data moats[14].

Company Est. Revenue Share Range Key Offerings for Agriculture Analytics Strategic Positioning
Deere & Company ~8–11% Operations Center; See & Spray Vertically integrated equipment-to-analytics
Bayer (Climate Corp.) ~6–9% Climate FieldView Input-agnostic data platform
Corteva Agriscience ~5–7% Granular Insights Seed-to-harvest decision support
Trimble Inc. ~4–6% Trimble Ag Software GPS-precision and connectivity
BASF Digital Farming ~3–5% xarvio Digital Farming Crop protection-linked analytics
CNH Industrial ~3–5% PLM Intelligence Equipment-integrated data ecosystem
CropIn Technology ~2–4% CropIn Cloud Emerging market SaaS specialist
Farmers Edge ~2–3% Smart Solutions platform Variable rate technology analytics
AgriWebb ~1–3% Livestock management analytics Livestock-focused niche leader
Syngenta Group ~2–4% Cropwise platform Global crop protection data integration


Recent News & Developments

  • Deere & Company (March 2025): Expanded its See & Spray Ultimate system to cover soybean and cotton fields, leveraging real-time computer vision analytics to reduce herbicide use by up to 77% on treated acres [14].
  • Bayer Crop Science (January 2025): Announced Climate FieldView integration with Microsoft Azure FarmBeats, enabling growers to combine satellite, weather, and IoT sensor data within a unified analytics dashboard [25].
  • CropIn Technology (November 2024): Raised USD 28 million in a Series C extension led by ABC World Asia, earmarking funds for expansion of its AI-powered crop monitoring platform across Southeast Asia and East Africa [17].
  • European Commission (June 2024): Published implementing regulations for CAP eco-scheme digital reporting, requiring geo-tagged field activity records and creating mandatory demand for analytics platforms across 6.2 million EU farm holdings [5].
  • USDA (April 2024): Launched Phase 2 of the Partnerships for Climate-Smart Commodities program, committing an additional USD 1.1 billion to projects that include farm-level analytics and data collection components [4].
  • Syngenta Group (September 2023): Rolled out Cropwise Sustainability to help growers track and report on-farm carbon intensity, positioning the platform as an ESG compliance tool for downstream food companies [12].
  • Trimble Inc. (August 2022): Acquired Bilberry SAS, a French AI-based weed detection startup, to strengthen its real-time precision spraying analytics capabilities across European markets [8].
  • Indian Government (August 2023): Piloted the AgriStack digital framework in 100 districts, creating digitized farmer IDs linked to land records and crop data for analytics-driven agricultural extension [3].

Agriculture Analytics Market Report Scope

Parameter Detail
Market Scope Global Agriculture Analytics Market — software, services, hardware
Study Period 2021–2035
CAGR (Forecast Window) 11.9% (2026–2035)
Base Year Market Size USD 1.47 Billion (2025)
Forecast Endpoint USD 4.52 Billion (2035)
Fastest Growing Segment Predictive Analytics / AI-ML Modules (CAGR ~14.2%)
Fastest Growing Region Asia-Pacific (CAGR ~14.8%)
Companies Profiled 10 major players; 25+ additional vendors assessed
Valuation Currency USD (constant 2025 dollars)


FAQs

How should agricultural cooperatives evaluate analytics platform vendors to avoid lock-in with a single equipment OEM?
Cooperatives managing diverse fleets—often mixing Deere, CNH, AGCO, and CLAAS equipment—face real interoperability risks when selecting analytics platforms. The key evaluation criterion is data portability: does the platform support open standards like AgGateway's ADAPT framework and ISO 11783 (ISOBUS) for seamless data exchange between machines and software systems? [18] Cooperatives should demand contractual data export rights, API access for third-party integration, and multi-brand telematics compatibility. Platforms like Trimble Ag Software and independent players like AgDNA have built cross-OEM compatibility as a core differentiator. Prospective buyers should also assess whether the vendor's pricing model includes data access fees upon contract termination. This hidden cost can effectively trap organizations within an ecosystem even when they are technically free to leave.
What minimum farm size makes a standalone analytics platform subscription economically justified?
The breakeven point depends heavily on crop type and regional input costs. Still, MRFR's primary research suggests that for commodity row crops in North America, standalone platform subscriptions typically become ROI-positive at around 800–1,000 acres [1]. Below that threshold, growers often benefit more from cooperative pooling arrangements or retailer-bundled analytics included with seed or chemical purchases. For high-value specialty crops—wine grapes, berries, greenhouse vegetables—the breakeven can drop to as low as 50–100 acres, because the per-acre value of yield and quality optimization is significantly higher. Livestock operations follow a different calculus entirely, where herd size (typically 500+ head of cattle) rather than acreage drives the economics.
How are crop insurance companies influencing analytics platform design and adoption?
Insurers are moving from passive claims processors to active risk management partners, and this shift is reshaping platform requirements. Companies like Farmers Mutual Hail and Climate Corporation are co-developing analytics modules that integrate real-time field data with actuarial models, allowing dynamic premium adjustments based on demonstrated management practices [11]. Parametric insurance products—which trigger payouts based on weather index thresholds rather than field inspections—rely entirely on analytics-verified data streams. This creates a feedback loop where insurer mandates drive farmer adoption of specific platform capabilities, particularly around soil health monitoring analytics and weather station integration, effectively making the insurer a channel partner for analytics vendors.
What cybersecurity risks are specific to agriculture analytics platforms, and how are vendors addressing them?
Agricultural analytics platforms aggregate highly sensitive data—field boundaries, input application rates, yield maps, financial records—that could be exploited for commodity market manipulation or competitive intelligence theft. GPS-guided autonomous equipment connected to cloud analytics introduces additional attack surfaces, including the theoretical risk of command injection into field machinery [16]. Leading vendors are implementing zero-trust architectures, end-to-end encryption for telematics data, and SOC 2 Type II compliance certifications. The USDA's Cybersecurity & Infrastructure Security Agency (CISA) published sector-specific guidance for food and agriculture in 2024. Still, compliance remains voluntary, and smaller analytics startups often lack the resources for robust security infrastructure.
How does the quality of soil data inputs affect the reliability of analytics outputs, and what baseline investments are required?
Analytics platforms are only as good as their input data, and soil data presents unique calibration challenges. Grid-based soil sampling at 2.5-acre resolution—the current precision agriculture standard—costs approximately USD 8–12 per acre and should be refreshed every 3–4 years to account for nutrient cycling [9]. Platforms that rely solely on satellite-derived soil estimates (NDVI proxies) without ground-truth calibration can produce crop yield forecasting with analytics that carry error margins of 15–20%, versus 3–7% for sensor-calibrated models. Farmers considering analytics adoption should budget for baseline soil mapping, annual sensor maintenance, and periodic recalibration of IoT devices—costs that are rarely included in vendor subscription pricing but materially affect output accuracy.
Can agriculture analytics platforms integrate with carbon credit verification protocols, and what are the current gaps?
Integration remains early-stage but rapidly evolving. Platforms like Indigo Ag's Carbon and Syngenta's Cropwise Sustainability can estimate on-farm carbon sequestration using practice-change data (no-till adoption, cover cropping, reduced nitrogen application). However, verification protocols such as Verra's VM0042 and Gold Standard's Soil Organic Carbon framework require physical sampling and third-party audits that most analytics platforms cannot fully automate [12]. The current gap is in "measurement, reporting, and verification" (MRV) automation—bridging the distance between modeled carbon estimates and verified credits. Startups like Regrow Ag and Perennial are developing remote-sensing-based MRV solutions, but registry acceptance of purely digital verification remains inconsistent across voluntary and compliance carbon markets.
How are analytics platforms adapting to serve indoor and controlled-environment agriculture (CEA) differently from open-field farming?
CEA operations—vertical farms, greenhouses, and plant factories—generate 10–100x more data per square meter than open-field farms due to dense sensor networks controlling light, humidity, CO2, nutrient solutions, and airflow [24]. This volume demands different platform architectures: real-time streaming analytics with sub-minute decision cycles versus the daily or weekly batch processing typical in broadacre farming. Companies like Priva, Ridder, and Argus Controls dominate the CEA analytics niche with environment-control-integrated platforms. The Saudi Arabian and UAE markets are particularly significant, where food security imperatives and extreme climates make CEA the primary agricultural model, and analytics platforms must optimize energy costs (often 30–40% of CEA operating expenses) alongside crop yield. Claude works directly with your codebase Let Claude edit files, run commands, and ship changes from the desktop app, your terminal, or your IDE. Install
Author
Author
Author Profile
Aarti Dhapte LinkedIn
AVP - Research
A consulting professional focused on helping businesses navigate complex markets through structured research and strategic insights. I partner with clients to solve high-impact business problems across market entry strategy, competitive intelligence, and opportunity assessment. Over the course of my experience, I have led and contributed to 100+ market research and consulting engagements, delivering insights across multiple industries and geographies, and supporting strategic decisions linked to $500M+ market opportunities. My core expertise lies in building robust market sizing, forecasting, and commercial models (top-down and bottom-up), alongside deep-dive competitive and industry analysis. I have played a key role in shaping go-to-market strategies, investment cases, and growth roadmaps, enabling clients to make confident, data-backed decisions in dynamic markets.

Research Approach


Secondary Research

The secondary research process involved comprehensive analysis of agricultural technology databases, peer-reviewed agronomy journals, precision agriculture publications, and authoritative farming organizations. Key sources included the US Department of Agriculture (USDA), National Agricultural Statistics Service (NASS), Environmental Protection Agency (EPA), European Union Common Agricultural Policy (CAP) databases, Food and Agriculture Organization (FAO) of the United Nations, World Bank Agriculture & Food Global Practice, ISAAA (International Service for the Acquisition of Agri-biotech Applications), CropLife International, AgGateway (ADAPT protocol standards), Precision Agriculture Institute, American Society of Agricultural and Biological Engineers (ASABE), National Institute of Food and Agriculture (NIFA), EUROSTAT Agricultural Statistics, OECD-FAO Agricultural Outlook, Geological Survey Water Resources, National Oceanic and Atmospheric Administration (NOAA) Climate Data, and national agricultural ministry reports from key markets. These sources were used to collect agritech adoption statistics, regulatory compliance data, farm management system studies, yield optimization trends, and market landscape analysis for precision farming platforms, livestock monitoring systems, aquaculture management tools, and other agriculture analytics technologies.


Primary Research

Qualitative and quantitative insights were obtained by interviewing supply-side and demand-side stakeholders during the primary research process. The supply-side sources consisted of CEOs, VPs of Product Development, chief sustainability officers, and commercial directors from agricultural technology providers, precision farming OEMs, and agritech software vendors. Commercial farm operations managers, agricultural cooperative directors, chief technology officers of agribusiness enterprises, procurement leads from large-scale farming operations, livestock farm managers, aquaculture facility operators, and sustainability officers from food production companies comprised demand-side sources. The primary research validated market segmentation across deployment modes and farm sizes, confirmed product development roadmaps, and garnered insights on technology adoption barriers, pricing models for SaaS versus on-premise solutions, and subsidy program impacts.

Primary Respondent Breakdown:

By Designation: C-level Primaries (32%), Director Level (31%), Others (37%)

By Region: North America (38%), Europe (25%), Asia-Pacific (28%), Rest of World (9%)


Market Size Estimation

Global market valuation was derived through revenue mapping and implementation volume analysis. The methodology included:

Identification of 55+ key technology providers across North America, Europe, Asia-Pacific, and Latin America

Product mapping across cloud-based solutions, on-premise platforms, farm analytics modules, livestock monitoring systems, aquaculture management tools, and associated professional services

Analysis of reported and modeled annual revenues specific to agriculture analytics portfolios

Coverage of providers representing 75-80% of global market share in 2024

Extrapolation using bottom-up (implementation volume × ASP by region/farm size) and top-down (provider revenue validation) approaches to derive segment-specific valuations across deployment modes and farm categories

Download Free Sample

Kindly complete the form below to receive a free sample of this Report

Download PDF ×

We do not share your information with anyone. However, we may send you emails based on your report interest from time to time. You may contact us at any time to opt-out.

















