Chronic Kidney Disease Market (2026 - 2035)

Chronic Kidney Disease Market Research Report Information by Diagnosis (Blood Test, Urine Test, Imaging Test, and Kidney Biopsy), by Treatment (Drugs, Dialysis, and Kidney Transplant) , by Indication (Type 1 Or Type 2 Diabetes, High Blood Pressure, and Polycystic Kidney Disease), by End User (Hospital & Clinics and Diagnostic Centers), by Region (North America, Europe, Asia-Pacific, and Rest of the World) - Forecast till 2035

Forecast Period
2026-2035
CAGR
5.6%
2025 Market Size
USD 90.47 Billion
2035 Market Size
USD 155.94 Billion
Pharmaceutical ● Updated August 24, 2026 Report ID: MRFR/Pharma/4289-HCR | Pages: 110 | Author: Vikita Thakur, Rahul Gotadki

Chronic Kidney Disease Market Summary

The Chronic Kidney Disease Market reached USD 90.47 billion in 2025 and is projected to grow to USD 155.94 billion by 2035, expanding at a compound annual growth rate (CAGR) of 5.6% between 2026 and 2035. Market value is expected to reach USD 95.54 billion in 2026 as the first year of the forecast period. This growth is being driven primarily by U.S. reimbursement reform that rewards delayed dialysis initiation and label expansions for kidney-protective drug classes, alongside a broader shift toward home-based dialysis and earlier disease detection.

In the United States, the Centers for Medicare & Medicaid Services (CMS) Kidney Care Choices model ties nephrology reimbursement to delayed dialysis initiation rather than treatment volume. This reimbursement structure directly incentivizes nephrologists to prioritize disease management strategies that slow kidney function decline rather than maximizing dialysis sessions. At the same time, a wave of label expansions for SGLT2 inhibitors and non-steroidal mineralocorticoid receptor antagonists has moved kidney protection from a secondary endpoint to a primary prescribing rationale, expanding the addressable patient population for these drug classes.

Care delivery models are also shifting beneath these policy changes. The fixed chairs and fixed staffing model of in-center hemodialysis, requiring three sessions a week, is gradually losing volume to home hemodialysis cyclers, remote-monitored peritoneal dialysis, and algorithmic risk classification tools that flag deteriorating estimated glomerular filtration rate (eGFR) trends years before a nephrology referral is needed. Fresenius Medical Care and Baxter together invested more than USD 1.4 billion in connected-device and digital-therapy platforms between 2023 and 2025.

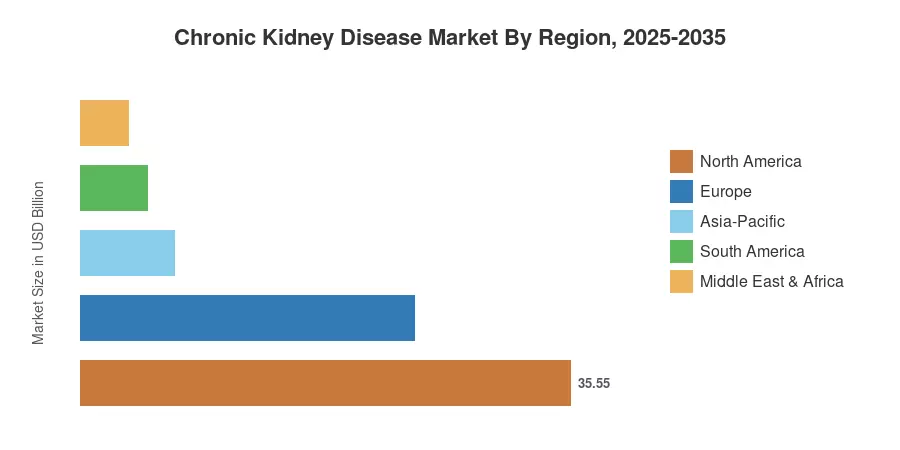
By region, North America holds the largest share of the Chronic Kidney Disease Market, at 39.3% of revenue. Asia-Pacific is the fastest-growing region, with a projected CAGR of 7.5%. Europe holds the second-largest share, at about USD 24.25 billion of 2025 revenue, driven by universal screening programs in Germany and the Nordic countries. Over the next decade, the Chronic Kidney Disease Market is expected to reward companies that identify disease earliest, rather than those that provide the highest volume of dialysis treatment.

Key Report Takeaways

Each takeaway below discloses a single headline metric; full detail sits in the referenced sections of this Chronic Kidney Disease Market study.

• By Product Type

  • Treatment products held 69.7% of revenue in 2025, spanning dialysis consumables, pharmacotherapy, and transplant support.
  • Diagnosis products expand at a 7.2% CAGR through 2035 as biomarker panels and AI triage tools scale.

• By End User

  • Hospitals commanded 40.1% of demand in 2025, reflecting their role in acute decompensation and care coordination.
  • Dialysis centres posted the fastest end-user CAGR at 6.5%, aided by outpatient capacity build-outs
  • Homecare settings generated roughly USD 12.40 billion in 2025 within the Chronic Kidney Disease Market.

• By Region

  • North America led with a 39.3% revenue share in 2025
  • Asia-Pacific is the fastest-growing region at a 7.5% CAGR to 2035
  • Europe contributed about USD 24.25 billion in 2025


Market Size and Forecast (2021–2035)

Estimates blend national renal registry volumes, payer claims databases, dialysis operator disclosures, and pharmaceutical net-price reporting, triangulated against manufacturer shipment data. Historical years are reconciled to audited company filings; forecast years apply an incidence-adjusted treated-population model layered with therapy-mix migration. Growth in the Chronic Kidney Disease Market accelerates modestly through the late 2020s before easing as cardio-renal pharmacotherapy slows dialysis conversion.
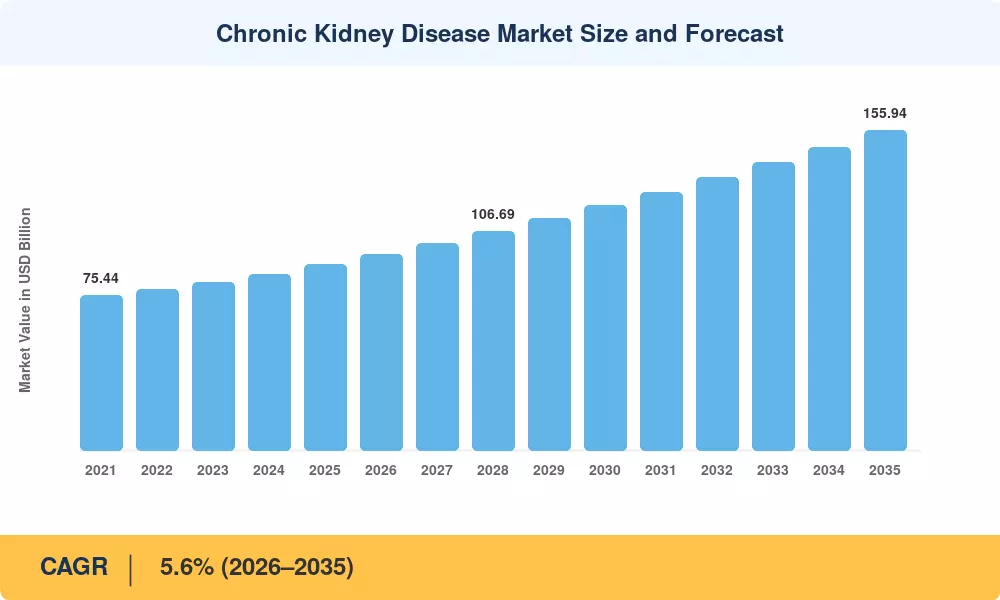
Chronic Kidney Disease Market Size and Forecast
Our Impact
Enabled $4.3B Revenue Impact for Fortune 500 and Leading Multinationals
Partnering with 2000+ Global Organizations Each Year
30K+ Citations by Top-Tier Firms in the Industry

Driver Impact Analysis

Driver ~% Impact on CAGR Geographic Relevance Impact Timeline
Rising diabetes and hypertension prevalence +1.30 pp Global Long-term (≥4 yr)
Cardio-renal pharmacotherapy label expansion +1.05 pp North America, Europe, Japan Medium-term (2–4 yr)
Value-based kidney care payment models +0.70 pp North America Medium-term (2–4 yr)
Demographic ageing of treated populations +0.60 pp Europe, Japan, China Long-term (≥4 yr)
Home and decentralised dialysis expansion +0.55 pp Global Medium-term (2–4 yr)
Emerging-market dialysis reimbursement +0.50 pp Asia-Pacific, MEA, South America Long-term (≥4 yr)
AI-enabled early detection and screening +0.40 pp North America, Europe Short-term (≤2 yr)


Diabetes and Hypertension Prevalence

Diabetes and hypertension account for about seven in ten occurrences of chronic kidney disease, and the International Diabetes Federation predicts that in 2024 there will be 589 million adults worldwide living with diabetes, which is expected to increase to 853 million by 2050 [1]. That base isn’t cyclical. This translates to a predictable annual cohort acquiring stage 3 disease and precisely why the Chronic Kidney Disease Market has relatively low revenue volatility relative to other treatment categories. Payers have taken notice: the US Renal Data System reports that Medicare spends >USD130 billion per year on beneficiaries with kidney disease, an amount that makes upstream intervention financially rational rather than simply therapeutically desirable [4].


Cardio-Renal Pharmacotherapy

2021-2025 Dapagliflozin, empagliflozin and finerenone reset prescribing logic. The DAPA-CKD trial demonstrated a 39% reduction in the composite renal outcome, and FIGARO-DKD showed improvement in earlier albuminuria stages [6]. Decline is currently controlled by nephrologists who earlier managed it. The revenue mix changes with renal protection drugs gaining share of expenditure and dialysis conversion rates softening. This replacement effect is built into the post-2031 CAGR slowdown illustrated in Section 3.


Value-Based Kidney Care Models

CMS structured its Kidney Care Choices model to pay nephrology practices for keeping patients off dialysis, with transplant bonuses reaching USD 15,000 per beneficiary staged over three years [3]. Roughly 130 participating entities covered several hundred thousand beneficiaries by 2025. Commercial payers copied the design. The practical consequence is a procurement shift toward diagnostics, remote monitoring, and care-navigation software rather than incremental dialysis chairs.

Home and Decentralised Modalities

Baxter's Sharesource platform and Fresenius' connected cyclers now transmit treatment telemetry from tens of thousands of homes, and Japan's MHLW raised peritoneal dialysis reimbursement in its 2024 revision to lift home penetration above 5% [17][20]. Capital intensity falls, staffing per patient falls, and margin per treatment rises — three reasons operators keep funding the transition despite slower patient recruitment.


Restraints Impact Analysis

Restraint attributions follow the same directional convention as Section 4. Each figure estimates suppressed growth in CAGR basis points; the values are analyst judgements, not additive subtractions from the headline rate for the Chronic Kidney Disease Market.

Restraint ~% Impact on CAGR Geographic Relevance Impact Timeline
Dialysis nursing and technician shortages −0.60 pp North America, Europe Short-term (≤2 yr)
Payer pressure on branded drug pricing −0.50 pp North America, Europe Medium-term (2–4 yr)
Late-stage diagnosis and low screening uptake −0.45 pp Global Long-term (≥4 yr)
Capital and reimbursement gaps in low-income markets −0.40 pp MEA, South America Long-term (≥4 yr)
Transplant organ supply constraints −0.30 pp Global Long-term (≥4 yr)


Workforce Scarcity in Dialysis Delivery

Clinics cannot run chairs they cannot staff. US dialysis operators reported technician turnover near 25% annually through 2023–2024, and several markets capped new shift openings rather than risk quality citations [12]. Wage inflation of 6–8% compressed operator margins faster than reimbursement updates restored them. Automation helps at the margin, but a haemodialysis session still requires trained supervision, which puts a hard ceiling on volume growth in mature markets.

Pricing Pressure on Branded Therapies

The Inflation Reduction Act placed multiple cardio-metabolic agents into Medicare price negotiation, with negotiated prices effective from 2026 and 2027 [7]. European biosimilar erythropoietin competition already cut anaemia-management pricing substantially. Volume in the Chronic Kidney Disease Market keeps rising; realised price per patient does not, which is why value forecasts grow slower than treated-population forecasts.

Late Detection

The International Society of Nephrology's Global Kidney Health Atlas found that fewer than half of surveyed countries operate national screening programmes, and a large share of patients present within 90 days of needing renal replacement [9]. Late presentation removes the entire pharmacotherapy revenue window and pushes patients directly into the costliest, least profitable emergency-start pathway.


Chronic Kidney Disease Market Opportunities

Point-of-Care Biomarker Panels

Combining uACR with cystatin C and emerging tubular-injury markers compresses risk stratification from weeks to a single primary-care visit. Diagnostics remain the fastest-growing product line in the Chronic Kidney Disease Market at a 7.2% CAGR, and vendors that secure primary-care distribution rather than nephrology-only placement capture the larger volume pool.

Algorithmic Risk Stratification as a Service

Health systems increasingly buy prediction, not software. Kidney-failure risk equations embedded into electronic health records and sold per-covered-life align neatly with capitated contracts [3]. Vendors monetise longitudinal renal datasets through outcomes-linked pricing, a model already proven in cardiometabolic care.

Emerging-Market Dialysis Networks

India's Pradhan Mantri National Dialysis Programme extended free haemodialysis across more than 1,500 district facilities, and Indonesia's JKN scheme now funds renal replacement for a large insured base [13]. Asset-light franchise models — operator supplies machines and protocols, government supplies premises and staff — convert public budgets into recurring consumables revenue.

Transplant-Adjacent Care

Organ perfusion technology, non-invasive rejection surveillance, and immunosuppression optimisation sit outside conventional dialysis economics but grow alongside them. UNOS recorded more than 27,000 US kidney transplants in 2023, an annual record [5]. Each transplant creates a decade of follow-up revenue for the Chronic Kidney Disease Market that dialysis operators rarely capture today.

Rare Nephropathy Franchises

IgA nephropathy, C3 glomerulopathy, and Alport syndrome carry orphan designations, accelerated pathways, and premium pricing on small trial populations [18]. Approvals for sparsentan and complement inhibitors validated the thesis, and several mid-cap developers now build entire pipelines around it.


Chronic Kidney Disease Market Future Outlook

Predictive Nephrology at Scale

By the early 2030s, risk scoring will run continuously rather than at annual review. Health systems already hold the inputs — creatinine trends, albuminuria, medication history — and the marginal cost of scoring is near zero. Growth in the Chronic Kidney Disease Market increasingly accrues to whoever owns the referral trigger, because detection timing determines which therapies a patient ever receives [9].

Platform Economics in Dialysis

Device makers are becoming service platforms. Recurring consumables, connectivity subscriptions, and outcomes-linked contracts now generate a larger share of Fresenius and Baxter renal revenue than hardware sales [16][17]. Expect installed-base defence, not machine innovation, to define competitive strategy through 2030.

Decentralisation and the Clinic Footprint

Home penetration above 20% in major markets would strand a meaningful share of existing in-centre capacity. Operators are hedging by converting fixed clinics into hybrid training-and-support hubs, a model already piloted across Australia and the Nordics [14]. Real-estate flexibility becomes a balance-sheet advantage.

Equity, ESG, and Sustainable Dialysis

Each haemodialysis session consumes roughly 300–500 litres of water, and large operators now report renal-specific water and carbon intensity in sustainability disclosures [23]. Tender scoring in Europe increasingly weights environmental performance. Sustainability moves from reporting obligation to procurement criterion in the Chronic Kidney Disease Market, favouring vendors with water-recycling and low-power cycler designs.


Chronic Kidney Disease Market Segmentation

Segmentation in the Chronic Kidney Disease Market follows product type, end user, and geography, with each dimension disclosing a single headline metric below.

By Product Type

Segment Metric Primary Demand Driver
Treatment 69.7% revenue share (2025) Dialysis consumables, pharmacotherapy, transplant support
Diagnosis 7.2% CAGR (2026–2035) Biomarker panels, imaging, AI-based risk stratification


Treatment dominates because renal replacement is continuous, expensive, and non-discretionary — a single haemodialysis patient consumes over 150 treatments annually. Diagnosis grows faster from a smaller base as payers fund detection they previously ignored. The gap between the two segments narrows through the 2030s but does not close, and the Chronic Kidney Disease Market stays treatment-weighted throughout the study period.

By End User

Segment Metric Primary Demand Driver
Hospitals 40.1% revenue share (2025) Acute kidney injury, comorbidity management, transplant surgery
Dialysis Centres 6.5% CAGR (2026–2035) Outpatient capacity expansion and operator consolidation
Homecare Settings USD 12.40 Billion (2025) Peritoneal dialysis and connected home haemodialysis
Other End Users 4.1% CAGR (2026–2035) Ambulatory clinics, research institutions, long-term care


Hospitals retain the largest share of the Chronic Kidney Disease Market because advanced kidney disease rarely travels alone; cardiovascular events, infection, and metabolic crises route patients back to inpatient settings regardless of where routine dialysis happens. Dialysis centres nonetheless outgrow hospitals as tariff structures reward outpatient delivery, and homecare quietly compounds as kidney disease management drugs and remote monitoring reduce the clinical case for supervised sessions.


Regional Market Share Analysis

Region Metric (2025) Primary Investment Themes
North America 39.3% revenue share Value-based nephrology, home dialysis, precision therapeutics
Europe USD 24.25 Billion Universal screening, biosimilar adoption, cross-border HTA
Asia-Pacific 7.5% CAGR (2026–2035) Public dialysis networks, domestic device manufacturing
South America 5.4% revenue share Private clinic consolidation, public tender supply
Middle East & Africa USD 3.51 Billion Sovereign health investment, transplant infrastructure
Total USD 90.47 Billion

Regional performance in the Chronic Kidney Disease Market splits along reimbursement maturity rather than disease prevalence. Wealthy markets monetise each patient heavily; high-burden markets monetise volume.


North America

Country Metric Key Driver
US 84.5% of regional revenue Medicare ESRD entitlement and Kidney Care Choices
Canada USD 3.10 Billion (2025) Provincial home-dialysis targets
Mexico 6.8% CAGR (2026–2035) IMSS coverage expansion for renal replacement


The US remains the single most valuable geography in the Chronic Kidney Disease Market because Medicare covers end-stage renal disease irrespective of age, creating a guaranteed payer for roughly 800,000 treated patients [4]. Canada's provincial systems push home modalities harder than any comparable jurisdiction, with British Columbia and Ontario exceeding 25% home penetration. Mexico's growth comes from a lower base as IMSS and IMSS-Bienestar absorb previously out-of-pocket dialysis demand.

Europe

Country Metric Key Driver
Germany 22.4% of regional revenue Dense clinic network, statutory insurance coverage
UK USD 3.36 Billion (2025) NHS Renal Services Transformation Programme
France 14.9% of regional revenue REIN registry-driven care planning
Italy USD 2.55 Billion (2025) Regional dialysis procurement consolidation
Spain 8.1% of regional revenue Highest transplant rate globally
Nordic Countries 5.2% CAGR (2026–2035) Early screening and primary-care integration
Russia USD 1.62 Billion (2025) State dialysis programme expansion
Rest of Europe 4.6% CAGR (2026–2035) CEE capacity catch-up


Europe's economics differ from North America's: statutory tariffs cap per-treatment revenue, so growth comes from earlier detection and drug mix rather than volume. Spain's ONT transplant model, running above 50 deceased donors per million population, structurally reduces dialysis years per patient while expanding follow-up care spend [8][14].

Asia-Pacific

Country Metric Key Driver
China 31.8% of regional revenue Urban resident insurance dialysis coverage
India 8.9% CAGR (2026–2035) Pradhan Mantri National Dialysis Programme
Japan USD 5.12 Billion (2025) World's highest dialysis prevalence per capita
South Korea 7.4% of regional revenue NHIS reimbursement and clinic density
ASEAN 8.2% CAGR (2026–2035) Indonesia JKN and Vietnam social insurance
Rest of Asia-Pacific USD 2.18 Billion (2025) Australia and New Zealand home dialysis leadership


Asia-Pacific supplies the growth engine of the Chronic Kidney Disease Market. China treats over one million dialysis patients with penetration still well below need, and domestic manufacturers such as SWS Hemodialysis Care and Weigao have driven equipment prices down sharply, expanding affordable capacity [13][21]. India's programme model — public premises, private operators, per-session tariffs — has become the reference template for other low-cost markets.

South America

Country Metric Key Driver
Brazil 52.6% of regional revenue SUS universal dialysis funding
Argentina USD 0.71 Billion (2025) PAMI and provincial coverage
Rest of South America 5.9% CAGR (2026–2035) Chile and Colombia clinic expansion


Brazil's SUS funds the overwhelming majority of the region's dialysis sessions through nationally set tariffs, which makes operator profitability a direct function of federal budget revisions [19]. Consolidation continues as smaller independent clinics sell into regional chains seeking procurement scale.

Middle East & Africa

Country Metric Key Driver
Saudi Arabia 24.8% of regional revenue Vision 2030 health sector transformation
UAE USD 0.44 Billion (2025) Mandatory insurance and medical tourism
South Africa 6.1% CAGR (2026–2035) Private sector dialysis growth
Egypt 13.2% of regional revenue High hepatitis-related renal burden
Rest of MEA USD 0.85 Billion (2025) Gulf sovereign health investment


Gulf states invest ahead of demand. Saudi Arabia's Health Sector Transformation Programme funds new nephrology centres and transplant capability as part of a broader privatisation push. At the same time, Egypt's burden reflects decades of hepatitis C sequelae now presenting as renal failure [22]. Sub-Saharan access remains the sharpest global inequity, with treated prevalence a small fraction of estimated need.


Chronic Kidney Disease Market By Region, 2025-2035

Competitive Benchmarking

Concentration in the Chronic Kidney Disease Market is high by healthcare standards. Estimated HHI sits in the 1,450–1,650 band, with the top five participants controlling roughly 34–38% of global revenue. Vertical integration explains much of it: Fresenius manufactures machines, operates clinics, and supplies dialysate, while DaVita's scale gives it procurement leverage few independents match. Pharmaceutical participants compete on a different axis entirely, chasing earlier-stage patients that dialysis operators never see.

Company Est. Revenue Share Range Key Offerings for Chronic Kidney Disease Market Strategic Positioning
Fresenius Medical Care AG ~9–12% Dialysis machines, dialysers, clinic network, connected care Vertically integrated global leader
Baxter International Inc. ~6–8% Peritoneal dialysis systems, Sharesource platform, HD solutions Home modality and connectivity specialist
DaVita Inc. ~5–7% Outpatient and home dialysis services, integrated kidney care US services scale player
AstraZeneca plc ~5–7% Dapagliflozin, roxadustat, cardio-renal portfolio Pharmacotherapy category creator
Bayer AG ~4–6% Finerenone, cardio-renal pipeline Non-steroidal MRA franchise leader
Amgen Inc. ~3–5% Anaemia and mineral bone disorder therapeutics Established nephrology biologics base
Novartis AG ~3–5% Iptacopan, rare nephropathy pipeline Complement and rare disease focus
Boehringer Ingelheim ~3–4% Empagliflozin renal indications Cardio-renal-metabolic co-marketing
CSL Vifor ~2–4% Iron therapies, phosphate binders, sparsentan Renal-dedicated specialty portfolio
Otsuka Pharmaceutical ~2–3% Tolvaptan for polycystic kidney disease Rare renal indication leadership
GSK plc ~1–3% Daprodustat, anaemia management HIF-PHI segment entrant
Akebia Therapeutics ~1–2% Vadadustat, phosphate management Focused mid-cap nephrology developer


Recent News & Developments

  • Novartis (March 2024): Received FDA accelerated approval for iptacopan in paroxysmal nocturnal haemoglobinuria and advanced filings in IgA nephropathy, opening a complement-driven revenue line in rare renal disease [10].
  • CSL Vifor and Travere (2023): Sparsentan gained accelerated approval for IgA nephropathy, validating premium pricing on orphan nephropathies and drawing new developer entrants [18].
  • CMS (January 2024): Expanded the Kidney Care Choices model into additional performance years with revised transplant bonus structures, deepening incentives to delay dialysis initiation [3].
  • Bayer (2024): Reported finerenone crossing blockbuster trajectory in cardio-renal indications following broadened European reimbursement across major markets [6].
  • Fresenius Medical Care (2024): Completed a multi-year operating model overhaul, divesting non-core assets and concentrating capital on care delivery and connected products [16].
  • Baxter (2025): Extended remote peritoneal dialysis management across additional Asia-Pacific markets, targeting home penetration gains in Japan and Australia [17].
  • AstraZeneca (2025): Announced expanded real-world evidence collaborations on dapagliflozin renal outcomes with several national registries, supporting earlier-stage prescribing [6].
  • Government of India (2024): Broadened the national dialysis programme's district coverage and added peritoneal dialysis provisioning to the scheme [13].


Chronic Kidney Disease Market Report Scope

Parameter Detail
Market Scope Global Chronic Kidney Disease Market covering diagnosis and treatment products across hospitals, dialysis centres, homecare, and other end users.
Study Period 2021–2035 (Historical 2021–2024; Base Year 2025; Forecast 2026–2035)
CAGR 5.6% (2026–2035)
Market Size Checkpoints USD 90.47 Billion (2025); USD 95.54 Billion (2026); USD 155.94 Billion (2035)
Fastest Growing Segments Diagnosis products (7.2% CAGR); Dialysis centres (6.5% CAGR); Asia-Pacific (7.5% CAGR)
Companies Profiled Fresenius Medical Care, Baxter, DaVita, AstraZeneca, Bayer, Amgen, Novartis, Boehringer Ingelheim, CSL Vifor, Otsuka, GSK, Akebia
Valuation Currency USD Billion, constant 2025 exchange rates

FAQs

What should procurement teams evaluate when selecting a dialysis equipment vendor?
Prioritise service-network density, consumables contract terms, and remote-monitoring interoperability over headline machine price. Seven-year total cost of ownership typically exceeds acquisition cost several times over, and consumables lock-in drives most of that gap [12].
How does the Chronic Kidney Disease Market absorb biosimilar erythropoietin competition?
Biosimilar erythropoiesis-stimulating agents have compressed anaemia-management pricing sharply across Europe since 2019. Suppliers now compete on bundled anaemia and iron-management protocols rather than molecule price alone [7].
Which regulatory nuance most affects new entrants to the Chronic Kidney Disease Market in Europe?
EU Regulation 2021/2282 introduced joint clinical assessments, phasing across therapeutic areas through 2030. Nephrology entrants should build comparative-effectiveness dossiers before national pricing negotiations begin [15].
Are AI-based kidney risk stratification tools reimbursable today?
Coverage remains inconsistent. US Medicare funds a narrow set of algorithm-driven services through emerging code pathways, while most European systems pay for them only inside integrated or capitated care contracts [11].
What integration challenge slows home dialysis adoption most?
Connectivity. Cyclers must write treatment logs into electronic health records without manual re-entry, and many legacy nephrology systems still lack modern interoperability endpoints, forcing expensive middleware builds [11].
How does the Chronic Kidney Disease Market treat pediatric and rare nephropathy niches?
Orphan designations for IgA nephropathy and C3 glomerulopathy allow smaller trials and premium pricing. These indications now attract venture funding disproportionate to their patient volume [18].
What is the biggest investment risk for private dialysis operators?
Reimbursement concentration. Where one public payer sets tariffs for most treatments, a single budget revision can reset operator margins within a fiscal year, as Brazilian and Indian operators have experienced [19].    
Author
Author
Author Profile
Vikita Thakur LinkedIn
Senior Research Analyst
She holds an experience of about 5+ years in market research and business consulting projects for sectors such as life sciences, medical devices, and healthcare IT. She possesses a robust background in data analysis, market estimation, competitive intelligence, pipeline analysis market trend identification, and consumer behavior insights. Her expertise lies in technical Sales support, client interaction and project management, designing and implementing market research studies, conducting competitive analysis, and synthesizing complex data into actionable recommendations that drive business growth.
Co-Author
Co-Author Profile
Rahul Gotadki LinkedIn
Research Manager
He holds an experience of about 9+ years in Market Research and Business Consulting, working under the spectrum of Life Sciences and Healthcare domains. Rahul conceptualizes and implements a scalable business strategy and provides strategic leadership to the clients. His expertise lies in market estimation, competitive intelligence, pipeline analysis, customer assessment, etc.
Share::
Request Free Sample

Research Approach


Secondary Research

The secondary research process involved comprehensive analysis of regulatory databases, peer-reviewed nephrology journals, clinical publications, and authoritative health organizations. Key sources included the US Food & Drug Administration (FDA) Center for Drug Evaluation and Research (CDER) and Center for Devices and Radiological Health (CDRH), European Medicines Agency (EMA), Centers for Medicare & Medicaid Services (CMS) ESRD Program data, United States Renal Data System (USRDS), National Institute of Diabetes and Digestive and Kidney Diseases (NIDDK/NIH), National Kidney Foundation (NKF), American Society of Nephrology (ASN), European Renal Association (ERA), International Society of Nephrology (ISN), National Health Service (NHS) England Kidney Care, Australian Institute of Health and Welfare (AIHW), National Center for Biotechnology Information (NCBI/PubMed), Cochrane Library, Lancet Nephrology, Journal of the American Society of Nephrology (JASN), World Health Organization (WHO) Global Health Observatory, CDC National Chronic Kidney Disease Surveillance System, OECD Health Statistics, and national renal registries from key markets. These sources were used to collect dialysis/transplant procedure statistics, regulatory approval data for renal drugs and devices, CKD prevalence and epidemiology trends, clinical safety and efficacy studies, reimbursement policies, and market landscape analysis for dialysis equipment (hemodialysis and peritoneal dialysis), renal transplantation solutions, CKD therapeutics (ACE inhibitors, ARBs, SGLT2 inhibitors, ESA, phosphate binders), and diagnostic modalities.


Primary Research

Qualitative and quantitative insights were obtained by interviewing supply-side and demand-side stakeholders during the primary research process. Dialysis equipment manufacturers (e.g., Fresenius Medical Care, Baxter), renal pharmaceutical companies, home dialysis solution providers, diagnostic reagent suppliers, and transplant technology developers were among the supply-side sources. These sources included CEOs, VPs of Global Operations, regulatory affairs heads, and commercial directors. Demand-side sources included dialysis center medical directors, board-certified nephrologists, transplant surgeons, nurse practitioners, procurement leaders from hospital systems and IDNs (Integrated Delivery Networks), and administrators from outpatient dialysis clinics and diagnostic laboratories. Primary research has confirmed renal therapy product pipeline timelines, gathered insights on clinical workflow integration, dialysis center capacity expansion, pricing strategies for dialysis consumables, renal drug reimbursement dynamics, and shifts toward home-based dialysis adoption. Additionally, market segmentation has been validated across diagnosis types (blood tests, urine tests, imaging tests, kidney biopsy), treatment modalities (drugs, dialysis, kidney transplant), indication-specific adoption patterns (Type 1/2 diabetes, high blood pressure, polycystic kidney disease), renal therapy product pipeline timelines, and kidney transplantation.

Primary Respondent Breakdown:

• By Designation: C-level Primaries (42%), Director Level (25%), Others (33%)

• By Region: North America (33%), Europe (30%), Asia-Pacific (28%), Rest of World (9%)


Market Size Estimation

Global market valuation was derived through revenue mapping and procedure volume analysis specific to CKD management. The methodology included:

• Identification of 50+ key manufacturers and service providers across renal pharmaceuticals (ESAs, phosphate binders, SGLT2 inhibitors), dialysis equipment (hemodialysis machines, peritoneal dialysis cycler systems), dialysis consumables (dialyzers, bloodlines, concentrates), and kidney transplantation technologies

• Product and service mapping across diagnosis segments (blood tests for eGFR/creatinine, urine albumin-to-creatinine ratio tests, ultrasound/CT imaging, kidney biopsy devices), treatment categories (pharmacological therapies, in-center hemodialysis, home peritoneal dialysis, transplant immunosuppressants), and end-user settings (hospitals, dialysis clinics, diagnostic centers)

• Analysis of reported and modeled annual revenues specific to CKD treatment portfolios, including dialysis session volumes, transplant procedure counts, and pharmaceutical sales data by indication (diabetes-related CKD, hypertensive nephropathy, polycystic kidney disease)

• Coverage of manufacturers and service providers representing 75-80% of global market share in 2024, encompassing major dialysis providers (e.g., DaVita, Fresenius Medical Care) and renal pharmaceutical leaders

• Extrapolation using bottom-up (procedure volume × ASP by country/region; dialysis patient prevalence × therapy costs; drug-treated patient population × average annual therapy cost) and top-down (manufacturer revenue validation, healthcare expenditure analysis on renal services) approaches to derive segment-specific valuations for diagnostics, therapeutics, and renal replacement therapies

Share::
Request Free Sample
Download Free Sample

Kindly complete the form below to receive a free sample of this Report

* Please use a valid business email

Share::
Request Free Sample
Download PDF ×

We do not share your information with anyone. However, we may send you emails based on your report interest from time to time. You may contact us at any time to opt-out.
















