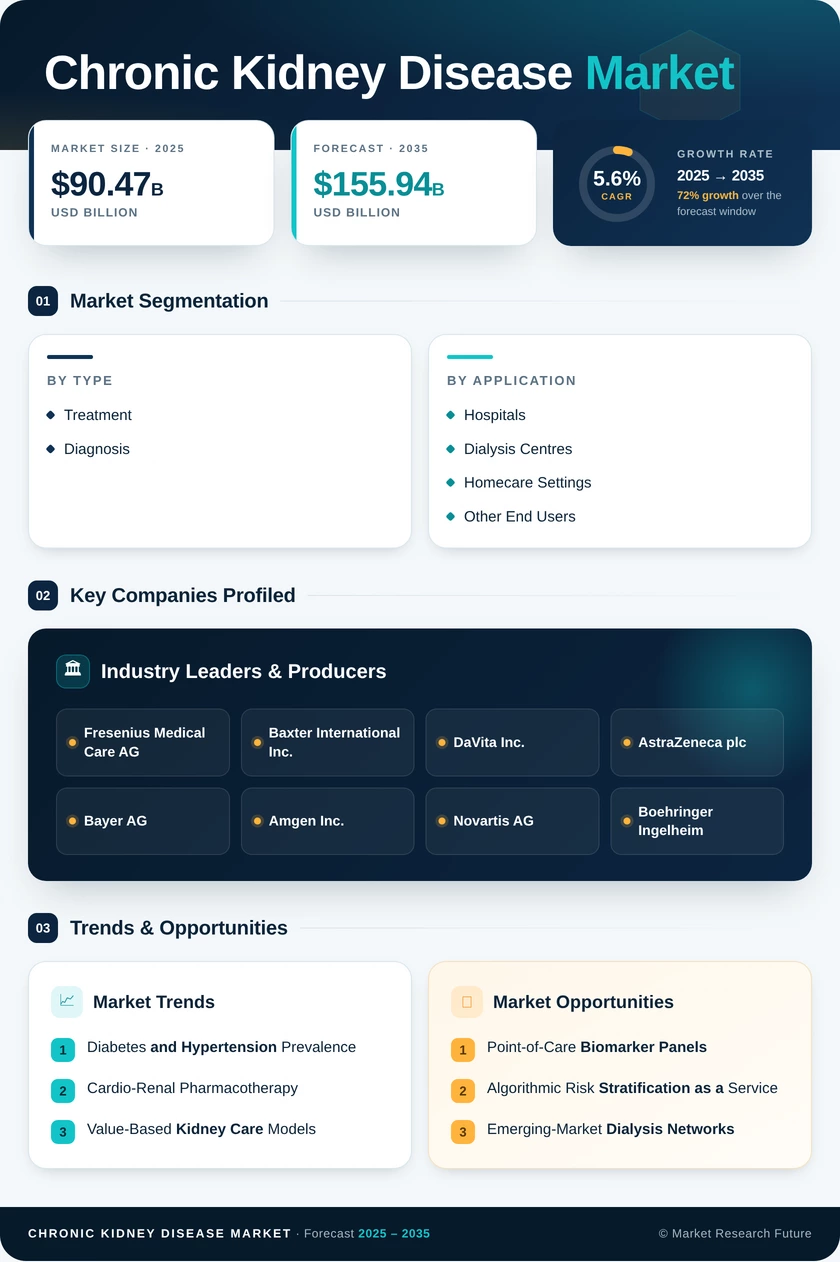
Chronic Kidney Disease Market (2026 - 2035)

Chronic Kidney Disease Market Research Report Information by Diagnosis (Blood Test, Urine Test, Imaging Test, and Kidney Biopsy), by Treatment (Drugs, Dialysis, and Kidney Transplant) , by Indication (Type 1 Or Type 2 Diabetes, High Blood Pressure, and Polycystic Kidney Disease), by End User (Hospital & Clinics and Diagnostic Centers), by Region (North America, Europe, Asia-Pacific, and Rest of the World) - Forecast till 2035

Forecast Period
2026-2035
CAGR
5.6%
2025 Market Size
USD 90.47 Billion
2035 Market Size
USD 155.94 Billion
Pharmaceutical ● Updated August 2026 Report ID: MRFR/Pharma/4289-HCR | Pages: 110 | Author: Vikita Thakur, Rahul Gotadki
  1. 1 Market Overview |
    1. 1.1 Study Assumptions & Market Definition |
    2. 1.2 Scope of the Study |
    3. 1.3 Research Methodology
  2. 2 Market Summary & Key Report Takeaways |
    1. 2.1 By Product Type |
    2. 2.2 By End User |
    3. 2.3 By Geography
  3. 3 Market Size & Forecast (2021–2035) |
    1. 3.1 Historical Market Size (2021–2024) |
    2. 3.2 Base Year Assessment (2025) |
    3. 3.3 Forecast Market Size (2026–2035) |
    4. 3.4 Year-over-Year Growth Analysis
  4. 4 Driver Impact Analysis |
    1. 4.1 Diabetes and Hypertension Prevalence |
    2. 4.2 Cardio-Renal Pharmacotherapy Expansion |
    3. 4.3 Value-Based Kidney Care Models |
    4. 4.4 Home and Decentralised Modalities
  5. 5 Restraints Impact Analysis |
    1. 5.1 Workforce Scarcity in Dialysis Delivery |
    2. 5.2 Pricing Pressure on Branded Therapies |
    3. 5.3 Late Detection and Screening Gaps
  6. 6 Opportunity Analysis |
    1. 6.1 Point-of-Care Biomarker Panels |
    2. 6.2 Algorithmic Risk Stratification as a Service |
    3. 6.3 Emerging-Market Dialysis Networks |
    4. 6.4 Transplant-Adjacent Care |
    5. 6.5 Rare Nephropathy Franchises |
    6. 6.6 Industry Value Chain Analysis |
    7. 6.7 Porter's Five Forces Analysis
  7. 7 Regional Market Share & Country-Level Analysis |
    1. 7.1 North America | |
      1. 7.1.1 US | |
      2. 7.1.2 Canada | |
      3. 7.1.3 Mexico |
    2. 7.2 Europe | |
      1. 7.2.1 Germany | |
      2. 7.2.2 UK | |
      3. 7.2.3 France | |
      4. 7.2.4 Italy | |
      5. 7.2.5 Spain | |
      6. 7.2.6 Nordic Countries | |
      7. 7.2.7 Russia | |
      8. 7.2.8 Rest of Europe |
    3. 7.3 Asia-Pacific | |
      1. 7.3.1 China | |
      2. 7.3.2 India | |
      3. 7.3.3 Japan | |
      4. 7.3.4 South Korea | |
      5. 7.3.5 ASEAN | |
      6. 7.3.6 Rest of Asia-Pacific |
    4. 7.4 South America | |
      1. 7.4.1 Brazil | |
      2. 7.4.2 Argentina | |
      3. 7.4.3 Rest of South America |
    5. 7.5 Middle East & Africa | |
      1. 7.5.1 Saudi Arabia | |
      2. 7.5.2 UAE | |
      3. 7.5.3 South Africa | |
      4. 7.5.4 Egypt | |
      5. 7.5.5 Rest of Middle East & Africa
  8. 8 Future Outlook (2026–2035) |
    1. 8.1 Predictive Nephrology at Scale |
    2. 8.2 Platform Economics in Dialysis |
    3. 8.3 Decentralisation and the Clinic Footprint |
    4. 8.4 Equity, ESG and Sustainable Dialysis
  9. 9 Market Segmentation Analysis |
    1. 9.1 By Product Type | |
      1. 9.1.1 Diagnosis | |
      2. 9.1.2 Treatment |
    2. 9.2 By End User | |
      1. 9.2.1 Hospitals | |
      2. 9.2.2 Dialysis Centres | |
      3. 9.2.3 Homecare Settings | |
      4. 9.2.4 Other End Users
  10. 10 Competitive Landscape |
    1. 10.1 Market Concentration Analysis (2026) |
    2. 10.2 Competitive Benchmarking Matrix |
    3. 10.3 Company Profiles | |
      1. 10.3.1 Fresenius Medical Care AG | |
      2. 10.3.2 Baxter International Inc. | |
      3. 10.3.3 DaVita Inc. | |
      4. 10.3.4 AstraZeneca plc | |
      5. 10.3.5 Bayer AG | |
      6. 10.3.6 Amgen Inc. | |
      7. 10.3.7 Novartis AG | |
      8. 10.3.8 Boehringer Ingelheim | |
      9. 10.3.9 CSL Vifor | |
      10. 10.3.10 Otsuka Pharmaceutical | |
      11. 10.3.11 GSK plc | |
      12. 10.3.12 Akebia Therapeutics
  11. 11 Recent News & Developments
  12. 12 Report Scope & Methodology
  13. 13 Detailed Sources & Citations
  14. 14 Frequently Asked Questions
  15. 15 LIST OF TABLES |
  16. TABLE 1 Global Chronic Kidney Disease Market Size & Forecast, by Revenue (USD Billion), 2021–2035 |
  17. TABLE 2 Global Chronic Kidney Disease Market – Year-over-Year Growth Analysis, 2021–2035 |
  18. TABLE 3 Driver Impact Analysis Matrix, 2026–2035 |
  19. TABLE 4 Restraint Impact Analysis Matrix, 2026–2035 |
  20. TABLE 5 Global Market Size, by Region, 2021–2035 (USD Billion) |
  21. TABLE 6 North America Market Size, by Country, 2021–2035 (USD Billion) |
  22. TABLE 7 Europe Market Size, by Country, 2021–2035 (USD Billion) |
  23. TABLE 8 Asia-Pacific Market Size, by Country, 2021–2035 (USD Billion) |
  24. TABLE 9 South America Market Size, by Country, 2021–2035 (USD Billion) |
  25. TABLE 10 Middle East & Africa Market Size, by Country, 2021–2035 (USD Billion) |
  26. TABLE 11 Global Market Size, by Product Type, 2021–2035 (USD Billion) |
  27. TABLE 12 Global Market Size, by End User, 2021–2035 (USD Billion) |
  28. TABLE 13 North America Market Size, by Product Type, 2021–2035 (USD Billion) |
  29. TABLE 14 North America Market Size, by End User, 2021–2035 (USD Billion) |
  30. TABLE 15 Europe Market Size, by Product Type, 2021–2035 (USD Billion) |
  31. TABLE 16 Europe Market Size, by End User, 2021–2035 (USD Billion) |
  32. TABLE 17 Asia-Pacific Market Size, by Product Type, 2021–2035 (USD Billion) |
  33. TABLE 18 Asia-Pacific Market Size, by End User, 2021–2035 (USD Billion) |
  34. TABLE 19 South America Market Size, by Product Type, 2021–2035 (USD Billion) |
  35. TABLE 20 South America Market Size, by End User, 2021–2035 (USD Billion) |
  36. TABLE 21 Middle East & Africa Market Size, by Product Type, 2021–2035 (USD Billion) |
  37. TABLE 22 Middle East & Africa Market Size, by End User, 2021–2035 (USD Billion) |
  38. TABLE 23 Competitive Benchmarking Matrix, 2026 |
  39. TABLE 24 Company Profiles – Key Players |
  40. TABLE 25 Recent Developments & Strategic Announcements, 2023–2025 |
  41. TABLE 26 Report Scope & Methodology Summary |
  42. TABLE 27 Detailed Sources & Citations Index
  43. 16 LIST OF FIGURES |
  44. FIGURE 1 Market Dynamics – Drivers, Restraints and Opportunities Overview |
  45. FIGURE 2 Industry Value Chain Analysis |
  46. FIGURE 3 Porter's Five Forces Analysis |
  47. FIGURE 4 Global Market Size Trend Line, 2021–2035 (USD Billion) |
  48. FIGURE 5 Year-over-Year Growth Curve, 2022–2035 |
  49. FIGURE 6 Market Share by Product Type, 2025 vs 2035 |
  50. FIGURE 7 Market Share by End User, 2025 vs 2035 |
  51. FIGURE 8 Regional Revenue Share Distribution, 2025 |
  52. FIGURE 9 Regional CAGR Comparison, 2026–2035 |
  53. FIGURE 10 North America Country-Level Share Breakdown, 2025 |
  54. FIGURE 11 Asia-Pacific Country-Level Growth Comparison, 2026–2035 |
  55. FIGURE 12 Competitive Landscape – Estimated Revenue Share Bands, 2026 |
  56. FIGURE 13 Strategic Positioning Map – Devices vs Services vs Therapeutics |
  57. FIGURE 14 Home Dialysis Penetration Outlook by Region, 2026–2035
Share::
Request Free Sample

Segmentation Quick Reference

DimensionSub-SegmentsDominant SegmentFastest Growing Segment
By Product TypeDiagnosis; TreatmentTreatmentDiagnosis
By End UserHospitals; Dialysis Centres; Homecare Settings; Other End UsersHospitalsDialysis Centres
By GeographyNorth America; Europe; Asia-Pacific; Middle East & Africa; South AmericaNorth AmericaAsia-Pacific


Market Segmentation Overview

By Product Type

Sub-SegmentKey Trend
DiagnosisPoint-of-care biomarker panels and AI-driven eGFR trajectory scoring move detection into primary care
TreatmentPharmacotherapy displaces incremental dialysis volume while consumables demand stays structurally stable.


Product-type economics are diverging. Treatment keeps the revenue mass because renal replacement is recurring and non-elective. Yet, diagnosis compounds faster as payers finally fund the detection layer that determines whether a patient ever reaches dialysis at all.

By End User

Sub-SegmentKey Trend
HospitalsRetain acute, comorbidity and transplant volume despite outpatient migration of routine dialysis.
Dialysis CentresOperator consolidation and tariff structures favouring outpatient delivery drive the fastest end-user growth
Homecare SettingsConnected cyclers and remote monitoring lift peritoneal and home haemodialysis penetration.
Other End UsersAmbulatory clinics and long-term care absorb overflow from constrained hospital capacity.


Where care happens is shifting faster than what care costs. Hospitals remain indispensable for crisis management, but the routine treatment base is migrating outward — first to dedicated centres, then increasingly to the home, with reimbursement policy setting the pace of each step.

By Geography

Sub-SegmentKey Trend
North AmericaValue-based nephrology contracts reward delayed dialysis initiation and transplant conversion.
EuropeStatutory tariffs cap per-patient revenue, pushing growth toward screening and drug mix.
Asia-PacificPublic dialysis programmes and low-cost domestic manufacturing expand treated populations rapidly.
Middle East & AfricaSovereign health investment builds nephrology capacity ahead of documented demand.
South AmericaPublicly funded tariffs concentrate operator risk while clinic consolidation continues.


Regional divergence is structural rather than cyclical. Mature markets grow through therapy sophistication and earlier intervention; emerging markets grow through access, as public insurance schemes convert previously untreated prevalence into funded treatment volume.




Share::
Request Free Sample
Download PDF ×

We do not share your information with anyone. However, we may send you emails based on your report interest from time to time. You may contact us at any time to opt-out.