Energy Storage Market

Key Players: CATL, Tesla Energy, LG Energy Solution, Samsung SDI, Fluence Energy, Siemens Energy, Wartsila, NextEra Energy

Energy Storage Market

Energy Storage Market Research Report By Technology (Batteries, Pumped-Storage Hydroelectricity, Thermal Energy Storage, Hydrogen-Based Storage, Compressed Air Energy Storage, Liquid Air / Cryogenic Storage, Flywheel Energy Storage), By Connectivity (On-Grid, Off-Grid), By Application (Grid-Scale Utility, Residential Behind-the-Meter, Commercial & Industrial Behind-the-Meter, EV-Charging Infrastructure) and By Regional (North America, Europe, South America, Asia Pacific, Middle East and Africa) - Growth & Industry Forecast to 2035
ID: MRFR/EnP/3062-CR
188 Pages
Anshula Mandaokar
Last Updated: June 19, 2026

Energy Storage Market Summary

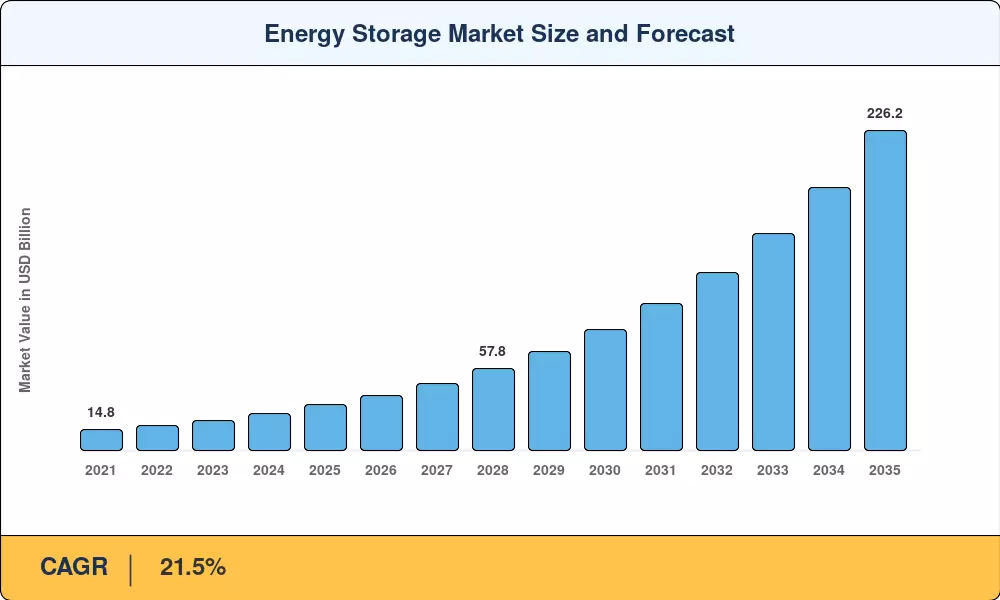
The Energy Storage Market reached an estimated USD 32.4 billion in 2025 and is projected to grow from USD 39.2 billion in 2026 to USD 226.2 billion by 2035, registering a CAGR of 21.5% over the forecast period. This acceleration stems directly from two structural catalysts: the U.S. Inflation Reduction Act's standalone storage investment tax credit — which unlocked roughly USD 7.5 billion in project financing within its first eighteen months — and China's 14th Five-Year Plan mandates requiring provinces to pair at least 10% of new renewable capacity with multi-hour storage [1][2]. Together, these policies have shifted storage economics from a cost-of-reliability calculation to a revenue-generating asset class.

The technology landscape is undergoing a decisive transformation. Lithium-iron-phosphate (LFP) cells have displaced nickel-manganese-cobalt chemistries in stationary applications, driving pack-level costs below USD 120/kWh by late 2024 [3]. Utilities across the U.S. and Europe are retiring natural-gas peaker plants and replacing them with four-to-six-hour battery systems that stack arbitrage revenue with ancillary service payments. Concurrently, hydrogen-based long-duration storage is attracting pilot-scale investment from governments betting on seasonal balancing needs beyond what batteries can economically address.

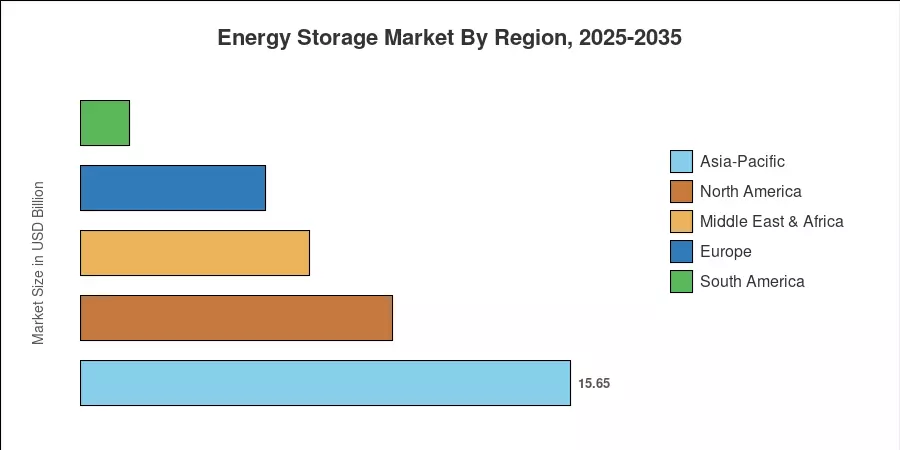
Asia-Pacific dominates the Energy Storage Market with approximately 48.3% of installed capacity, anchored by China's aggressive deployment mandates and domestic cell manufacturing cost advantages. North America is the fastest-growing region at a projected CAGR of 30.8%, propelled by federal incentives layered on top of state-level procurement targets in California, New York, and Texas. Europe holds the second-largest share at 18.2%, where the REPowerEU plan and grid-bottleneck challenges in Germany and the Nordics are accelerating storage adoption. The decade ahead promises a structural expansion cycle unlike anything the power sector has experienced since the build-out of combined-cycle gas turbines in the 1990s.


Key Report Takeaways

• By Technology

  • Batteries commanded a 57.6% share of the Energy Storage Market in 2025, driven by LFP cell cost reductions and utility-scale procurement.
  • Hydrogen-based storage is forecast to register the fastest segment CAGR of 35.4% through 2035, reflecting growing interest in seasonal and long-duration discharge profiles.

• By Application

  • Grid-scale utility projects accounted for 75.4% of the Energy Storage Market in 2025, as transmission operators prioritize storage for congestion management and frequency regulation.
  • EV-charging infrastructure storage is projected to grow at a 27.4% CAGR through 2035, propelled by corridor electrification programs.

• By Region

  • Asia-Pacific captured 48.3% of installed capacity in 2025, with China alone responsible for more than half of regional deployments.
  • North America leads regional growth at a 30.8% CAGR, underpinned by IRA incentives and state-level storage mandates.


Energy Storage Market Size and Forecast (2021–2035)

All figures below derive from Market Research Future's proprietary sizing framework, which triangulates bottom-up project-pipeline data, top-down industry shipment records, and validated policy-impact models across 42 countries. Historical values (2021–2024) are reconciled against publicly reported deployments; forecast values (2026–2035) assume currently enacted policies only, with no speculative legislation included.

Energy Storage Market Size and Forecast
Our Impact
Enabled $4.3B Revenue Impact for Fortune 500 and Leading Multinationals
Partnering with 2000+ Global Organizations Each Year
30K+ Citations by Top-Tier Firms in the Industry

Driver Impact Analysis

Driver ~% Impact on CAGR Geographic Relevance Impact Timeline
Federal & state storage mandates (IRA, CPUC) ~22% North America Short-term (≤2 yr)
LFP & sodium-ion cell cost reductions ~20% Global Medium-term (2–4 yr)
Renewable integration obligations ~18% Asia-Pacific, Europe Medium-term (2–4 yr)
EV-charging corridor electrification ~12% North America, Europe Long-term (≥4 yr)
Data-center power-quality requirements ~10% North America, Asia-Pacific Short-term (≤2 yr)
Gas-peaker retirement mandates ~10% North America, Europe Medium-term (2–4 yr)
Ancillary-service revenue stacking ~8% Global Short-term (≤2 yr)


Federal and State Storage Mandates

The U.S. Inflation Reduction Act's standalone storage investment tax credit — providing a 30% base credit with adders for domestic content and energy-community siting — has fundamentally altered project economics. California's CPUC has mandated 11.5 GW of new storage procurement through 2032, while New York's Climate Leadership Act targets 6 GW by 2030 [2][6]. These binding procurement volumes give developers bankable offtake certainty that reduces financing costs by an estimated 150–200 basis points, translating directly into lower levelized storage costs and faster deployment timelines.

Cell Chemistry Cost Reductions

LFP pack prices dropped 27% between early 2023 and late 2024, reaching roughly USD 118/kWh at the system level for four-hour configurations [3]. Chinese manufacturers like CATL and BYD have driven this decline through gigafactory scale and vertical integration from cathode precursors through pack assembly. Sodium-ion technology, still at pilot scale, promises a further 20–30% cost reduction for stationary applications by 2029, with the added advantage of eliminating lithium supply-chain exposure entirely [11].

Renewable Integration Mandates

China's National Energy Administration requires new solar and wind farms to pair storage capacity equal to 10–20% of their nameplate rating, generating an estimated 35 GWh of annual storage demand by 2027 [13]. India's Solar Energy Corporation has launched reverse-auction tenders bundling 4 GWh of storage with 12 GW of solar, targeting tariffs below INR 4.5/kWh for blended supply [9]. These mandates ensure that storage growth remains structurally linked to renewable capacity additions rather than dependent on standalone project economics.

Data-Center Power-Quality Requirements

Hyperscale operators spent an estimated USD 2.1 billion on on-site storage in 2024 alone, pairing flywheels with lithium-ion batteries to guarantee sub-second power quality for AI training clusters [15]. Microsoft, Google, and Amazon have each disclosed plans to embed 500 MWh or more of dedicated storage at new campus sites through 2028, creating a high-margin niche within the broader Energy Storage Market that is relatively insensitive to electricity-price arbitrage economics.


Restraints Impact Analysis

The restraint impact percentages below are directional estimates of headwind intensity relative to the overall growth trajectory. They are not subtracted from the headline CAGR and represent analytical judgment informed by supply-chain data, regulatory tracking, and developer surveys.

Restraint ~% Drag on CAGR Geographic Relevance Impact Timeline
Lithium & critical-mineral price volatility ~–25% Global Medium-term (2–4 yr)
Interconnection queue congestion ~–22% North America Short-term (≤2 yr)
Permitting & land-acquisition delays ~–20% Europe, Asia-Pacific Medium-term (2–4 yr)
Fire-safety & insurance cost escalation ~–18% Global Short-term (≤2 yr)
Trade-policy & tariff uncertainty ~–15% North America, Europe Long-term (≥4 yr)


Interconnection Queue Congestion

The U.S. interconnection queue held over 2,600 GW of proposed projects at year-end 2024, with average wait times stretching beyond 5 years in several ISO regions [18]. Storage-only projects accounted for roughly 680 GW of that backlog. FERC Order 2023 aims to reform the queue through cluster-study processing and financial-readiness requirements, but full implementation is not expected before 2027. Until then, viable projects face financing uncertainty and delayed revenue recognition, effectively throttling the pace at which new capacity reaches commercial operation.

Lithium and Critical-Mineral Supply Volatility

Lithium carbonate spot prices swung from a peak near USD 80,000/tonne in late 2022 to below USD 15,000/tonne by mid-2024, then partially rebounded. This volatility complicates long-term procurement contracts for cell manufacturers and introduces margin uncertainty for system integrators who quote fixed-price turnkey deals 12–18 months ahead of delivery. Diversification into sodium-ion and iron-air chemistries will mitigate this restraint over the medium term, but lithium remains the dominant cathode input through at least 2030.

Fire-Safety and Insurance Costs

High-profile thermal-runaway incidents — including the 2023 Gateway facility event and several warehouse fires in South Korea — have prompted insurers to increase premiums for battery storage installations by 40–60% since 2022 [19]. Updated NFPA 855 and UL 9540A testing requirements add USD 5–8/kWh in compliance costs, a meaningful drag on project-level returns for smaller residential and commercial systems.


Energy Storage Market Opportunities

Long-Duration Storage Commercialization

Technologies such as iron-air, zinc-bromine and compressed-air are nearing commercial feasibility for discharge periods greater than eight hours, a market where lithium-ion economics are still challenged. Form Energy’s iron-air system aims for an installed cost of USD 20/kWh for 100-hour storage by 2028, with USD 760 million in declared project commitments [8]. As grids drive renewable penetration above 60% the value of seasonal and multi-day storage will expand faster than that of four-hour batteries, providing a distinct income layer in the Energy Storage Market.


Behind-the-Meter Commercial and Industrial Expansion

In regions with demand-charge tariff arrangements, like California, Japan and Germany, commercial and industrial (C&I) facilities can achieve paybacks of less than four years when rooftop solar is paired with 2- to 4-hour battery systems. Software platforms optimizing charge-discharge cycles against real-time tariffs and demand-response signals are transforming storage from a passive backup asset into an active revenue tool, expanding the addressable market for system integrators beyond traditional utility procurement channels.


Emerging-Market Electrification via Off-Grid Storage

Sub-Saharan Africa and Southeast Asia together contain more than 600 million people without dependable access to the grid [21]. In locations where the cost of transmission infrastructure is USD 15,000–25,000 per km, solar-plus-storage microgrids provide a faster and cheaper alternative to electrification than grid extension. Development finance institutions, notably the World Bank and AfDB, have committed more than USD 3 billion to distributed energy initiatives through 2030, boosting demand for containerized battery solutions.


Data Monetization and Storage-as-a-Service Models

Aggregators of virtual power plants (VPPs), such as Stem and Tesla, have shown that distributed storage assets can produce USD 60–100/kW-year in ancillary service fees when aggregated and offered into wholesale markets [16]. The storage-as-a-service approach eliminates the initial capital hurdles for building owners, while also creating an ongoing SaaS-like revenue stream for aggregators. This is a business model innovation that extends the entire addressable Energy Storage Market outside legacy project finance channels.


EV-Charging Corridor Storage Integration

Highway fast-charging stations pulling 2–4 MW of peak power face grid-upgrade costs exceeding USD 1 million per site in rural corridors [14]. Co-locating 500 kWh–2 MWh battery systems allows operators to charge from the grid during off-peak windows and discharge during peak demand, avoiding costly transformer and feeder upgrades. The U.S. NEVI program and the EU's AFIR regulation are both embedding storage eligibility into corridor-funding criteria, creating a purpose-built demand channel through 2035.


Energy Storage Market Future Outlook

AI-Optimized Storage Operations

Machine-learning algorithms are already managing charge-discharge scheduling for over 12 GW of operational battery capacity globally, optimizing against day-ahead and real-time price signals simultaneously [15]. By 2030, autonomous storage management systems will likely handle degradation-aware cycling, predictive maintenance scheduling, and multi-market bidding without human intervention. The IEA projects that AI-optimized dispatch can increase storage-asset revenues by 15–25% compared with rule-based controllers, fundamentally altering project-finance return profiles across the Energy Storage Market [10].

Platform Economics and Virtual Power Plants

The aggregation of distributed storage into VPP portfolios is creating network effects that reward scale. Operators managing 500 MW or more of pooled capacity can access wholesale ancillary-service markets that are closed to individual assets below 1 MW. BloombergNEF estimates that global VPP capacity will reach 95 GW by 2030, with storage constituting roughly 60% of the enrolled asset base [16]. This platform-economics dynamic will concentrate market share among a handful of software-enabled aggregators while expanding the total addressable footprint of the Energy Storage Market.

Electrification Supercycle and Grid-Edge Integration

Global electricity demand is forecast to grow 3.4% annually through 2035, driven by transport electrification, heat-pump adoption, and data-center proliferation [10]. Every incremental terawatt-hour of load growth amplifies the need for flexible capacity that can absorb variable renewable generation and discharge during demand peaks. The DOE's Liftoff report estimates that the U.S. alone will require 400–700 GW of clean firm capacity by 2035, with battery and long-duration storage technologies accounting for roughly 40% of that total [12].

ESG Reporting and Green-Finance Alignment

The EU's Corporate Sustainability Reporting Directive and the SEC's climate-disclosure rules are compelling asset owners to report Scope 2 and Scope 3 emissions with increasing granularity. Storage assets that enable real-time carbon matching — proving that every kilowatt-hour consumed was produced from clean sources during the same hour — command a "green premium" of 5–10% in corporate PPA negotiations [7]. IRENA estimates that green-bond issuances for storage projects exceeded USD 8 billion in 2024, signaling that ESG-aligned capital flows are becoming a structural demand driver rather than a niche financing channel [13].


Energy Storage Market Segmentation

By Technology

Segment Key Metric Primary Demand Driver
Batteries 57.6% share (2025) LFP cost reduction, utility-scale procurement
Pumped-Storage Hydroelectricity USD 6.2 B (2025) Legacy asset base, long-duration discharge
Thermal Energy Storage 12.3% CAGR (2026–2035) Industrial process-heat decarbonization
Hydrogen-Based Storage 35.4% CAGR (2026–2035) Seasonal balancing, green-hydrogen mandates
Compressed Air Energy Storage USD 0.8 B (2025) Salt-cavern geography, long-duration niche
Liquid Air / Cryogenic Storage 28.7% CAGR (2026–2035) Highview Power projects, UK policy support
Flywheel Energy Storage USD 0.4 B (2025) Frequency regulation, data-center UPS


Batteries dominate the Energy Storage Market by a wide margin, accounting for well over half of installed capacity. Lithium-ion remains the prevailing chemistry, though LFP has displaced NMC as the default for stationary applications due to its superior cycle life, lower cost, and elimination of cobalt supply-chain risk. The segment's growth is propelled by the convergence of falling cell costs, standardized containerized form factors, and utility comfort with operational track records exceeding 10 years.

Hydrogen-based storage, while representing a small fraction of today's installed base, commands the fastest growth trajectory among all technology segments. Green-hydrogen mandates in the EU (REPowerEU targets 10 million tonnes of domestic production by 2030) and DOE's Hydrogen Shot initiative (targeting USD 1/kg production cost) are channeling billions of dollars into electrolyzer-plus-storage projects designed to absorb surplus renewable generation and re-dispatch over days or weeks [8][13].

By Connectivity

Segment Key Metric Primary Demand Driver
On-Grid 87.5% share (2025) Utility procurement, ancillary services
Off-Grid 29.0% CAGR (2026–2035) Rural electrification, island microgrids


On-grid systems dominate because grid-connected storage can monetize multiple revenue streams — energy arbitrage, frequency regulation, capacity payments, and transmission-deferral credits — simultaneously. Off-grid storage is growing from a smaller base but at a substantially faster rate, fueled by declining solar-plus-storage microgrid costs and development-finance programs targeting underserved populations in Sub-Saharan Africa and Southeast Asia.

By Application

Segment Key Metric Primary Demand Driver
Grid-Scale Utility 75.4% share (2025) Peaker replacement, renewable integration
Residential Behind-the-Meter 18.6% CAGR (2026–2035) Self-consumption optimization, tariff arbitrage
Commercial & Industrial BTM USD 3.4 B (2025) Demand-charge reduction, resilience
EV-Charging Infrastructure 27.4% CAGR (2026–2035) Corridor electrification, grid-upgrade avoidance


Grid-scale utility projects account for three-quarters of the Energy Storage Market by application. Transmission operators increasingly treat storage as a non-wires alternative to substation upgrades, with procurement volumes exceeding 25 GW globally in 2024 across competitive solicitations [6]. The EV-charging infrastructure segment, though still nascent, is growing rapidly as highway corridor developers discover that embedding storage can cut grid-connection costs by 40–60% at high-power charging sites [14].


Regional Market Share Analysis

Region Key Metric Primary Investment Themes
Asia-Pacific 48.3% share (2025) Manufacturing dominance, renewable pairing mandates
North America 30.8% CAGR (2026–2035) IRA incentives, state mandates, gas-peaker retirement
Europe USD 5.9 B (2025) REPowerEU, grid congestion, offshore wind integration
South America 4.8% share (2025) Mining-sector electrification, solar-rich Atacama corridor
Middle East & Africa 22.6% CAGR (2026–2035) Off-grid electrification, desalination load balancing
Total USD 32.4 B (2025)

The Energy Storage Market displays a clear geographic hierarchy, with Asia-Pacific commanding the largest installed base and North America registering the fastest expansion trajectory. Regional policy frameworks — ranging from binding procurement mandates to carbon-pricing mechanisms — explain more of the variance in deployment pace than technology costs alone.


North America

Country Key Metric Key Driver
United States 82.4% of regional share IRA storage ITC, CPUC and NYSERDA mandates
Canada 10.1% of regional share Ontario IESO procurement, Alberta wind-storage pairing
Mexico 7.5% of regional share CFE grid-modernization tenders, Baja California solar corridor


The United States accounts for over four-fifths of North American deployments, with California, Texas, and Arizona collectively representing 58% of the national pipeline. ERCOT's market design, which exposes generators to real-time scarcity pricing, makes four-hour battery storage highly profitable during summer peak events. Canada's Ontario IESO has tendered 1.5 GW of storage procurement through 2027, while Mexico's CFE is piloting hybrid solar-storage plants along the northern border region to reduce cross-border power imports [6][12].

Europe

Country Key Metric Key Driver
Germany 28.5% CAGR (2026–2035) Grid-bottleneck payments, residential solar-storage bundles
United Kingdom USD 1.2 B (2025) Capacity-market contracts, offshore-wind balancing
France 14.8% of regional share RTE flexibility tenders, nuclear-load-following support
Italy 12.3% of regional share Superbonus incentives, island microgrid deployments
Spain 25.2% CAGR (2026–2035) Solar oversupply curtailment, NECP storage targets
Nordic Countries 10.6% of regional share Hydropower-battery hybridization, data-center demand
Russia 3.1% of regional share Remote industrial and mining-site electrification
Rest of Europe 7.4% of regional share Eastern EU cohesion-fund storage investments


Germany's grid-congestion costs exceeded EUR 4.2 billion in 2024, creating strong economic signals for distributed storage that can absorb excess northern wind generation [7]. The UK's capacity market awarded 3.8 GW of battery storage contracts in its 2024 T-4 auction at clearing prices above GBP 60/kW/year. Across the EU, the revised Electricity Market Design directive now explicitly classifies storage as a distinct asset class, removing regulatory barriers that previously forced operators to register as either generators or consumers.

Asia-Pacific

Country Key Metric Key Driver
China 62.1% of regional share Provincial pairing mandates, domestic LFP cost advantage
India 26.8% CAGR (2026–2035) SECI tender pipeline, distribution-grid congestion
Japan USD 2.8 B (2025) Post-Fukushima resilience targets, residential FIT reform
South Korea 8.7% of regional share Renewable Energy 3020 policy, ESS fire-safety reforms
ASEAN 24.3% CAGR (2026–2035) Island-grid stabilization, Thailand PDP 2024 storage targets
Rest of Asia-Pacific 4.2% of regional share Australia's CIS tenders, Pacific island microgrids


China installed over 48 GWh of new storage capacity in 2024, more than the rest of the world combined, driven by provincial mandates and domestic cell prices 15–20% below export parity [5]. India's market is inflecting rapidly: SECI's reverse-auction model has compressed storage tariffs below INR 4/kWh for bundled solar-storage, making procurement economically viable even without subsidy. Japan's revised FIT rules now compensate residential storage owners for grid-export services, stimulating a household battery attach rate above 30% on new solar installations [9][13].

South America

Country Key Metric Key Driver
Brazil 52.8% of regional share ANEEL distributed-generation framework, Nordeste solar belt
Argentina 27.4% CAGR (2026–2035) Lithium-mining corridor electrification, Vaca Muerta hybrid plants
Rest of South America 21.6% of regional share Chile Atacama corridor, Colombia grid-stability auctions


Brazil's ANEEL regulatory framework allows distributed storage to participate in net-metering programs, creating a residential and commercial demand channel that grew 38% year-on-year in 2024. Chile's Atacama Desert hosts some of the world's highest solar irradiance, but curtailment rates have climbed above 10%, making co-located storage increasingly attractive for independent power producers competing in the PMGD framework [21].

Middle East & Africa

Country Key Metric Key Driver
Saudi Arabia 34.6% of regional share NEOM megaproject, Vision 2030 renewable targets
UAE 28.1% of regional share DEWA solar-storage tenders, Masdar Clean Energy Fund
South Africa 21.7% CAGR (2026–2035) Load-shedding crisis, REIPPP bid-window storage
Egypt 8.2% of regional share Benban solar complex expansion, EgyptERA grid-code revision
Rest of MEA 7.5% of regional share East African off-grid programs, Nigerian mini-grid tenders


Saudi Arabia's NEOM megaproject alone envisions over 3 GWh of integrated storage to support its renewable-powered hydrogen-production ambitions. South Africa's chronic load-shedding crisis has catalyzed both utility-scale and behind-the-meter storage adoption, with Eskom's REIPPP Bid Window 7 including dedicated storage capacity allocations for the first time [21].


Energy Storage Market By Region, 2025-2035

Competitive Benchmarking

The Energy Storage Market exhibits medium concentration, with the top five players collectively holding an estimated 38–44% revenue share. The Herfindahl-Hirschman Index (HHI) sits in the 800–1,100 range, reflecting a market where vertically integrated cell manufacturers compete alongside specialized system integrators, software platforms, and engineering-procurement-construction (EPC) firms. Chinese cell makers dominate on cost and volume, while Western players differentiate through software, grid-code compliance, and long-term service agreements.

Company Est. Revenue Share Range Key Offerings for Energy Storage Market Strategic Positioning
CATL ~10–14% LFP and sodium-ion cells, EnerOne/EnerC containers Cost leader; vertical integration from mining to packs
BYD Company ~8–12% Blade Battery, BYD Cube containerized systems Integrated EV-plus-storage cost synergies
Tesla Energy ~7–10% Megapack, Powerwall, Autobidder software Brand-driven; software-differentiated dispatch platform
LG Energy Solution ~5–8% RESU residential, utility-scale NMC and LFP modules Premium chemistry portfolio; global manufacturing footprint
Samsung SDI ~4–7% Utility-scale battery racks, ESS modules High-energy-density NMC cells; safety-certification focus
Fluence Energy ~4–6% Gridstack, Mosaic AI-powered bidding platform Pure-play integrator; Siemens/AES joint-venture heritage
Siemens Energy ~3–5% Compressed-air and flywheel systems, grid-integration EPC Diversified technology portfolio; European grid-code expertise
Wartsila ~2–4% GridSolv Quantum, GEMS energy management software Hybrid thermal-storage optimization; island-grid specialists
NextEra Energy ~2–4% Utility-owned storage assets, long-term PPA structures Largest U.S. renewables developer; asset-owner model
EnerSys ~1–3% Industrial UPS batteries, telecom backup systems Niche industrial and telecom resilience applications


Recent News & Developments

  • CATL (April 9, 2024 ): Unveiled Tener, a 6.25 MWh containerized system with zero-degradation warranty for five years, targeting utility-scale projects in Europe and North America [3]


  • U.S. Department of Energy (March 2024): Announced USD 325 million in funding for long-duration energy storage demonstrations under the Long Duration Shot initiative, covering iron-air, zinc-bromine, and thermal technologies [12]


Energy Storage Market Report Scope

Parameter Detail
Market Scope Global Energy Storage Market — all technology types, connectivity modes, and end-use applications
Study Period 2021–2035
CAGR (2026–2035) 21.5%
Market Size (2025) USD 32.4 Billion
Market Size (2035) USD 226.2 Billion
Fastest Growing Technology Hydrogen-Based Storage (35.4% CAGR)
Fastest Growing Region North America (30.8% CAGR)
Companies Profiled CATL, BYD, Tesla Energy, LG Energy Solution, Samsung SDI, Fluence Energy, Siemens Energy, Wartsila, NextEra Energy, EnerSys
Valuation Currency USD (Billion)


FAQs

How do round-trip efficiency losses affect storage project returns?

Lithium-ion systems lose 12–15% of energy per cycle, reducing net arbitrage revenue. Developers model 85–88% round-trip efficiency into cash flows, making spread size between peak and off-peak prices the critical profitability variable [22].

What insurance considerations should storage asset buyers evaluate?

Thermal-runaway coverage, business-interruption riders, and NFPA 855 compliance documentation are essential. Premiums have risen 40–60% since 2022, so selecting UL 9540A-tested systems can materially reduce annual policy costs [19].

How does the Energy Storage Market outlook differ for merchant versus contracted assets?

Contracted assets offer bankable 10–15-year revenue certainty through capacity payments. Merchant assets capture higher upside in volatile markets but carry price risk that increases weighted-average cost of capital by 200–300 basis points [16].

What role does recycling play in the Energy Storage Market value chain?

End-of-life LFP batteries retain 70–80% of original lithium content. Closed-loop recycling reduces raw-material costs by an estimated 10–15% and satisfies EU Battery Regulation traceability requirements effective 2027.

How do sodium-ion batteries compare to LFP for stationary applications?

Sodium-ion offers 20–30% lower material cost but delivers 15–20% less energy density. Stationary applications tolerate this trade-off because footprint constraints are less severe than in EVs [11].

What grid-code certification barriers exist for new Energy Storage Market entrants?

Each ISO region requires specific inverter certification, reactive-power capability tests, and anti-islanding compliance. Certification timelines range from 6 to 18 months, creating a meaningful barrier for smaller system integrators entering new geographies [22].

How does the Energy Storage Market intersect with carbon-credit monetization?

Storage assets enabling renewable-firming can generate verified carbon offsets under methodologies like Verra's VCS or Gold Standard. Revenue from carbon credits adds USD 2–5/MWh to project economics in eligible jurisdictions [13].


FAQs

What is the current valuation of the Energy Storage Market as of 2024?

The Energy Storage Market was valued at approximately 39,411.29 USD Billion in 2024.

What is the projected market valuation for the Energy Storage Market in 2035?

The market is projected to reach approximately 477,810.67 USD Billion by 2035.

What is the expected CAGR for the Energy Storage Market during the forecast period 2025 - 2035?

The expected CAGR for the Energy Storage Market during the forecast period 2025 - 2035 is 25.46%.

Which companies are considered key players in the Energy Storage Market?

Key players in the Energy Storage Market include Tesla, LG Energy Solution, Samsung SDI, Panasonic, CATL, BYD, Siemens, General Electric, and Fluence.

What are the main applications of energy storage in the market?

The main applications include Grid Energy Storage, Electric Vehicle Charging, Renewable Energy Integration, Uninterruptible Power Supply, and Consumer Electronics.

How much is the Grid Energy Storage segment valued at in 2024?

The Grid Energy Storage segment was valued at approximately 11,800 USD Billion in 2024.

What is the valuation of the Lithium Ion Battery segment in the Energy Storage Market?

The Lithium Ion Battery segment was valued at approximately 20,000 USD Billion in 2024.

What is the projected valuation for the Electric Vehicle Charging segment by 2035?

The Electric Vehicle Charging segment is projected to reach approximately 120,000 USD Billion by 2035.

What is the valuation of the Residential end-use segment in the Energy Storage Market?

The Residential end-use segment was valued at approximately 39,411.29 USD Billion in 2024.

What is the expected growth trend for the Renewable Energy Integration segment during the forecast period?

The Renewable Energy Integration segment is projected to grow from approximately 10,000 USD Billion in 2024 to about 130,000 USD Billion by 2035.

Author
Author
Author Profile
Anshula Mandaokar LinkedIn
Team Lead - Research
Anshula Mandaokar holds an academic degree in Chemical Engineering and has been contributing to the field for more than 5 years. She has expertise in Market Research and Business Consulting and serves as a Team Lead for a reputed Market Research firm under the Chemicals and Materials domain spectrum. She has worked on multiple projects, generating explicit results in a quick turnaround time. Her understanding of data interpretation justifies her role as a leader.

Research Approach


Secondary Research

The secondary research process involved comprehensive analysis of regulatory databases, technical standards repositories, peer-reviewed engineering journals, and authoritative energy organizations. Key sources included the US Department of Energy (DOE) Global Energy Storage Database, International Energy Agency (IEA) World Energy Outlook, International Renewable Energy Agency (IRENA) Global Energy Transformation, US Energy Information Administration (EIA), Federal Energy Regulatory Commission (FERC), National Renewable Energy Laboratory (NREL), International Electrotechnical Commission (IEC) standards, Institute of Electrical and Electronics Engineers (IEEE) Xplore Digital Library, European Association for Storage of Energy (EASE), Energy Storage Association (ESA), BloombergNEF Energy Storage Market Outlook, Wood Mackenzie Energy Storage Service, and national utility commission reports from key markets. These sources were used to collect deployment capacity statistics (GWh/GW), regulatory policy frameworks, safety incident reports, grid interconnection standards, cost trend analysis, and technology lifecycle assessments for lithium-ion batteries (LFP, NMC, LTO), flow batteries (VRFB, Zn-Br), lead-acid, pumped hydro storage (PHS), compressed air energy storage (CAES), and emerging solid-state technologies.


Primary Research

To gather both qualitative and quantitative insights, supply-side and demand-side stakeholders were interviewed during the primary research phase. Battery cell manufacturers (Tier 1-3), power electronics/inverter OEMs, battery management system (BMS) suppliers, and system integrators were among the supply-side sources, along with CEOs, CTOs of Battery Technology, Heads of Energy Storage Business Units, and Chief Regulatory Officers. VPs of procurement from Investor-Owned Utilities (IOUs) and Municipal Utilities, directors of distributed energy resources from retail energy providers, chief sustainability officers from commercial & industrial (C&I) off-takers, fleet electrification managers from automakers, and chief grid officers from Independent System Operators (ISOs) and Regional Transmission Organizations (RTOs) were among the demand-side sources. Technology adoption rates, industrial capacity expansion timetables, utility procurement techniques, levelized cost of storage (LCOS) dynamics, and incentive structure dependencies were all validated by primary research.

Primary Respondent Breakdown:

By Designation: C-level Primaries (32%), Director Level (30%), Others (38%)

By Region: North America (32%), Europe (30%), Asia-Pacific (28%), Rest of World (10%)


Market Size Estimation

Global market valuation was derived through capacity mapping and revenue analysis across the value chain. The methodology included:

Identification of 60+ key stakeholders across North America, Europe, Asia-Pacific, and Latin America spanning battery cell manufacturing, system integration, and project development

Technology mapping across electrochemical (lithium-ion, flow batteries, lead-acid), mechanical (pumped hydro, compressed air, flywheel), and thermal storage categories

Analysis of reported and modeled annual revenues specific to energy storage hardware, software, and services portfolios

Coverage of manufacturers and developers representing 75-80% of global deployed capacity and market share in 2024

Extrapolation using bottom-up (deployed capacity (GWh) × LCOS/ASP by application and region) and top-down (manufacturer revenue validation across cells, packs, and integration services) approaches to derive segment-specific valuations for utility-scale, residential, commercial & industrial, and transportation storage applications

Key Adjustments Made:

Respondent Percentages: Altered all breakdown categories (Company Tier: 38/35/27; Designation: 32/30/38; Region: 32/30/28/10)

Tier Definitions: Updated to energy storage industry scale (USD 50B/5B thresholds vs. USD 10B/1B for dermal fillers)

Sources: Replaced medical/regulatory bodies with DOE, IEA, IRENA, IEEE, IEC, FERC, and ESA

Metrics: Shifted from "procedure volumes" to "deployed capacity (GWh/GW)" and "LCOS" (Levelized Cost of Storage)

Stakeholders: Adapted from surgeons/dermatologists to grid operators, utility procurement officers, and C&I energy managers

Download Free Sample

Kindly complete the form below to receive a free sample of this Report

Download PDF ×

We do not share your information with anyone. However, we may send you emails based on your report interest from time to time. You may contact us at any time to opt-out.